-
Notifications
You must be signed in to change notification settings - Fork 65
CutTool
Prev (Overview tool) | Home | Manual | Index | (Reference tool) Next
Table of contents
With the help of the cut tool, the user can cut off (crop) unwanted parts at the edges of a raster map (e.g. map descriptions). To do this a polygon (a mask) has to be defined. The map area within this polygon (and in the map) is kept as new map area, the area outside the polygon is removed from the map. Technically, this is done by making the outside part of the map image transparent. As a consequence, only the transparency information in the map image (the alpha channel values) and not the image size itself is changed. Thus, cutting a map is without influence on existing reference points for the map.
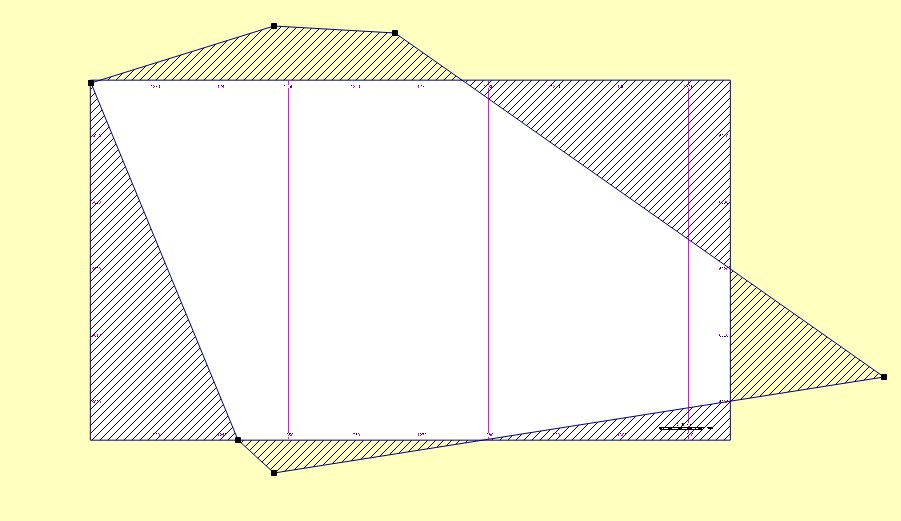
In the following image, the map area (without content, only grid lines have been drawn for better visibility) is delimited by a black rectangular frame. The cut polygon is defined with the help of 6 points (vertices), 4 of them outside the map area. The shaded area within the map is cut off from the map (is made transparent).
To cut a map proceed as follows:
- Select the menu entry
Window - Shellto open the QMT shell window (docked window, can be moved on the desktop). - Click the
Cut mapbutton in the QMTToolswindow to open the cut tool. - Click the
Open(Add map files to list) icon ( ) and select a raster map. The raster map is loaded into the QMT map window.
 - Click the
Add point to maskicon ( ). The map cursor now is a cross-hair one.
 - Move the mouse cursor to the first polygon point as precisely as possible (use the mouse wheel to zoom map!) and left-click to fix the point.
- Move the mouse to the next polygon point and fix it with a left-click. Continue until the polygon mask has the wanted shape. Remark: Starting with the third point the cut polygon is visible as an area.
- Click the
Startbutton to cut the map. The filename of the new map file gets an additional suffix (default:_cut). - The shell window (if activated) shows the used GDAL commands and the progress of the operation.
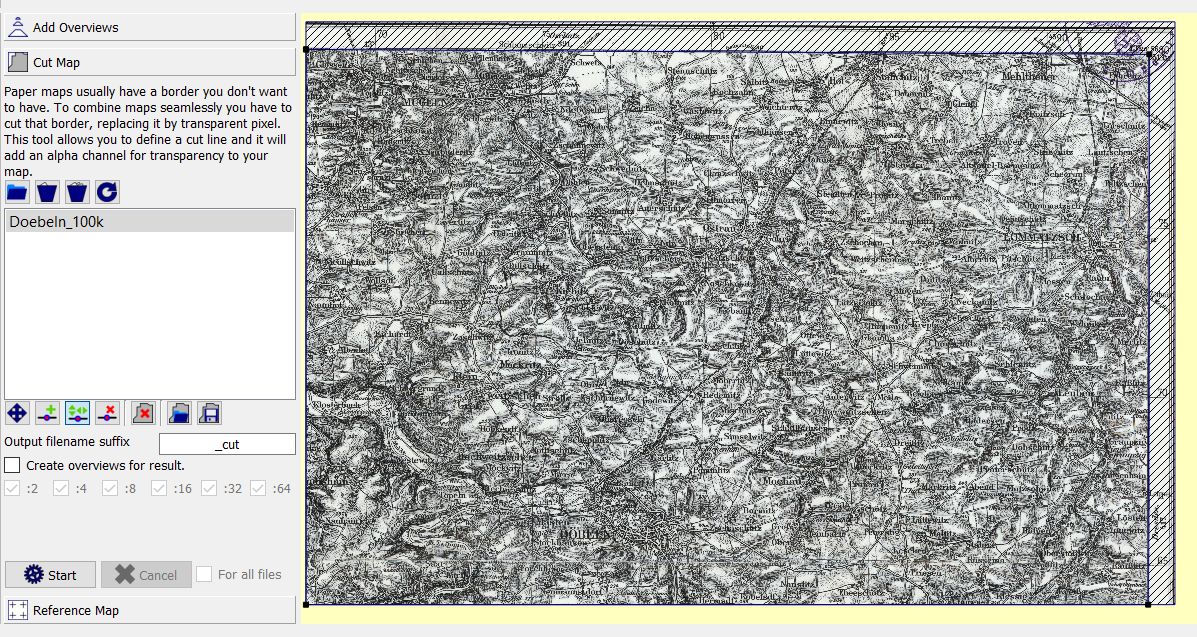
The following image shows the complete cut tool with a map and a mask that removes the non-map parts of the printed map.
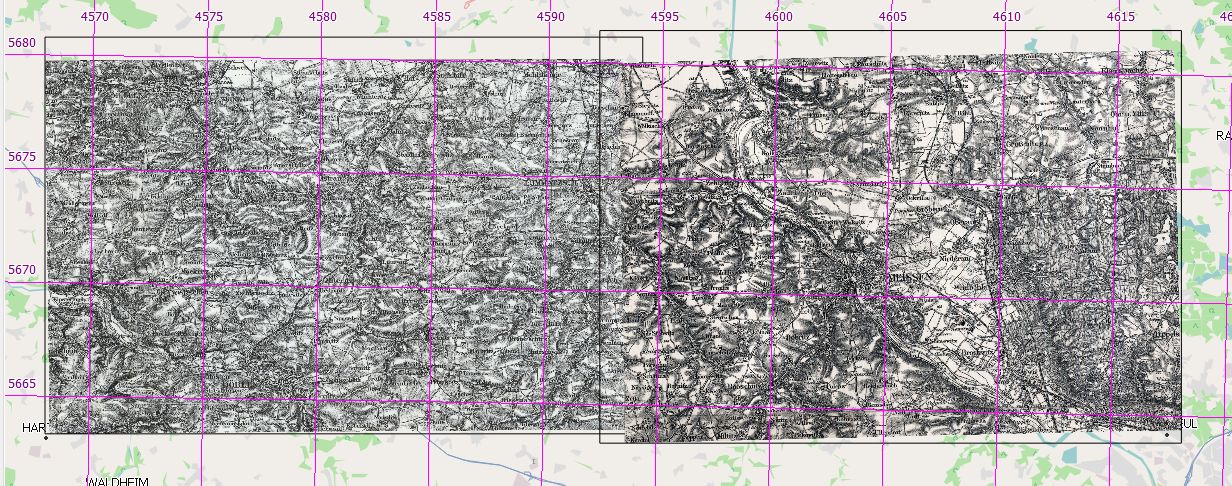
An advantage of the use of cut maps is that several neighboring ones can be rendered smoothly as demonstrated in the following image:
In addition to the basic steps described in the previous section some more actions can be carried out in the cut tool:
| Icon | Tooltip | Comment |
|---|---|---|
 |
Remove selected (map) file from the list | |
 |
Clear complete list of map files | |
 |
Reload the currently selected map | |
 |
Move the map and zoom | Zoom with mouse wheel. |
 |
Add point to mask | Left-click on polygon edge (selected edge is red), move mouse to new location, left-click again to fix the new point. |
 |
Move points of mask | Reposition misplaced mask point. Left-click the mask point in the map, move it to new location, left-click again to fix it. |
 |
Remove point from mask | Left-click on a mask point in the map to remove the point. |
 |
Remove complete cut mask | Requires additional confirmation of deletion of whole mask. |
 |
Load reference points from shape file | Load previously defined cut mask from file. |
 |
Save reference points into shape file | Save cut mask for future use. |
Remarks:
- It is possible to open several map files and to define cut masks for each of these files. If the checkbox
For all filesat the bottom of the tool is checked, then the cutting is carried out for each of the loaded map files. - The
Create overviews ...option is available in 4 QMT tools (cut tool, overview tool, reference tool, palette tool). This is necessary because there is no fixed order of using these tools. When one of these tools calls GDAL for some operation, then GDAL doesn't read the overview information contained in the raster map file. Thus, overview information should be recreated after such a GDAL operation and this is supported in each of the tools. - Raster maps can have a considerable size. To get quickly a precise cut mask the following approach can help:
- Zoom out to display the complete map.
- Build a first cut mask on the complete map. Iteratively refine this map as described in the next steps.
- Select the
Move pointsicon (or also theAdd pointicon). - Locate the mouse near a cut point and zoom in so that the cut point remains visible.
- Move the cut point on this zoom level to its precise location.
- Repeat the previous step for each cut point.
- The cut tool can be used for referenced and unreferenced map images. When cutting a referenced map, then the resulting cut map is again a referenced map. Saved cut masks consist of a list of the used reference points. In the case of an unreferenced map, the reference points are defined using their pixel coordinates whereas for referenced maps geocoordinates are used (for a restriction compare Example 2). Thus, a saved cut mask for a referenced map can be used for another referenced map, too. Example 2 below demonstrates the repeated use of a cut mask.
- Experienced users may change some GDAL default parameters to equilibrate performance, image file size, and image accuracy using a special group box for GDAL parameters. For details compare the page "Optional GDAL settings".
http://loadmap.net is a server for a wide variety of raster maps covering large parts of the world. Among them are various kinds of Russian army and topographic maps.
These maps have a large boundary for map metadata information.
Typically, Russian military maps are georeferenced with reference information provided in the OziExplorer MAP format.
Using a text editor and the information from the MAP file it is easy to cut such maps with QMT. Follow these steps for downloading and cutting a map:
-
Select a map on http://loadmap.net.
-
When downloading the selected map, 2 files are offered: a GIF and a MAP file. Download both files and put them into some directory.
-
As an example, the files
001m--m36--(1989).gif,001m--m36--(1989).mapwill be used in this discussion -
First approach:
-
Open the MAP file in a text editor and find the lines labeled
MMPXYnear the bottom of the file. -
In the example these lines are
  MMPXY,1,219,86
  MMPXY,2,3466,90
  MMPXY,3,3598,3594
  MMPXY,4,74,3591
(meaning of the lines: pixel coordinates of the 4 corners of the map area in the GIF file).
-
Add the first line of this block once again at the end of the block.
-
Convert this block with the editor to
id,WKT 1,"POLYGON((219 86, 3466 90, 3598 3594, 74 3591, 219 86))" -
Save these 2 lines to a new file with filename
001m--m36--(1989)_1.shp. -
Start QMT and open the cut map tool in QMT.
-
Load
001m--m36--(1989).gifinto the cut tool. -
Select the
Load cut mask from shape fileicon in the toolbar and load the file001m--m36--(1989)_1.shp. -
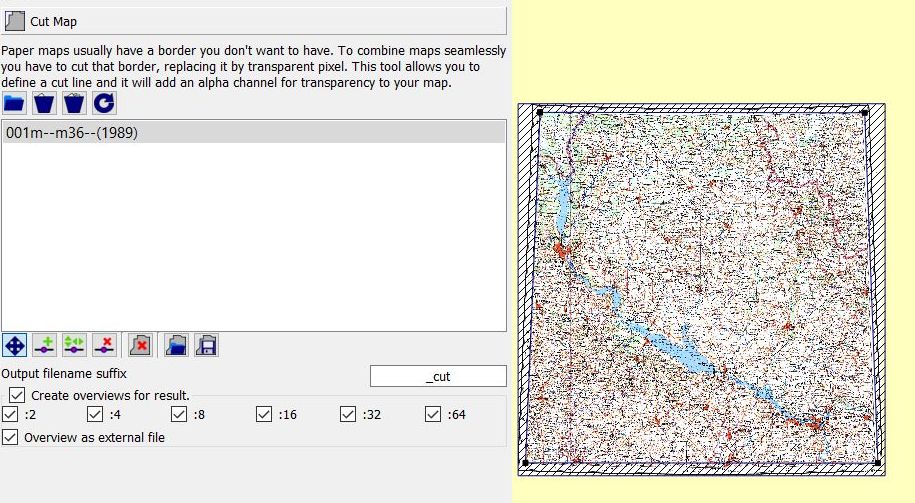
The map window shows now a cut mask with cut points in the 4 corners of the map area as shown in the next image:
If necessary, improve the cut mask manually as described on this page.
-
Click
Startto create a new map file which will be displayed without the boundary area (boundary area is now transparent).
-
-
Second approach (more precise):
-
Carefully checking the cut mask obtained in the first approach makes the weakness of this map obvious: there is still some part of the boundary not cut from the map:

-
Open the MAP file in a text editor and find the lines labeled
POINTnear the top of the file. -
In the example the lines are
  Point01,xy,  219,   86,in, deg,  52,  0.0000,N,  30,  0.0000,E, grid,   ,           ,           ,N
  Point02,xy, 1842,  121,in, deg,  52,  0.0000,N,  33,  0.0000,E, grid,   ,           ,           ,N
  Point03,xy, 3466,   90,in, deg,  52,  0.0000,N,  36,  0.0000,E, grid,   ,           ,           ,N
  Point04,xy,  147, 1839,in, deg,  50,  0.0000,N,  30,  0.0000,E, grid,   ,           ,           ,N
  Point05,xy, 1839, 1873,in, deg,  50,  0.0000,N,  33,  0.0000,E, grid,   ,           ,           ,N
  Point06,xy, 3533, 1842,in, deg,  50,  0.0000,N,  36,  0.0000,E, grid,   ,           ,           ,N
  Point07,xy,   74, 3591,in, deg,  48,  0.0000,N,  30,  0.0000,E, grid,   ,           ,           ,N
  Point08,xy, 1835, 3629,in, deg,  48,  0.0000,N,  33,  0.0000,E, grid,   ,           ,           ,N
  Point09,xy, 3598, 3594,in, deg,  48,  0.0000,N,  36,  0.0000,E, grid,   ,           ,           ,N
(use only lines where values are filled in!). Meaning of the lines: pixel in the map image and its geographical coordinate.
-
Reorder these lines to get
  Point01,xy,  219,   86,in, deg,  52,  0.0000,N,  30,  0.0000,E, grid,   ,           ,           ,N
  Point02,xy, 1842,  121,in, deg,  52,  0.0000,N,  33,  0.0000,E, grid,   ,           ,           ,N
  Point03,xy, 3466,   90,in, deg,  52,  0.0000,N,  36,  0.0000,E, grid,   ,           ,           ,N
  Point06,xy, 3533, 1842,in, deg,  50,  0.0000,N,  36,  0.0000,E, grid,   ,           ,           ,N
  Point09,xy, 3598, 3594,in, deg,  48,  0.0000,N,  36,  0.0000,E, grid,   ,           ,           ,N
  Point08,xy, 1835, 3629,in, deg,  48,  0.0000,N,  33,  0.0000,E, grid,   ,           ,           ,N
  Point07,xy,   74, 3591,in, deg,  48,  0.0000,N,  30,  0.0000,E, grid,   ,           ,           ,N
  Point04,xy,  147, 1839,in, deg,  50,  0.0000,N,  30,  0.0000,E, grid,   ,           ,           ,N
  Point01,xy,  219,   86,in, deg,  52,  0.0000,N,  30,  0.0000,E, grid,   ,           ,           ,N
Add the first line of the block again at the end. Understand the shape generated by the geographical coordinates on a map (polygon!) to understand the order!
Point05would be in the middle of the map. This line is dropped. -
Convert this block with the editor to
id,WKT 1,"POLYGON((219 86, 1842 121, 3466 90, 3533 1842, 3598 3594, 1835 3629, 74 3591, 147 1839, 219 86))" -
Save these 2 lines to a new file with filename
001m--m36--(1989)_2.shp. -
Start QMT and open the cut map tool in QMT.
-
Load
001m--m36--(1989).gifinto the cut tool. -
Select the
Load cut mask from shape fileicon in the toolbar and load the file001m--m36--(1989)_2.shp. -
The map window shows now a cut mask with 8 cut points (4 points in the corners, 4 points in the middle of the 4 edges of the map).

This mask is more precise than the one obtained in the first approach. If necessary, improve the cut mask manually as described on this page.
-
Click
Startto create a new map file that is displayed without the boundary area.
-
The feature used in this example is available starting with QMS/QMT commit 7af68d8 - 2020-11-08 12:33:13 +0100, check entry labeled [QMS-260] in the QMS changelog to find out if it is available in a QMT release version.
Assume, you have 3 different referenced map images for the same area with different scales or content and you want to cut all 3 maps with the same cut mask. This can be done as follows:
-
Load all 3 maps into the cut tool.
-
Define the necessary cut mask for the first map as shown in the next image:
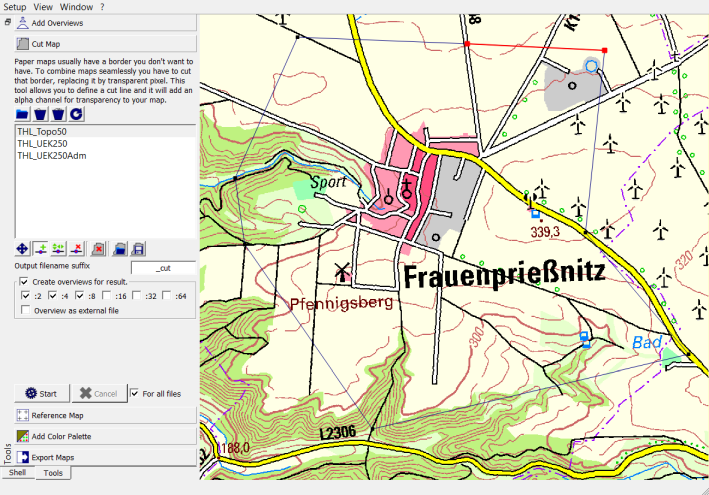
-
Save the cut mask into a
SHPshape file using theSave maskicon .
. -
Save the cut map using the
Startbutton. -
Choose the next map.
-
Load the previously saved cut mask using the
Load maskicon .
. -
Repeat steps 4 - 6 unless all maps are cut and saved.
The next image shows how the cut mask created for the first map is applied to the second map.
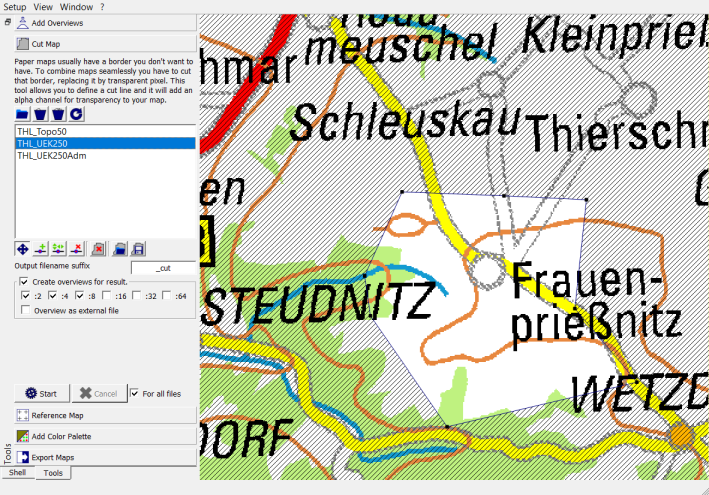
At the end of this cut process, all cut maps are referenced and show the same area.
Remarks:
-
Use the
gdalinfotool to check if the given image is referenced or not. As soon as the tool shows a coordinate system in its output, the image contains a referenced map. Hint: Check the output for lines of the formCoordinate System is: PROJCS["...",Otherwise, it is not referenced (here,
gdalinfooutput shows a line of the formCoordinate System is ''). -
To use the cut maps in QMS either create
VRTfiles for them or use the QMTExport mapstool which generates aJNXmap from a given map.JNXmaps can be loaded directly into QMS. The following image is an example of the use of theExport mapstool: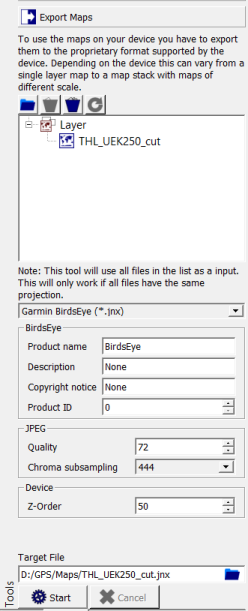
Prev (Overview tool) | Home | Manual | Index | Top | (Reference tool) Next