-
Notifications
You must be signed in to change notification settings - Fork 16
Measure_Border_And_Spots_Tool
The tool counts the number of spots (foci) per nucleus and measures the intensity, form, size and position of the spots. It also optionally measures the intensity in the membrane of the nucleus.

You can download some example images here: example_images.zip
To install the tool save the file measure_border_and_spots_tool.ijm into the folder macros/toolsets of your FIJI installation.
Select the "measure_border_and_spots_tool.ijm" toolset from the >> button of the ImageJ launcher.
- the first button opens the help page
- the
a-button runs the analysis on the current image - the
b-button runs a batch-analysis on the images in a folder
The tool expects separate files representing the different channels. The files must be in the same folder and have the same name except for the part of the name that represents the channel. For example:
Open the nuclei-channel file and press the a-button to run the analysis on the opened file. Modify the parameters (right-click on the a-button) if necessary. Right-click on the b-button to set the file-extension of your input files, then press the b-button to run the batch-analysis. Select the folder containing the input images. The result-measurements and control-images will be written into a sub-folder out of the input-folder.
A difference-of-Gaussian (DoG) filter is applied to the nuclei channel and an auto-threshold is applied. Holes in the resulting mask are filled with the Fill Holes command. Small objects are eliminated using the particle analyzer.
The nuclei borders are transformed into band-selections using the Enlarge and Make Band... commands.
The background is subtracted either using the Rolling ball-method or by subtracting a blurred version of the image. An auto-threshold is applied and small objects are eliminated. A seeded watershed can optionally be applied to separate touching spots.
The Exact Euclidean Distance Transform (3D) command is used on the nuclei-channel. The pixel value in the EDT-image at the center of the spot is the distance of the spot to the border of the nucleus.
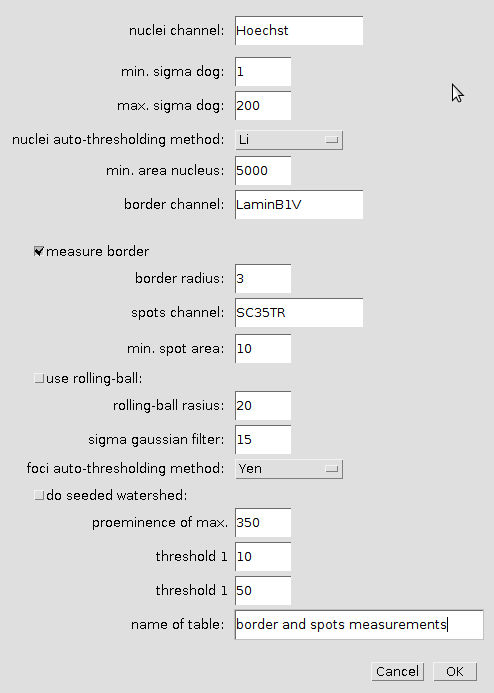
Right-click the a-button to open the options dialog:
- nuclei channel
- The name of the nuclei-channel (must be part of the filename)
- min. sigma dog
- The smaller sigma-value for the Difference-of-Gaussians-Filter
- max. sigma dog
- The bigger sigma-value for the Difference-of-Gaussians-Filter
- nuclei auto-thresholding method
- The auto-thresholding method used for the nuclei segmentation
- min. area nucleus
- Objects with a smaller area are eliminated
- border channel
- The name of the channel in which the nuclei-border intensities are measured
- measure border
- When selected the intensity in the nuclei borders are measured
- border radius
- The radius of the band that will be created around the nuclei contours
- spots channel
- The name of the channel in which the spots (foci) are measured
- min. spot area
- Objects with a smaller area are eliminated
- use rolling ball
- If selected rolling-ball background correction is used, otherwise a blurred version is subtracted from the image
- rolling-ball radius
- The radius of the rolling ball (radius of the smallest feature that shall remain in the image)
- sigma gaussian filter>
- The sigma of the Gaussian-filter for the image that will be subtracted from the input image
- foci auto-thresholding method
- The auto-thresholding method used for the segmentation of the spots (foci)
- do seeded watershed
- If selected a seeded watershed is applied to separate touching spots
- proeminence of max.
- Tolerance for the maxima that will be detected as seed points for the watershed
- threshold 1
- Lower area-threshold for the spot groups. Spots will be reported in three groups: below t1, between t1 and t2 and above t2.
- threshold 2
- Upper area-threshold for the spot groups. Spots will be reported in three groups: below t1, between t1 and t2 and above t2.
- name of table
- The name of the table in which the global results are reported


 Volker Bäcker