Add comparison plotting script#319
Merged
tomaarsen merged 3 commits intohuggingface:mainfrom Feb 24, 2023
Merged
Conversation
This file contains hidden or bidirectional Unicode text that may be interpreted or compiled differently than what appears below. To review, open the file in an editor that reveals hidden Unicode characters.
Learn more about bidirectional Unicode characters
Sign up for free
to join this conversation on GitHub.
Already have an account?
Sign in to comment
1 participant
Add this suggestion to a batch that can be applied as a single commit.This suggestion is invalid because no changes were made to the code.Suggestions cannot be applied while the pull request is closed.Suggestions cannot be applied while viewing a subset of changes.Only one suggestion per line can be applied in a batch.Add this suggestion to a batch that can be applied as a single commit.Applying suggestions on deleted lines is not supported.You must change the existing code in this line in order to create a valid suggestion.Outdated suggestions cannot be applied.This suggestion has been applied or marked resolved.Suggestions cannot be applied from pending reviews.Suggestions cannot be applied on multi-line comments.Suggestions cannot be applied while the pull request is queued to merge.Suggestion cannot be applied right now. Please check back later.
Hello!
Pull Request overview
Details
As promised in #268 (comment), this PR adds a potentially useful script for visualising the differences between various outputs of the
run_....py(e.g.run_fewshot.py)scripts provided in this repository. I wrote it to help visualise the potential performance differences resulting from #268, and I think it might help others, too.How to use
Firstly, one or more results must be generated, e.g. via
run_fewshot.py:Note that if the parameters between various runs are the same, but the repository code is different, then you must rename the
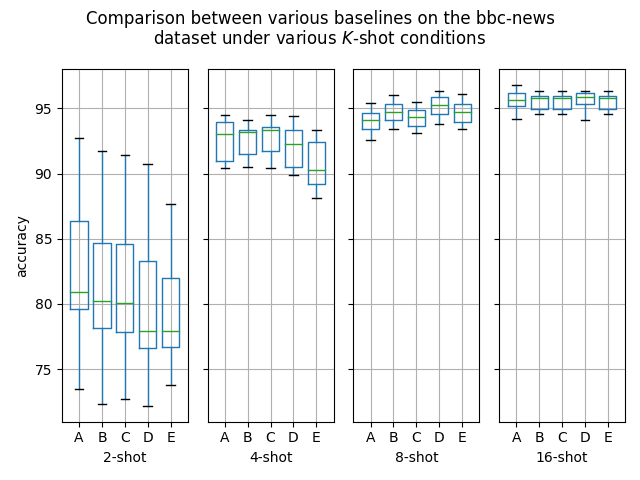
resultsdirectory after generating some results. Otherwise, it'll assume the old results are from the exact same setup, and it'll skip generating the new results.Afterwards, the plotting script can be used, pointing to the various model outputs that you want to compare, e.g.:
This produces outputs like can be seen in #268 (comment) and #268 (comment). One example that used five results paths is this plot: