runtime: latency in sweep assists when there's no garbage #18155
Comments
|
Very interesting. I knew this problem existed for large allocations, but hadn't really thought about it with small allocations. Assuming I understand what's going on, this isn't really a "sweep assist" problem, since it would happen even if the sweep ratio was 0. Sweep assists don't care if they found more space or not; you get credit for sweeping a span regardless of the outcome. The problem is that allocation ultimately has to find a span with some free space on it and currently it will keep sweeping until it does. I might have a simple fix: put a threshold on how many spans allocation is willing to sweep before it gives up and just allocates a fresh span from the heap. The heap overhead of this is bounded at 1/threshold. |
|
There are actually a few distinct causes of this.
With my proposed fix, we fall into this case any time we would otherwise have fallen into the previous case. For this particular application, the reclaim sweep has just as much trouble finding free space as the mcentral sweep. This may be less true in a more heterogeneous application.
|
|
CL https://golang.org/cl/34291 mentions this issue. |
|
@rhysh, care to give CL 34291 a shot? I don't think that's entirely the right approach, but it definitely makes things better. |
|
Hi @aclements , yes CL 34291 PS 1 makes things better. It's particularly apparent when the heap is large, and the stalls of over 500ms are reduced to less than 100ms. Here's the output I got from go1.8rc2 with CL 34291 PS 1 cherry-picked on linux/amd64: The longest stall, 89ms, started around (7.122s-0.089s = 7.033s), which is not immediately after the previous GC, which ended around (6.374s+0.149s = 6.523s). It's likely still during the concurrent sweep phase (which takes around 560ms, based on the go1.8rc2 run below), but it doesn't start at the beginning of the sweep phase. Compared with the output from vanilla go1.8rc2: I'm not aware of any production applications that this issue affects: observing the issue (if I understand it correctly) seems to require the unusual combination of 1) a growing heap, 2) very little garbage to reclaim, and 3) caring about latency in individual goroutines. |
|
I'm trying to understand this problem, and there's a few things that are confusing me. In my original benchmark, when I visualise a run of the program with
i.e. all processors are running a combination of When I visualise the benchmark listed at the top of this issue, the pauses look like this:
This also has all processors running A couple of things about this confuses me:
Happy to take this offline if someone would be willing to explain this to me. |


|
Change https://golang.org/cl/60790 mentions this issue: |
|
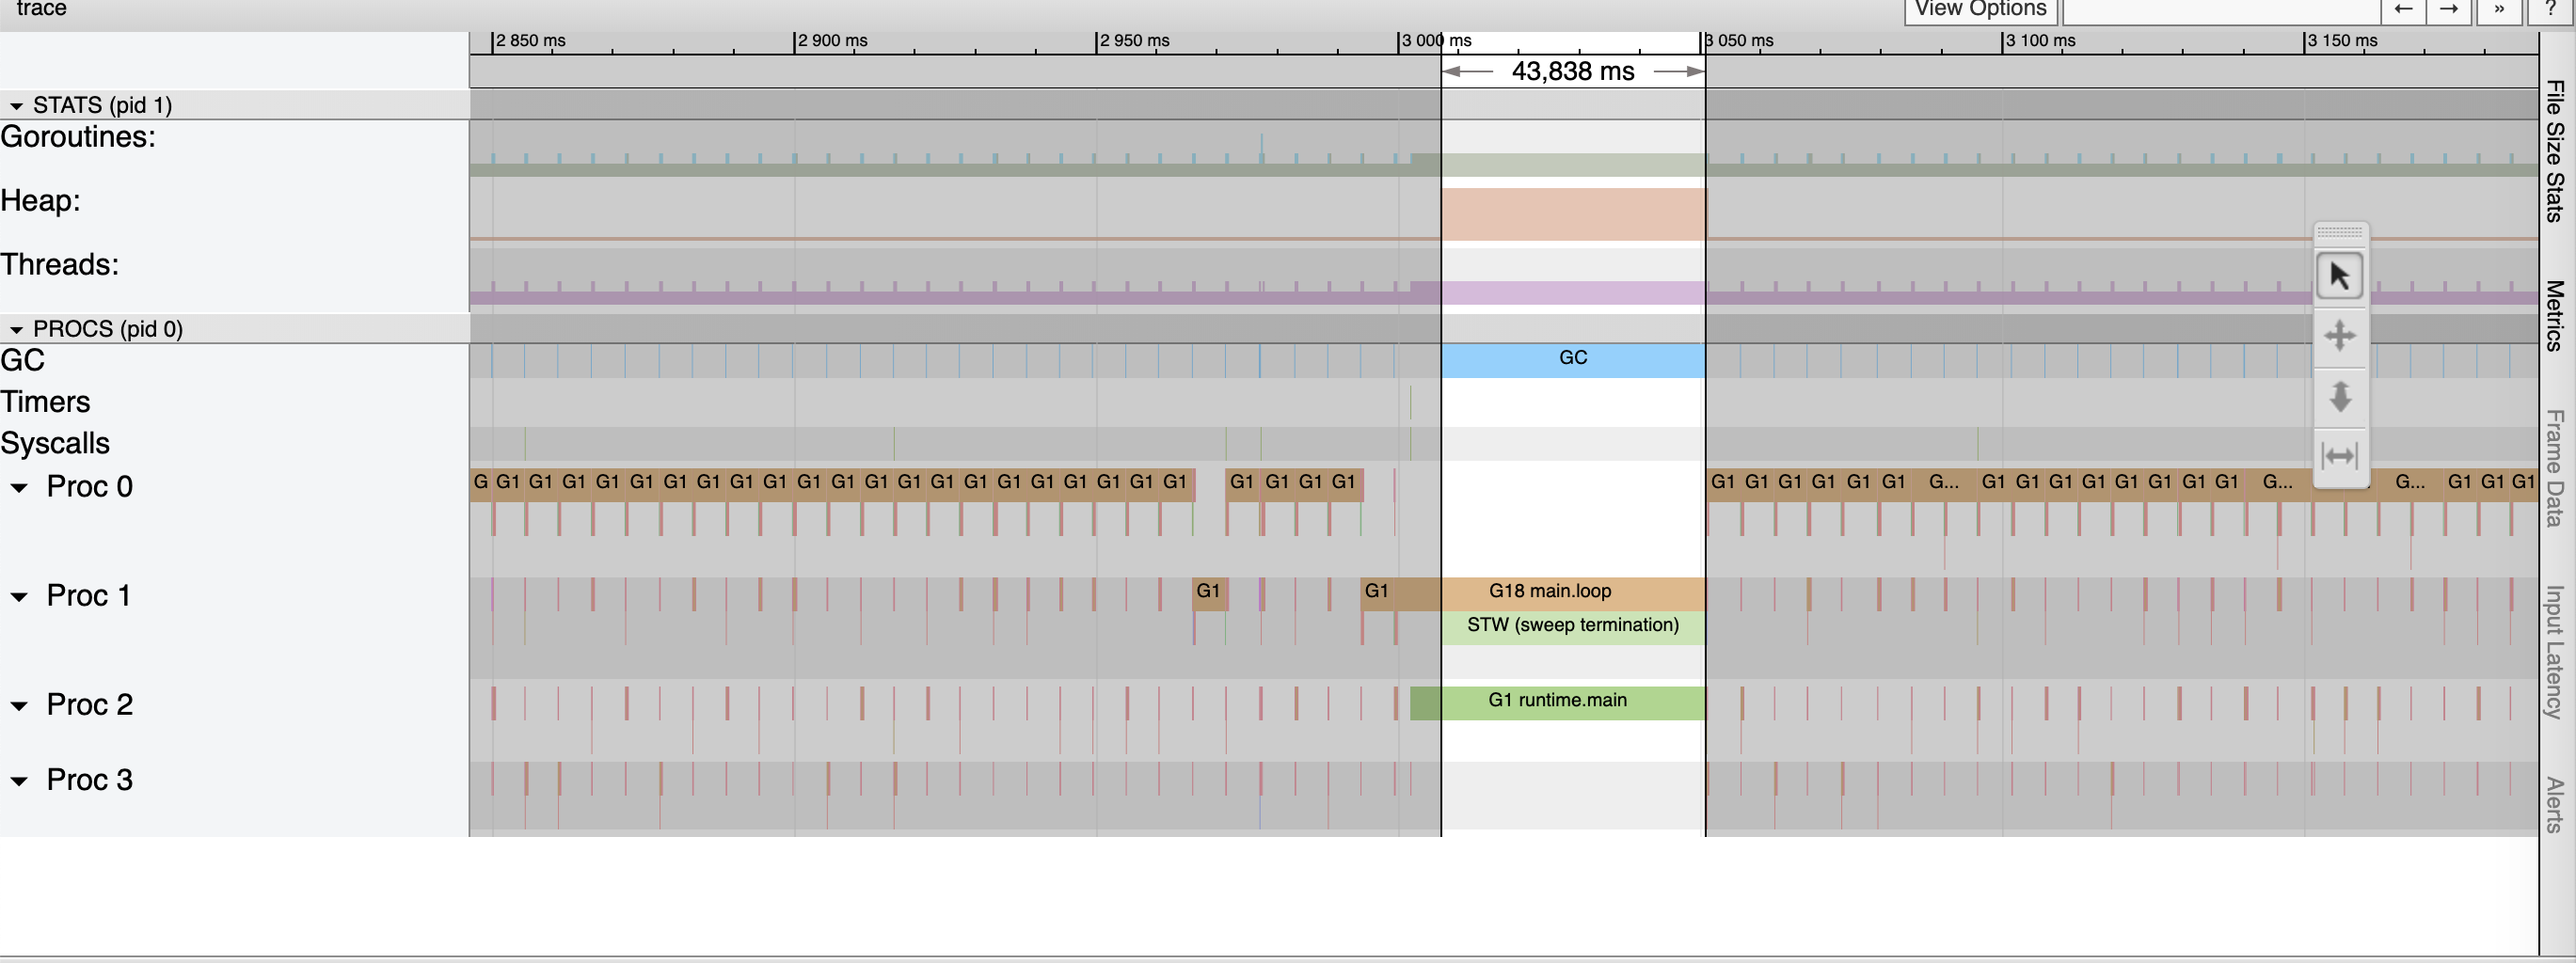
I have what I think is an acute case of this problem. (If that's not the case -- apologies; please ignore.) Over on #23044 I described my current workaround for the "small heap problem" -- where a program generates a lot of garbage but keeps a very small amount of live data, leading to extremely frequent GCs. As I mentioned in #23044 I'm currently using heap ballast as a horrible workaround to force the garbage collector to set a much higher size target. The latest system where I added ballast is described in #23044 (comment):
So my program does a bunch of small allocations that become garbage right away (its work) and a few giant allocations every once in a while which tend to stay live for a long time (ballast). It seems like sometimes, after more ballast is added, my program runs into the situation that @rhysh described at the top, and all the mutators can spend all their time in sweep assists. See this unpleasant trace:
In this case no goroutine did productive work for about 600ms. This particular case isn't a big deal for us -- I can mitigate this in a few different ways -- but I thought it might be interesting as an extreme example. |

|
That certainly is an unfortunate trace. Quick question: could you sample a
few of those sweeps and report the metadata associated with them? I'm
particularly interested in their duration, how many pages were swept, and
how many bytes were recovered.
Also, is there anything between the obvious, long sweeps that are visible
in the screenshot? (E.g., if you select one and hit the right arrow key, is
the next event just the next big sweep or something else?)
|
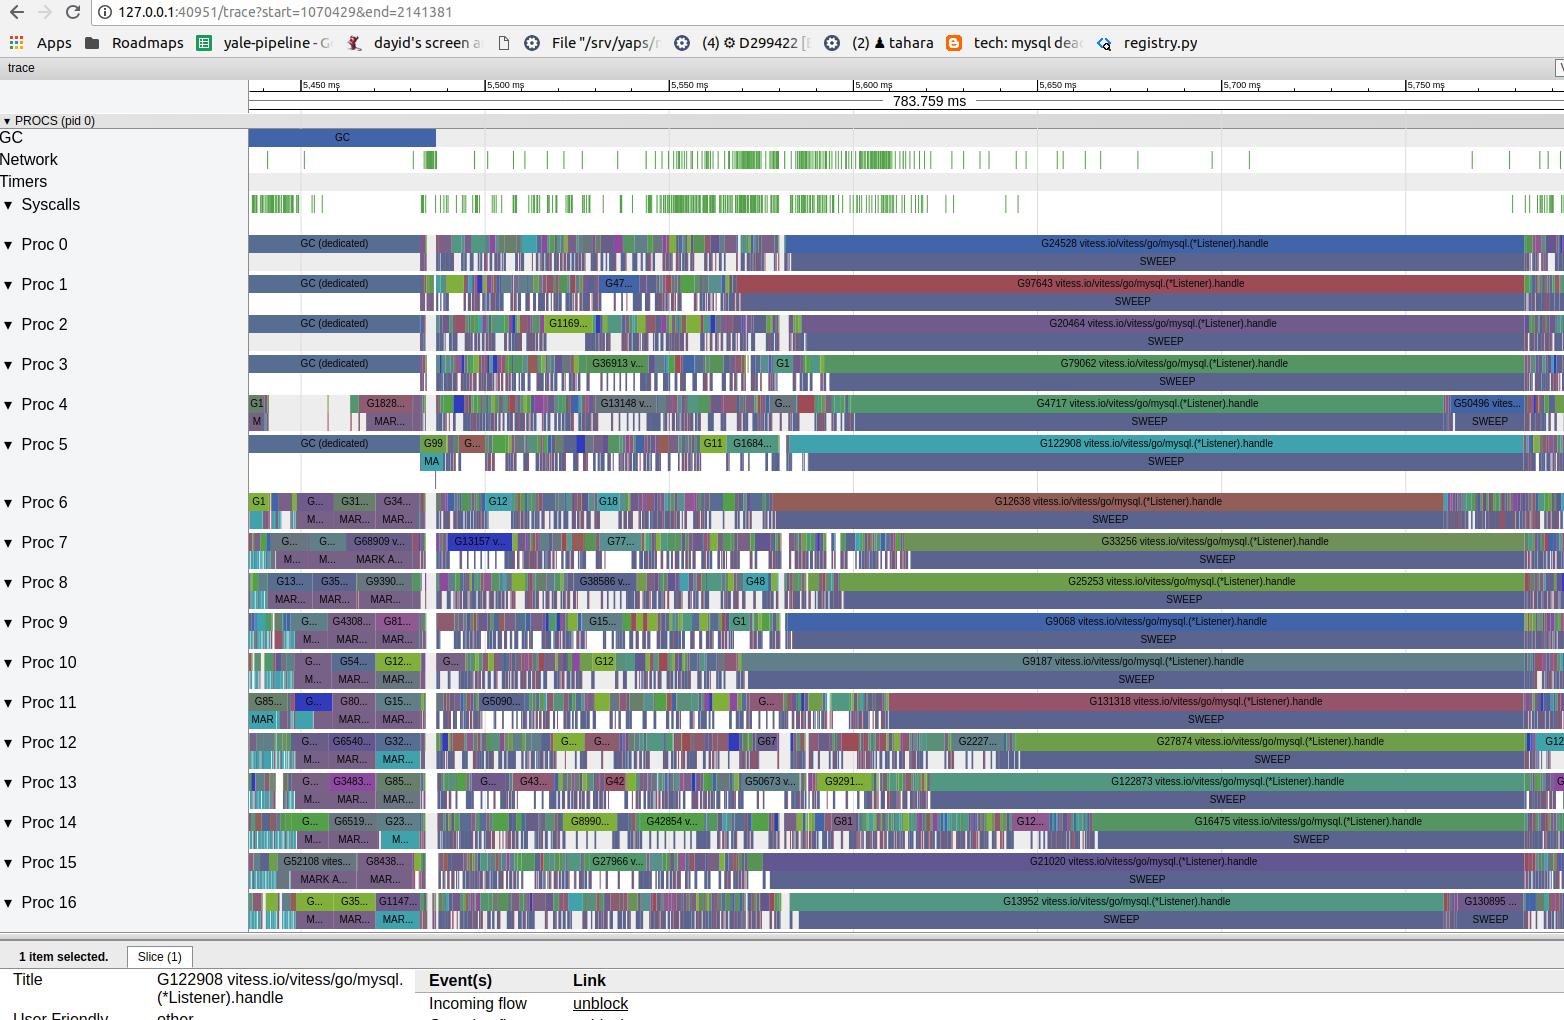
Here are 6 sequential sweeps for one of the procs:
Yeah -- as shown above, between the big sweeps there are often interspersed some small sweeps. (But not always -- sometimes there are two big sweeps next to each other.) I also mailed you the trace (this is private code). |
|
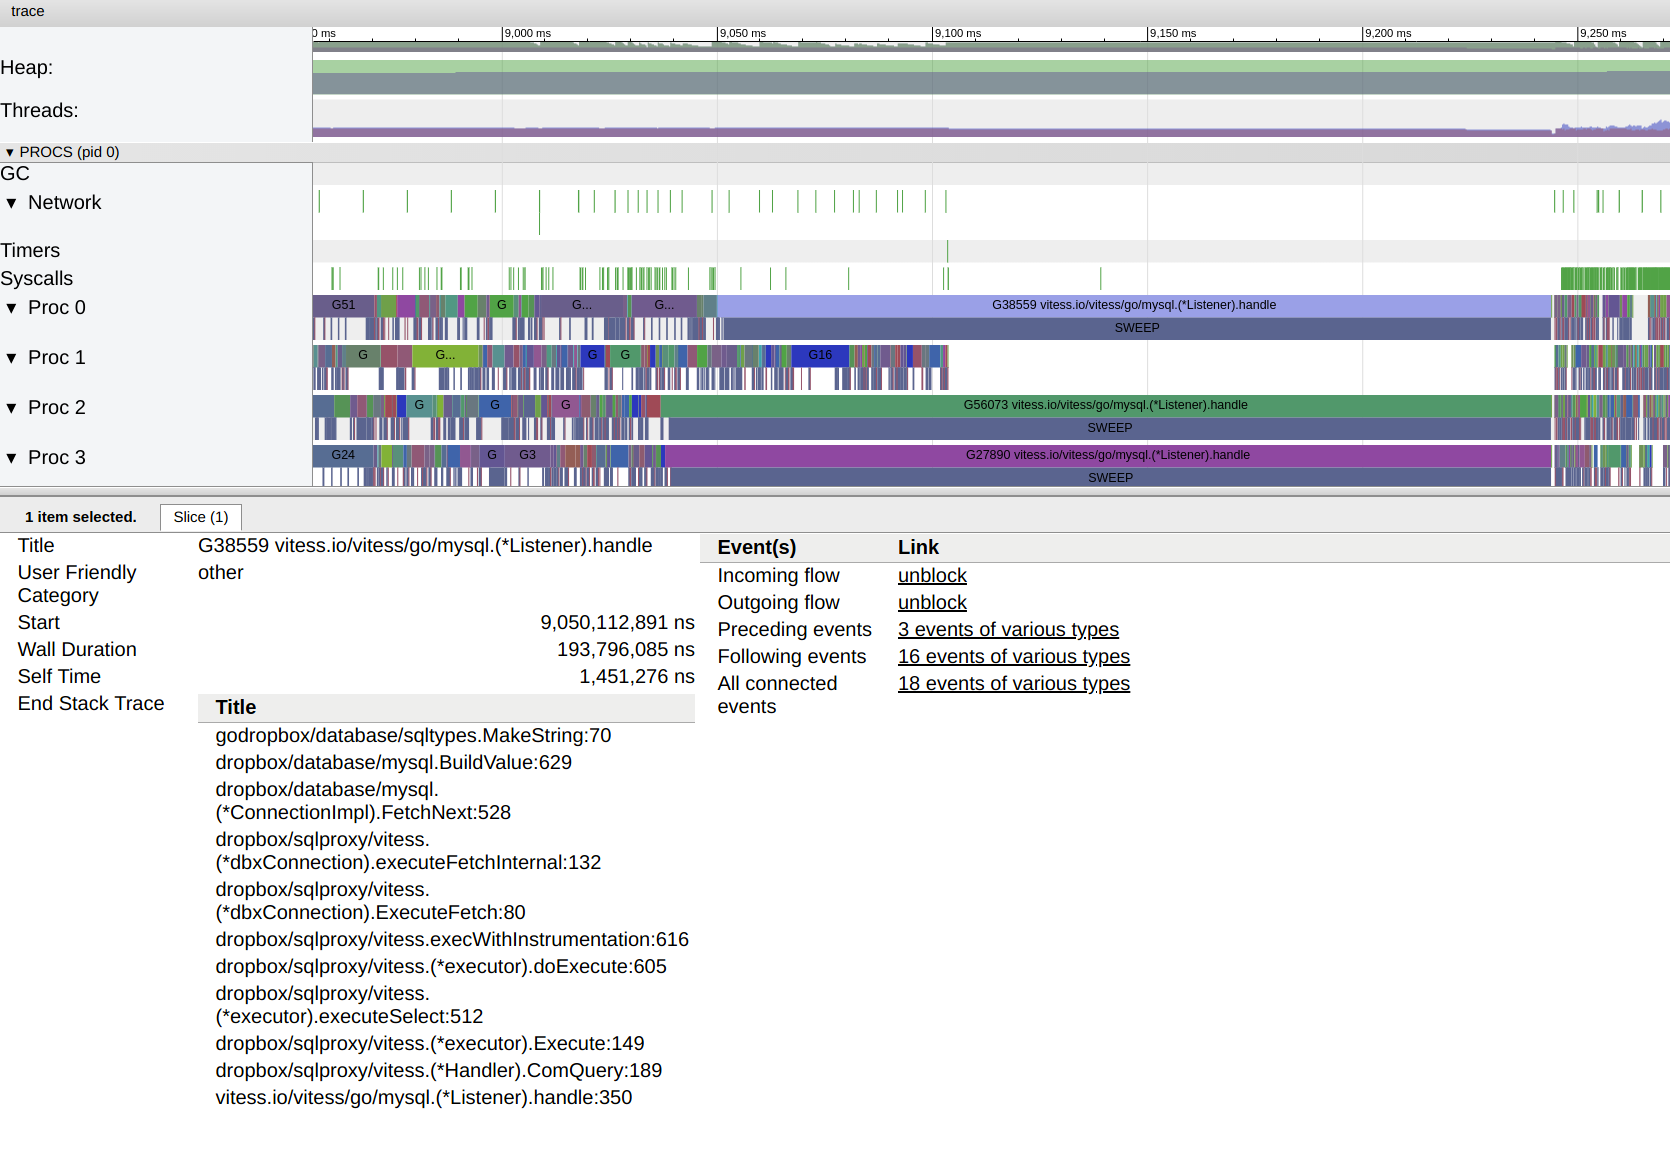
We're writing a MySQL wire-protocol compatible proxy at Dropbox, and it looks like we're hitting this same issue in production on go 1.10.3. Some "oddities" about the service -- being effectively a MySQL server, there is no connection multiplexing and there is a ton of per-connection buffers and state (see vitessio/vitess#4138). We're working on reducing them, but something like 90% of the in use heap memory at any given time is tied up is unreclaimable, effectively constant memory, and 50+% of the # of in use objects are from the same. Our traces look like this:
Zooming in, the concurrent SWEEP happens on the first call to MakeString(...) (copying cgo memory into a go string). The gap between GC finishing and the SWEEPs is due to the fact that most of the goroutines (one per connection) don't have any data waiting on their sockets, so they don't require any allocations:
GC happens every few seconds (GOGC=75, since we don't have much memory to spare), and concurrent mark and scan is itself expensive (and born mostly by mutators), but it still pales in comparison to the concurrent sweep stalls, which seem to tie up every core for about 100-200ms. |

|
Can you provide the approximate size of the allocation that is causing the
long sweep? Go uses a different allocation scheme if the object is >
32KBytes (or < 8 bytes).
…On Mon, Aug 27, 2018 at 2:50 PM, Daniel Tahara ***@***.***> wrote:
We're writing a MySQL wire-protocol compatible proxy at Dropbox, and it
looks like we're hitting this same issue in production on go 1.10.3.
Some "oddities" about the service -- being effectively a MySQL server,
there is no connection multiplexing and there is a ton of per-connection
buffers and state (see vitessio/vitess#4138
<vitessio/vitess#4138>). We're working on
reducing them, but something like 70% of the in use heap memory at any
given time is tied up in unreclaimable, effectively constant memory, and
50+% of the # of in use objects are from the same.
Our traces look like this:
[image: image 4]
<https://user-images.githubusercontent.com/1313465/44678919-6c5aca00-a9ee-11e8-9970-795ef36b9487.png>
Zooming in, the concurrent SWEEP happens on the first call to
MakeString(...) (copying cgo memory into a go string). The gap between GC
finishing and the SWEEPs is due to the fact that most of the goroutines
(one per connection) don't have any data waiting on their sockets, so they
don't require any allocations:
[image: image]
<https://user-images.githubusercontent.com/1313465/44679159-0589e080-a9ef-11e8-8382-ab8aa04667f9.png>
GC happens every few seconds (GOGC=75, since we don't have much memory to
spare), and concurrent mark and scan is itself expensive, but it still
pales in comparison to the concurrent sweep stalls, which seem to tie up
every core for about 100-200ms.
gc 62645 @227962.290s 4%: 0.28+223+0.23 ms clock, 5.6+2319/1090/7.2+4.6 ms cpu, 6995->7052->4089 MB, 7146 MB goal, 20 P
gc 62646 @227965.313s 4%: 0.30+243+0.26 ms clock, 6.1+2406/1188/0.97+5.2 ms cpu, 7004->7061->4083 MB, 7156 MB goal, 20 P
gc 62647 @227968.497s 4%: 0.14+239+0.25 ms clock, 2.8+2290/1170/0.024+5.1 ms cpu, 6993->7051->4083 MB, 7145 MB goal, 20 P
gc 62648 @227971.571s 4%: 0.26+251+0.26 ms clock, 5.3+2557/1233/0.29+5.2 ms cpu, 6994->7050->4085 MB, 7146 MB goal, 20 P
gc 62649 @227974.337s 4%: 0.16+242+0.24 ms clock, 3.2+2376/1175/1.8+4.8 ms cpu, 6997->7056->4086 MB, 7148 MB goal, 20 P
gc 62650 @227977.309s 4%: 0.35+291+0.31 ms clock, 7.1+2466/1422/1.3+6.3 ms cpu, 6999->7055->4084 MB, 7151 MB goal, 20 P
—
You are receiving this because you were mentioned.
Reply to this email directly, view it on GitHub
<#18155 (comment)>, or mute
the thread
<https://github.com/notifications/unsubscribe-auth/AA7Wnwn6uROCKSeeAz7r4RPtYzVQ23l6ks5uVD9ygaJpZM4LCNrC>
.
|
|
The objects are in the range of a few hundred bytes to single digit KB. The best specific data I can get is for row size (as opposed to column size). That distribution (in bytes) is here:
|
|
If I read this correctly p99 object size if > 84K bytes and if I assume a
normal distribution and interpolate p95 or so is > 32 KBytes.
…On Wed, Aug 29, 2018 at 2:27 PM, Daniel Tahara ***@***.***> wrote:
The objects are in the range of a few hundred bytes to single digit KB.
The best specific data I can get is for row size (as opposed to column
size). That distribution (in bytes) is here:
p99 p90 p75 p50
84511.8414031 6485.345 1126.004 379.099280115
—
You are receiving this because you were mentioned.
Reply to this email directly, view it on GitHub
<#18155 (comment)>, or mute
the thread
<https://github.com/notifications/unsubscribe-auth/AA7Wn75RwwYiuMcDLFQlFk3XI3o-NZMVks5uVtz0gaJpZM4LCNrC>
.
|
|
Queries in last hour, in bytes:
To reiterate -- these are stats for row size, not column/value size. |
|
I'm not sure what you are saying, I am looking for the size of the
allocation. Is an entire row allocated with a single allocation?
…On Wed, Aug 29, 2018 at 5:39 PM, Daniel Tahara ***@***.***> wrote:
Queries in last hour, in bytes:
p99 p95 p90 p75 p50 p25 p10
72700.6023324 10662.0823733 6609.87482699 1130.83317386 379.689311459
101.527534113 46.6143729713
—
You are receiving this because you were mentioned.
Reply to this email directly, view it on GitHub
<#18155 (comment)>, or mute
the thread
<https://github.com/notifications/unsubscribe-auth/AA7Wn671oG5bhpNTRp5aIOk3sX3JfpDXks5uVwoJgaJpZM4LCNrC>
.
|
|
The column values are allocated one by one. Unfortunately, I don't have
stats at the column level, so I am providing the row size as an upper bound.
|
|
@RLH Actually, we took another look and looks like MakeString doesn't allocate that much: |
This adds a bitmap indexed by page number that marks the starts of
in-use spans. This will be used to quickly find in-use spans with no
marked objects for sweeping.

For #18155.

Change-Id: Icee56f029cde502447193e136fa54a74c74326dd
Reviewed-on: https://go-review.googlesource.com/c/138957
Run-TryBot: Austin Clements <[email protected]>
TryBot-Result: Gobot Gobot <[email protected]>
Reviewed-by: Rick Hudson <[email protected]>
Reviewed-by: Michael Knyszek <[email protected]>
This adds a mark bit for each span that is set if any objects on the
span are marked. This will be used for sweeping.

For #18155.

The impact of this is negligible for most benchmarks, and < 1% for
GC-heavy benchmarks.

name                       old time/op  new time/op  delta
Garbage/benchmem-MB=64-12  2.18ms ± 0%  2.20ms ± 1%  +0.88%  (p=0.000 n=16+18)

(https://perf.golang.org/search?q=upload:20180928.1)

name                      old time/op    new time/op    delta
BinaryTree17-12              2.68s ± 1%     2.68s ± 1%    ~     (p=0.707 n=17+19)
Fannkuch11-12                2.28s ± 0%     2.39s ± 0%  +4.95%  (p=0.000 n=19+18)
FmtFprintfEmpty-12          40.3ns ± 4%    39.4ns ± 2%  -2.27%  (p=0.000 n=17+18)
FmtFprintfString-12         67.9ns ± 1%    68.3ns ± 1%  +0.55%  (p=0.000 n=18+19)
FmtFprintfInt-12            75.7ns ± 1%    76.1ns ± 1%  +0.44%  (p=0.005 n=18+19)
FmtFprintfIntInt-12          123ns ± 1%     121ns ± 1%  -1.00%  (p=0.000 n=18+18)
FmtFprintfPrefixedInt-12     150ns ± 0%     148ns ± 0%  -1.33%  (p=0.000 n=16+13)
FmtFprintfFloat-12           208ns ± 0%     204ns ± 0%  -1.92%  (p=0.000 n=13+17)
FmtManyArgs-12               501ns ± 1%     498ns ± 0%  -0.55%  (p=0.000 n=19+17)
GobDecode-12                6.24ms ± 0%    6.25ms ± 1%    ~     (p=0.113 n=20+19)
GobEncode-12                5.33ms ± 0%    5.29ms ± 1%  -0.72%  (p=0.000 n=20+18)
Gzip-12                      220ms ± 1%     218ms ± 1%  -1.02%  (p=0.000 n=19+19)
Gunzip-12                   35.5ms ± 0%    35.7ms ± 0%  +0.45%  (p=0.000 n=16+18)
HTTPClientServer-12         77.9µs ± 1%    77.7µs ± 1%  -0.30%  (p=0.047 n=20+19)
JSONEncode-12               8.82ms ± 0%    8.93ms ± 0%  +1.20%  (p=0.000 n=18+17)
JSONDecode-12               47.3ms ± 0%    47.0ms ± 0%  -0.49%  (p=0.000 n=17+18)
Mandelbrot200-12            3.69ms ± 0%    3.68ms ± 0%  -0.25%  (p=0.000 n=19+18)
GoParse-12                  3.13ms ± 1%    3.13ms ± 1%    ~     (p=0.640 n=20+20)
RegexpMatchEasy0_32-12      76.2ns ± 1%    76.2ns ± 1%    ~     (p=0.818 n=20+19)
RegexpMatchEasy0_1K-12       226ns ± 0%     226ns ± 0%  -0.22%  (p=0.001 n=17+18)
RegexpMatchEasy1_32-12      71.9ns ± 1%    72.0ns ± 1%    ~     (p=0.653 n=18+18)
RegexpMatchEasy1_1K-12       355ns ± 1%     356ns ± 1%    ~     (p=0.160 n=18+19)
RegexpMatchMedium_32-12      106ns ± 1%     106ns ± 1%    ~     (p=0.325 n=17+20)
RegexpMatchMedium_1K-12     31.1µs ± 2%    31.2µs ± 0%  +0.59%  (p=0.007 n=19+15)
RegexpMatchHard_32-12       1.54µs ± 2%    1.53µs ± 2%  -0.78%  (p=0.021 n=17+18)
RegexpMatchHard_1K-12       46.0µs ± 1%    45.9µs ± 1%  -0.31%  (p=0.025 n=17+19)
Revcomp-12                   391ms ± 1%     394ms ± 2%  +0.80%  (p=0.000 n=17+19)
Template-12                 59.9ms ± 1%    59.9ms ± 1%    ~     (p=0.428 n=20+19)
TimeParse-12                 304ns ± 1%     312ns ± 0%  +2.88%  (p=0.000 n=20+17)
TimeFormat-12                318ns ± 0%     326ns ± 0%  +2.64%  (p=0.000 n=20+17)

(https://perf.golang.org/search?q=upload:20180928.2)

Change-Id: I336b9bf054113580a24103192904c8c76593e90e
Reviewed-on: https://go-review.googlesource.com/c/138958
Run-TryBot: Austin Clements <[email protected]>
TryBot-Result: Gobot Gobot <[email protected]>
Reviewed-by: Rick Hudson <[email protected]>
Reviewed-by: Michael Knyszek <[email protected]>
When we attempt to allocate an N page span (either for a large
allocation or when an mcentral runs dry), we first try to sweep spans
to release N pages. Currently, this can be extremely expensive:
sweeping a span to emptiness is the hardest thing to ask for and the
sweeper generally doesn't know where to even look for potentially
fruitful results. Since this is on the critical path of many
allocations, this is unfortunate.

This CL changes how we reclaim empty spans. Instead of trying lots of
spans and hoping for the best, it uses the newly introduced span marks
to efficiently find empty spans. The span marks (and in-use bits) are
in a dense bitmap, so these spans can be found with an efficient
sequential memory scan. This approach can scan for unmarked spans at
about 300 GB/ms and can free unmarked spans at about 32 MB/ms. We
could probably significantly improve the rate at which is can free
unmarked spans, but that's a separate issue.

Like the current reclaimer, this is still linear in the number of
spans that are swept, but the constant factor is now so vanishingly
small that it doesn't matter.

The benchmark in #18155 demonstrates both significant page reclaiming
delays, and object reclaiming delays. With "-retain-count=20000000
-preallocate=true -loop-count=3", the benchmark demonstrates several
page reclaiming delays on the order of 40ms. After this change, the
page reclaims are insignificant. The longest sweeps are still ~150ms,
but are object reclaiming delays. We'll address those in the next
several CLs.

Updates #18155.

Fixes #21378 by completely replacing the logic that had that bug.

Change-Id: Iad80eec11d7fc262d02c8f0761ac6998425c4064
Reviewed-on: https://go-review.googlesource.com/c/138959
Run-TryBot: Austin Clements <[email protected]>
TryBot-Result: Gobot Gobot <[email protected]>
Reviewed-by: Rick Hudson <[email protected]>
Currently, there's no efficient way to iterate over the Go heap. We're
going to need this for fast free page sweeping, so this CL adds a
slice of all allocated heap arenas. This will also be useful for
generational GC.

For #18155.

Change-Id: I58d126cfb9c3f61b3125d80b74ccb1b2169efbcc
Reviewed-on: https://go-review.googlesource.com/c/138076
Run-TryBot: Austin Clements <[email protected]>
TryBot-Result: Gobot Gobot <[email protected]>
Reviewed-by: Rick Hudson <[email protected]>
This adds a bitmap indexed by page number that marks the starts of
in-use spans. This will be used to quickly find in-use spans with no
marked objects for sweeping.

For #18155.

Change-Id: Icee56f029cde502447193e136fa54a74c74326dd
Reviewed-on: https://go-review.googlesource.com/c/138957
Run-TryBot: Austin Clements <[email protected]>
TryBot-Result: Gobot Gobot <[email protected]>
Reviewed-by: Rick Hudson <[email protected]>
Reviewed-by: Michael Knyszek <[email protected]>
This adds a mark bit for each span that is set if any objects on the
span are marked. This will be used for sweeping.

For #18155.

The impact of this is negligible for most benchmarks, and < 1% for
GC-heavy benchmarks.

name                       old time/op  new time/op  delta
Garbage/benchmem-MB=64-12  2.18ms ± 0%  2.20ms ± 1%  +0.88%  (p=0.000 n=16+18)

(https://perf.golang.org/search?q=upload:20180928.1)

name                      old time/op    new time/op    delta
BinaryTree17-12              2.68s ± 1%     2.68s ± 1%    ~     (p=0.707 n=17+19)
Fannkuch11-12                2.28s ± 0%     2.39s ± 0%  +4.95%  (p=0.000 n=19+18)
FmtFprintfEmpty-12          40.3ns ± 4%    39.4ns ± 2%  -2.27%  (p=0.000 n=17+18)
FmtFprintfString-12         67.9ns ± 1%    68.3ns ± 1%  +0.55%  (p=0.000 n=18+19)
FmtFprintfInt-12            75.7ns ± 1%    76.1ns ± 1%  +0.44%  (p=0.005 n=18+19)
FmtFprintfIntInt-12          123ns ± 1%     121ns ± 1%  -1.00%  (p=0.000 n=18+18)
FmtFprintfPrefixedInt-12     150ns ± 0%     148ns ± 0%  -1.33%  (p=0.000 n=16+13)
FmtFprintfFloat-12           208ns ± 0%     204ns ± 0%  -1.92%  (p=0.000 n=13+17)
FmtManyArgs-12               501ns ± 1%     498ns ± 0%  -0.55%  (p=0.000 n=19+17)
GobDecode-12                6.24ms ± 0%    6.25ms ± 1%    ~     (p=0.113 n=20+19)
GobEncode-12                5.33ms ± 0%    5.29ms ± 1%  -0.72%  (p=0.000 n=20+18)
Gzip-12                      220ms ± 1%     218ms ± 1%  -1.02%  (p=0.000 n=19+19)
Gunzip-12                   35.5ms ± 0%    35.7ms ± 0%  +0.45%  (p=0.000 n=16+18)
HTTPClientServer-12         77.9µs ± 1%    77.7µs ± 1%  -0.30%  (p=0.047 n=20+19)
JSONEncode-12               8.82ms ± 0%    8.93ms ± 0%  +1.20%  (p=0.000 n=18+17)
JSONDecode-12               47.3ms ± 0%    47.0ms ± 0%  -0.49%  (p=0.000 n=17+18)
Mandelbrot200-12            3.69ms ± 0%    3.68ms ± 0%  -0.25%  (p=0.000 n=19+18)
GoParse-12                  3.13ms ± 1%    3.13ms ± 1%    ~     (p=0.640 n=20+20)
RegexpMatchEasy0_32-12      76.2ns ± 1%    76.2ns ± 1%    ~     (p=0.818 n=20+19)
RegexpMatchEasy0_1K-12       226ns ± 0%     226ns ± 0%  -0.22%  (p=0.001 n=17+18)
RegexpMatchEasy1_32-12      71.9ns ± 1%    72.0ns ± 1%    ~     (p=0.653 n=18+18)
RegexpMatchEasy1_1K-12       355ns ± 1%     356ns ± 1%    ~     (p=0.160 n=18+19)
RegexpMatchMedium_32-12      106ns ± 1%     106ns ± 1%    ~     (p=0.325 n=17+20)
RegexpMatchMedium_1K-12     31.1µs ± 2%    31.2µs ± 0%  +0.59%  (p=0.007 n=19+15)
RegexpMatchHard_32-12       1.54µs ± 2%    1.53µs ± 2%  -0.78%  (p=0.021 n=17+18)
RegexpMatchHard_1K-12       46.0µs ± 1%    45.9µs ± 1%  -0.31%  (p=0.025 n=17+19)
Revcomp-12                   391ms ± 1%     394ms ± 2%  +0.80%  (p=0.000 n=17+19)
Template-12                 59.9ms ± 1%    59.9ms ± 1%    ~     (p=0.428 n=20+19)
TimeParse-12                 304ns ± 1%     312ns ± 0%  +2.88%  (p=0.000 n=20+17)
TimeFormat-12                318ns ± 0%     326ns ± 0%  +2.64%  (p=0.000 n=20+17)

(https://perf.golang.org/search?q=upload:20180928.2)

Change-Id: I336b9bf054113580a24103192904c8c76593e90e
Reviewed-on: https://go-review.googlesource.com/c/138958
Run-TryBot: Austin Clements <[email protected]>
TryBot-Result: Gobot Gobot <[email protected]>
Reviewed-by: Rick Hudson <[email protected]>
Reviewed-by: Michael Knyszek <[email protected]>
When we attempt to allocate an N page span (either for a large
allocation or when an mcentral runs dry), we first try to sweep spans
to release N pages. Currently, this can be extremely expensive:
sweeping a span to emptiness is the hardest thing to ask for and the
sweeper generally doesn't know where to even look for potentially
fruitful results. Since this is on the critical path of many
allocations, this is unfortunate.

This CL changes how we reclaim empty spans. Instead of trying lots of
spans and hoping for the best, it uses the newly introduced span marks
to efficiently find empty spans. The span marks (and in-use bits) are
in a dense bitmap, so these spans can be found with an efficient
sequential memory scan. This approach can scan for unmarked spans at
about 300 GB/ms and can free unmarked spans at about 32 MB/ms. We
could probably significantly improve the rate at which is can free
unmarked spans, but that's a separate issue.

Like the current reclaimer, this is still linear in the number of
spans that are swept, but the constant factor is now so vanishingly
small that it doesn't matter.

The benchmark in #18155 demonstrates both significant page reclaiming
delays, and object reclaiming delays. With "-retain-count=20000000
-preallocate=true -loop-count=3", the benchmark demonstrates several
page reclaiming delays on the order of 40ms. After this change, the
page reclaims are insignificant. The longest sweeps are still ~150ms,
but are object reclaiming delays. We'll address those in the next
several CLs.

Updates #18155.

Fixes #21378 by completely replacing the logic that had that bug.

Change-Id: Iad80eec11d7fc262d02c8f0761ac6998425c4064
Reviewed-on: https://go-review.googlesource.com/c/138959
Run-TryBot: Austin Clements <[email protected]>
TryBot-Result: Gobot Gobot <[email protected]>
Reviewed-by: Rick Hudson <[email protected]>
|
Go 1.12 fixed a major source of this latency. While there are still allocation patterns that can in theory lead to long sweep latency, we haven't seen these in our internal tests. Does anybody on this issue still see long sweep latency with Go 1.12? If not, I'll go ahead and call this resolved. |
|
@aclements Some pauses still happen when one goroutine allocates a huge block of memory. Is this relevant to the latest changes? We have a cache inside an application. The cache consists of structs: It's ok, but have a lot of pointers(3M). To reduce them we made the slice of slices single-dimensioned because geo is statically defined with 255 items: And when the application allocates all the slice (3M*255) in the background *the latency inside all response handlers increases * Nothing changed between 1.11 and 1.12 |
|
Got an example:
So in production we have a bigger pauses |
|
Our upgrade cycle takes a few months. So feel free to close if no one else surfaces problems, and we can revisit this thread if our 1.12 upgrade reveals anything further. |
|
@un000, thanks for the reproducer. That's actually a different issue, since it's not sweep assists causing the delay but rather sweep termination. Could you open a new issue? I started digging into it and found that it's taking a long time to actually stop the world (rather than anything that's happening during sweep termination), but it wasn't obvious what was delaying it by so much. |
|
@aclements got it #31222 |
|
When I run the original benchmark originally mentioned by @rhysh, I consistently get pause times of ~15ms with go 1.12. |
|
Change https://golang.org/cl/187817 mentions this issue: |
|
Change https://golang.org/cl/229998 mentions this issue: |
Currently, the small object sweeper will sweep until it finds a free
slot or there are no more spans of that size class to sweep. In dense
heaps, this can cause sweeping for a given size class to take
unbounded time, and gets worse with larger heaps.

This CL limits the small object sweeper to try at most 100 spans
before giving up and allocating a fresh span. Since it's already shown
that 100 spans are completely full at that point, the space overhead
of this fresh span is at most 1%.

This CL is based on an experimental CL by Austin Clements (CL 187817)
and is updated to be part of the mcentral implementation, gated by
go115NewMCentralImpl.

Updates #18155.

Change-Id: I37a72c2dcc61dd6f802d1d0eac3683e6642b6ef8
Reviewed-on: https://go-review.googlesource.com/c/go/+/229998
Run-TryBot: Michael Knyszek <[email protected]>
Reviewed-by: Austin Clements <[email protected]>
Currently, the small object sweeper will sweep until it finds a free
slot or there are no more spans of that size class to sweep. In dense
heaps, this can cause sweeping for a given size class to take
unbounded time, and gets worse with larger heaps.

This CL limits the small object sweeper to try at most 100 spans
before giving up and allocating a fresh span. Since it's already shown
that 100 spans are completely full at that point, the space overhead
of this fresh span is at most 1%.

This CL is based on an experimental CL by Austin Clements (CL 187817)
and is updated to be part of the mcentral implementation, gated by
go115NewMCentralImpl.

Updates golang#18155.

Change-Id: I37a72c2dcc61dd6f802d1d0eac3683e6642b6ef8
Reviewed-on: https://go-review.googlesource.com/c/go/+/229998
Run-TryBot: Michael Knyszek <[email protected]>
Reviewed-by: Austin Clements <[email protected]>
go version devel +ae9712c766 Thu Dec 1 22:20:31 2016 +0000 darwin/amd64, and linux/amd64I wrote a test case for the GC latency described by @WillSewell in https://blog.pusher.com/golangs-real-time-gc-in-theory-and-practice/ . I recorded the timestamps of when pauses (during allocation) were observed, and matched them against GODEBUG=gctrace=1 output.
The pauses come after the GC cycle, during the concurrent sweep phase. Also, they happen as the heap grows and do not happen once the heap size is stable. And the pauses are often longer than the clock time of any single gctrace line.
A goroutine that needs to allocate memory right after a GC cycle is required to help with the sweep work. This means looking through the heap until suitable memory is found. If the heap is growing rapidly with little or no garbage created, this mutator goroutine will need to search for a long time: it can end up sweeping half of the heap (shared with the background sweep worker).
The GC is pretty good at controlling the mark assist burden on any single goroutine—and starting the GC cycle before the allowable heap growth is exhausted, allowing tradeoffs between assist burden and heap growth during the cycle. These protections don't seem to be in place for sweep assists.
The execution tracer's view of this is confusing since it emits events for each call to
runtime.(*mspan).sweep, which is called in a loop fromruntime.(*mcentral).cacheSpan. This makes it look like the user goroutine is making a lot of progress on sweep work, since a single call to runtime.mallocgc can lead to thousands of tiny "SWEEP" blocks.Frustrated assists like this are perhaps more likely to happen in microbenchmarks than in production applications, but the way sweep work is shown in the execution tracer makes it hard to say for sure. This could be a contributing factor to #14812 — one of the goroutines in the recent execution trace spent over 17ms in sweep assists.
The test is below, followed by some example runs.
On a darwin/amd64 laptop:
The
at=0.169s delta=10.281msline matches up withgc 9 @0.154s 1%: 0.008+4.4+0.044 ms clock. The GC cycle began at 0.154s and completed around 0.158s. The record-breaking allocation delay finished at 0.169s and began at 0.159s.On a linux/amd64 server:
/cc @aclements @RLH
The text was updated successfully, but these errors were encountered: