-
Notifications
You must be signed in to change notification settings - Fork 2
3 Using the data
VideoAnalysis generates a lot of different files: various types of videos, images, and data files:
- _data.csv = Quantitative data from the analysis, see below for details
- _log.txt = General information about the analysed file and the analysis
- _stats.csv = Basic statistics generated from the _data.txt file
- -avg.jpg/png/tif = Average image, based on taking the average of all images in video stream
- -mavg.jpg/png/tif = Motion average image, based on taking the average of all motion images in video stream
- -mgx.jpg/png/tif = Horizontal motiongram, based on averaging over each column in each motion image
- -mgy.jpg/png/tif = Horizontal motiongram, based on averaging over each column in each motion image
- -mhi_first.jpg/png/tif = Motion history image: displaying motion average image (mavg) on top of first video frame
- -mhi_last.jpg/png/tif = Motion history image: displaying motion average image (mavg) on top of last video frame
- time = Time code from video file. This is the QuickTime timecode, which is a frame-independent timecode. Each row in the text file contains data for a single video frame.
- time_s = Time in seconds, calculated from QuickTime time code
- QoM = Quantity of motion (sum of pixels in motion image)
- HoM = Height of motion (distance between lowest and highest pixel)
- WoM = Width of motion (distance between leftmost and rightmost pixel)
- AoM = Area of motion (HoM*WoM)
- CoM_x = Centroid of motion X (spatial centre of AoM - X component)
- CoM_y = Centroid of motion Y (spatial centre of AoM -Y component)
- BMi_x = Bounding box miniumum X
- BMi_y = Bounding box miniumum Y
- BMa_x = Bounding box maximum X
- BMa_y = Bounding box maximum Y
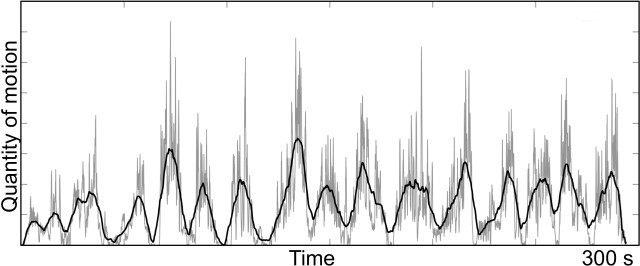
The broad field of computer vision is concerned with extracting useful information from video recordings. Some basic motion features that are commonly used in music research are derived directly from the motion image. Since the motion image only shows pixels that have changed between the two last frames in a video sequence, the sum of the values of all these individual pixels will give an estimate of the quantity of motion (QoM). Calculating the QoM for each frame will give a numeric series that can be plotted and used as an indicator of the activity

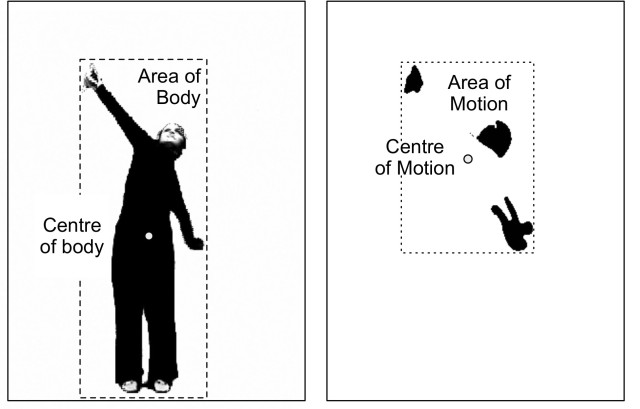
The centroid of motion (CoM) and area of motion (AoM) are other basic features that can easily be extracted from a motion image, and the differences between them are illustrated below. The CoM and AoM features can be used to illustrate where in an image the motion occurs as well the spatial displacement of motion over time.

The exported data can be used in various programs, including spreadsheet software such as LibreOffice and Excel.
- Open LibreOffice and select Spreadsheet
- The text files exported from VideoAnalysis use the English-language convention of using the dot (.) as decimal separator. This may cause problems on Norwegian (and other non-English systems), where comma (,) is often used as decimal separator. To circumvent this go to Options -> Language and choose English as "locale setting". (On OSX you find Options under LibreOffice, while it is under Tools on Windows).
- Open file (File -> Open)
- Remember to choose file type "Text CSV"
- Choose delimiter "Space" and then click on Finish.
Plotting in LibreOffice is as easy as in Excel. Start by selecting the row(s) you want to plot, and then click on the Chart button (or use the menu). Then select the type of plot you want to create.
Image:LibreOffice-chart.png|Chart button Image:LibreOffice-line-plot.png|Line plot Image:LibreOffice-XY-plot.png|XY plotTo import the text file with data:
- File -> Open: then select the file
- Original data type: choose "Delimited"
- Delimiters: choose "Space"
- If you are using an OS with settings other than UK/US you probably use comma as decimal separator. Then you should click on the "Advanced" button and choose to use . (dot) as the decimal separator. Otherwise your data will look like text strings and not numbers.
There are lots of ways of working with the data in a spreadsheet, and this is beyond this short guide. Often the first thing to do is to start by visualising the data. There are two types of displays that are useful for looking at movement data: time-series and XY-plots.
Image:Line-plot.png|Time-series line plot Image:Position.png|XY plot of positionFor more info about plotting you can refer to Excel's help file, or take a look at one of many [http://atom.physics.calpoly.edu/Excel/excel.html online tutorials].
Matlab is an advanced tool for plotting scientific data, but it also has a steep learning curve. You can use the data generated from VideoAnalysis there, but it is probably better to use the Musical Gestures Toolbox for Matlab instead.
Python is very versatile programming language, with lots of tools for data manipulation and visualization. You can use the data generated from VideoAnalysis there, but it is probably better to use the Musical Gestures Toolbox for Python instead.
A project from the fourMs Lab, RITMO Centre for Interdisciplinary Studies in Rhythm, Time and Motion, Department of Musicology, University of Oslo.