Skip to content

[Logstash] [Stack Monitoring] Add new metric to identify older version pipelines#34487

Closed
justinkambic wants to merge 21 commits intoelastic:6.8from
justinkambic:logstash_6.7-monitoring-add-pipeline-without-id-metric
Closed

[Logstash] [Stack Monitoring] Add new metric to identify older version pipelines#34487
justinkambic wants to merge 21 commits intoelastic:6.8from
justinkambic:logstash_6.7-monitoring-add-pipeline-without-id-metric

Conversation

@justinkambic
Copy link
Copy Markdown
Contributor

@justinkambic justinkambic commented Apr 3, 2019

EDIT - Adding testing instructions:

Testing

  • Assumptions: running this Kibana patch and a snapshot of ES 6.7
  • Configure Logstash 5.6 to send monitoring data. Start up with any pipeline like ./logstash -e 'input { stdin { } } output { stdout { } }'
    • Before you run, execute ./bin/logstash-plugin install x-pack.
  • Load the Monitoring Overview page, wait for Logstash data to be visualized.
    • At this point you should see the first two boxes, Overview and Nodes, but no Pipelines box
  • Configure Logstash 6.4+ (I used 6.7.0) to send monitoring data, start it up like above
    • Once this instance starts logging to a monitoring index, you should see the Pipelines box appear. It will display 1 Pipeline even though there are two, because of the reasons discussed in the comments below. It seems like we're all ok with this as a limitation of older versions of Logstash.

Summary

Resolves #24279.

As noted in the issue referenced above, older versions of Logstash (pre-6.4.0) will not display in Monitoring's Overview page unless a newer version of LS is also running. The reason this happens is also explained in comments on that issue.

The goal here is to add a second metric that will detect monitoring documents from older Logstash instances. Essentially, if there are any instances without a pipeline.id field, we would treat that as a case where we should ignore the special logic that runs to hide LS until the monitoring index has accrued a sufficient amount of data.

Checklist

Use strikethroughs to remove checklist items you don't feel are applicable to this PR.

For maintainers

@elasticmachine
Copy link
Copy Markdown
Contributor

Pinging @elastic/stack-monitoring

@elasticmachine
Copy link
Copy Markdown
Contributor

💔 Build Failed

@elasticmachine
Copy link
Copy Markdown
Contributor

💔 Build Failed

@elasticmachine
Copy link
Copy Markdown
Contributor

💔 Build Failed

@justinkambic justinkambic marked this pull request as ready for review April 4, 2019 19:14
@chrisronline
Copy link
Copy Markdown
Contributor

Hey @justinkambic, Do you mind adding some testing steps here?

@justinkambic
Copy link
Copy Markdown
Contributor Author

@chrisronline if you look at the test that failed CI you'll see that we're not counting things correctly using this method. The missing aggregation doesn't seem to catch things in the way I thought it would, likely because it's trying to look at logstash_stats.pipelines, which is an array field and seems to register as missing even if it's present.

I'm thinking instead it may be best to mimic the existing pipelines query utilizing nested and catch Logstashes that have a pipelines agg with 0 doc_count like below:
image
You can see the doc_count for the 5.6 instance is registering 0. Let me know if this sounds good to you.

@chrisronline
Copy link
Copy Markdown
Contributor

I'm honestly not sure the best way of detecting this. This seems okay to me, but maybe @ycombinator has some thoughts

@ycombinator
Copy link
Copy Markdown
Contributor

Yes, I think you're running into elastic/elasticsearch#9571 with trying to get the missing agg working on a nested field.

I think what @justinkambic proposed above should work but I want to spend some more time playing with the aggs.

@justinkambic
Copy link
Copy Markdown
Contributor Author

I want to spend some more time playing with the aggs.

Please feel free, I'm open to better suggestions!

@justinkambic
Copy link
Copy Markdown
Contributor Author

justinkambic commented Apr 5, 2019

It's also worth noting that whatever solution we introduce, we haven't addressed the queue type counts so far. If I am correct we are safe in assuming any of these older pipelines are using in-memory queues, so we could safely count +1 mem queue per "missing" pipeline to keep the overview screen consistent with the pipeline count.

@elasticmachine
Copy link
Copy Markdown
Contributor

💔 Build Failed

@ycombinator
Copy link
Copy Markdown
Contributor

ycombinator commented Apr 8, 2019

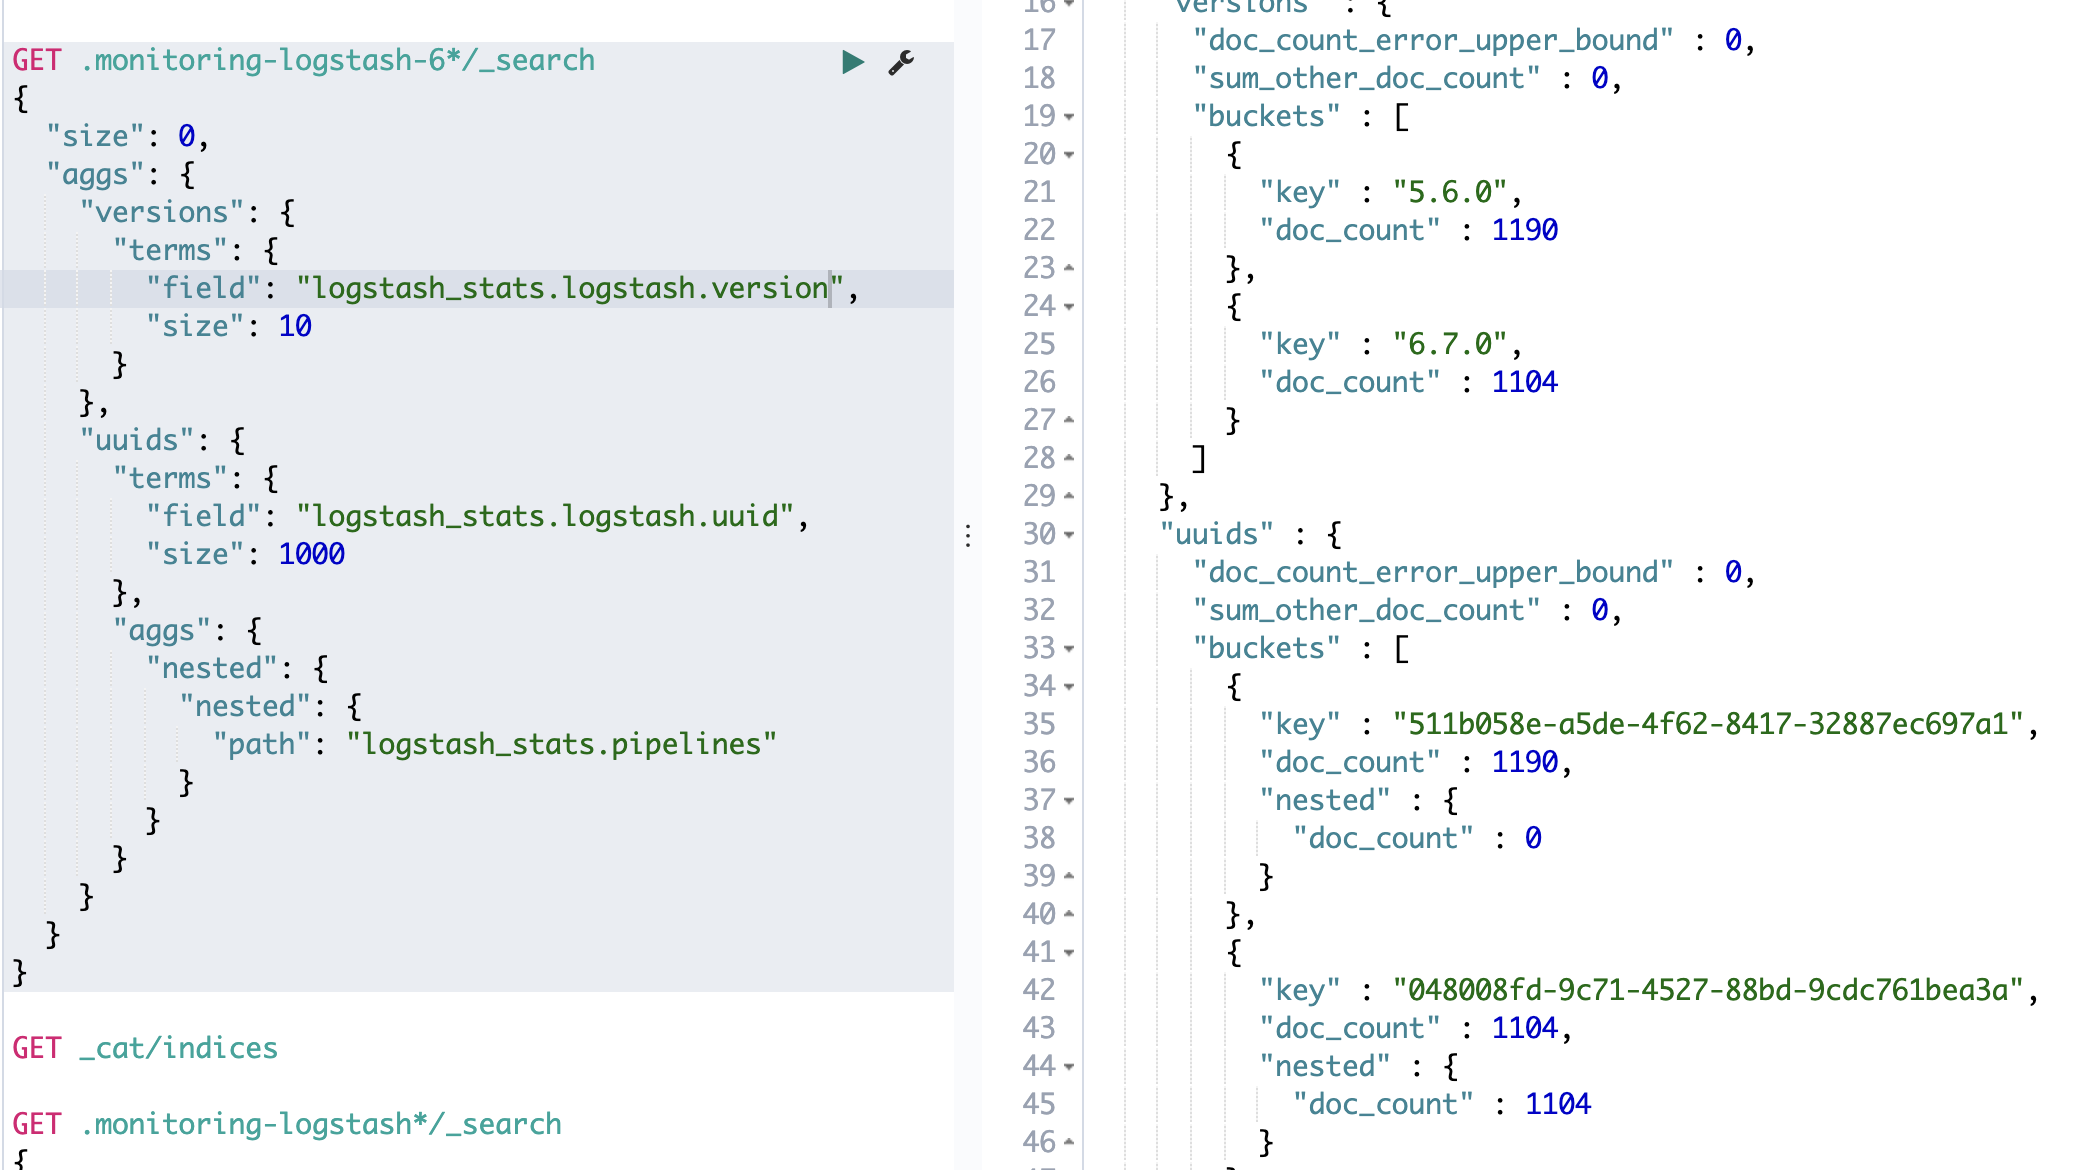
@justinkambic @chrisronline As promised, I played with the aggs a bit more and came up with the following solution. It involves extending the existing LogstashPipelineNodeCountMetric metric class with a new top-level agg and corresponding changes in the calculation method, without requiring any other code changes/additions:

diff --git a/x-pack/plugins/monitoring/server/lib/metrics/logstash/classes.js b/x-pack/plugins/monitoring/server/lib/metrics/logstash/classes.js
index dade736cd5..d1a278960e 100644
--- a/x-pack/plugins/monitoring/server/lib/metrics/logstash/classes.js
+++ b/x-pack/plugins/monitoring/server/lib/metrics/logstash/classes.js
@@ -376,6 +376,27 @@ export class LogstashPipelineNodeCountMetric extends LogstashMetric {
                 }
               }
             }
+          },
+          no_pipelines: {
+            filter: {
+              bool: {
+                must_not: {
+                  nested: {
+                    path: 'logstash_stats.pipelines',
+                    query: {
+                      match_all: {}
+                    }
+                  }
+                }
+              }
+            },
+            aggs: {
+              node_count: {
+                cardinality: {
+                  field: this.field
+                }
+              }
+            }
           }
         }
       }
@@ -395,6 +416,15 @@ export class LogstashPipelineNodeCountMetric extends LogstashMetric {
         );
       });
 
+      const DEFAULT_PIPELINE_ID = 'main'; // FIXME: Move to common constants
+      const oldNodesCount = _.get(bucket, 'no_pipelines.node_count.value', 0)
+      if (oldNodesCount > 0) {
+        if (!pipelineNodesCounts.hasOwnProperty(DEFAULT_PIPELINE_ID)) {
+          pipelineNodesCounts[DEFAULT_PIPELINE_ID] = 0
+        }
+        pipelineNodesCounts[DEFAULT_PIPELINE_ID] += oldNodesCount
+      }
+
       return pipelineNodesCounts;
     };
   }

Let me know what you think?

@chrisronline
Copy link
Copy Markdown
Contributor

Assuming that works (which I think it should), that looks much better!

@justinkambic
Copy link
Copy Markdown
Contributor Author

Assuming that works (which I think it should), that looks much better!

Agreed - testing locally right now.

@justinkambic
Copy link
Copy Markdown
Contributor Author

@ycombinator I think this looks pretty good - would you want to put up a PR with your patch? You're welcome to push to this one if you prefer.

</a>
<a
ng-if="monitoringMain.instance"
ng-if="monitoringMain.instance && monitoringMain.pipelineCount > 0 && monitoringMain.shouldDisplayPipelineNav === true"
Copy link
Copy Markdown
Contributor Author

Choose a reason for hiding this comment

The reason will be displayed to describe this comment to others. Learn more.

@ycombinator it's possible that the second condition in this ng-if is redundant now, but I did not test that.

@elasticmachine
Copy link
Copy Markdown
Contributor

💔 Build Failed

@elasticmachine
Copy link
Copy Markdown
Contributor

💚 Build Succeeded

@ycombinator
Copy link
Copy Markdown
Contributor

ycombinator commented Apr 29, 2019

I just re-tested this PR and I'm seeing a couple of issues when I run two Logstash nodes, one with v5.6.0 and the other with v6.7.1:

  1. Navigating to the v6.7.1 Logstash node, then clicking the Pipelines tab shows me the node's pipelines but it takes away the Pipelines tab on that page, i.e. it only shows the Overview and Advanced tabs. Note that this is not true if you click on the Overview tab or the Advanced tab - you still all three tabs in those cases.

    Apr-29-2019 16-43-40

    I switched my Kibana check out to the 6.7 branch and this bug isn't happening there so it's something specific to this PR.

  2. On my v5.6.0 node, I ran a pipeline like so: ./bin/logstash -e 'input { stdin {} } output { stdout {} }'. On my v6.7.1, I ran a pipeline like so: ./bin/logstash -e 'input { stdin {} } output { stdout {} }' --pipeline.id=main2 (note the --pipeline.id argument specifying a non-default pipeline ID). In this scenario, I see the Pipelines box on the Cluster Overview page. However, clicking on it throws a 500 error. Kibana server logs show this:

    server   error  [23:39:39.287] [error][monitoring-ui] TypeError: Cannot read property 'data' of undefined
     at processedResponse.pipelines.forEach.pipeline (/Users/shaunak/development/github/kibana/x-pack/plugins/monitoring/server/lib/logstash/get_pipelines.js:69:66)
     at Array.forEach (<anonymous>)
     at processPipelinesAPIResponse (/Users/shaunak/development/github/kibana/x-pack/plugins/monitoring/server/lib/logstash/get_pipelines.js:63:31)
     at handler (/Users/shaunak/development/github/kibana/x-pack/plugins/monitoring/server/routes/api/v1/logstash/pipelines/cluster_pipelines.js:49:32)
    

@justinkambic
Copy link
Copy Markdown
Contributor Author

I'll try to see if I can find some more time to dig into this but it will probably be on the back burner again for a bit. Thanks for testing so thoroughly! 💯

@cachedout
Copy link
Copy Markdown
Contributor

Hi @justinkambic. I'm just doing some team organization today and I came across this PR and I wanted to know if you think you'll have time to get back to it in the coming weeks or if there's anything that @elastic/stack-monitoring can do to help move it along? Thanks!

@elasticmachine
Copy link
Copy Markdown
Contributor

💔 Build Failed

@justinkambic
Copy link
Copy Markdown
Contributor Author

@cachedout I have been busy with 7.2 tasks and getting our 7.3 Uptime work rolling. I am planning to have some time to dedicate to it in the next week or two. If it goes beyond that span we should probably talk about a handoff.

@cachedout
Copy link
Copy Markdown
Contributor

@justinkambic Cool. Thanks!

@HuangJiaRen
Copy link
Copy Markdown

Error: Index .kibana belongs to a version of Kibana that cannot be automatically migrated. Reset it or use the X-Pack upgrade assistant.kibana7.1.1 version

@ycombinator
Copy link
Copy Markdown
Contributor

ycombinator commented Jun 21, 2019 via email

@cachedout
Copy link
Copy Markdown
Contributor

Hi again @justinkambic . I'm just checking back in on this. Do you think you'll be able to come back to this in the next few days or would you prefer to discuss a handoff?

@justinkambic
Copy link
Copy Markdown
Contributor Author

Hey @cachedout - sorry for the delayed reply, was OOO for several weeks. Perhaps we should hand it off, I don't see my workload letting up any time soon and this has been on the back burner for quite some time.

@cachedout
Copy link
Copy Markdown
Contributor

@igoristic Does this look like something you might be able to take on?

@justinkambic
Copy link
Copy Markdown
Contributor Author

I'm happy to provide explanation of the approach we were using if it's helpful. IIRC this change was pretty close, but @ycombinator found a case where the changes weren't working like they should and I haven't been back to the work since then.

@igoristic
Copy link
Copy Markdown
Contributor

@cachedout Just caught up on this issue now. This looks like something I can investigate, however, this might be irrelevant now since we no longer support 6.7 (and less than). I'll check to see if this is still a problem with 6.8

@spalger spalger changed the base branch from 6.7 to 6.8 September 19, 2019 22:20
@elasticmachine
Copy link
Copy Markdown
Contributor

💔 Build Failed

@chrisronline
Copy link
Copy Markdown
Contributor

Closing this due to inactivity

Sign up for free to join this conversation on GitHub. Already have an account? Sign in to comment

Labels

Projects

None yet

Development

Successfully merging this pull request may close these issues.

8 participants