[Elasticsearch] Limit maxSockets to 800 by default#151911
[Elasticsearch] Limit maxSockets to 800 by default#151911afharo merged 18 commits intoelastic:mainfrom
Conversation
…n/apply-concurrency-limits
86fb563 to
c947695
Compare
packages/core/elasticsearch/core-elasticsearch-server-internal/src/elasticsearch_config.ts
Show resolved
Hide resolved
|
@elasticmachine merge upstream |
|
☝️ Updating from |
|
There's a bug in the recent changes to the API Capacity CI. @dmlemeshko is looking to resolve it. We'll run the tests again to compare CPU and Memory usage once it's resolved. |
|
Analysing throughput at different response time cuttoffs shows slight improvements in throughput for some APIs and slight degradation for others. But overall nothing concerning here.
It would be useful to be able to compare the "1600 data views no cache" scenario with |
|
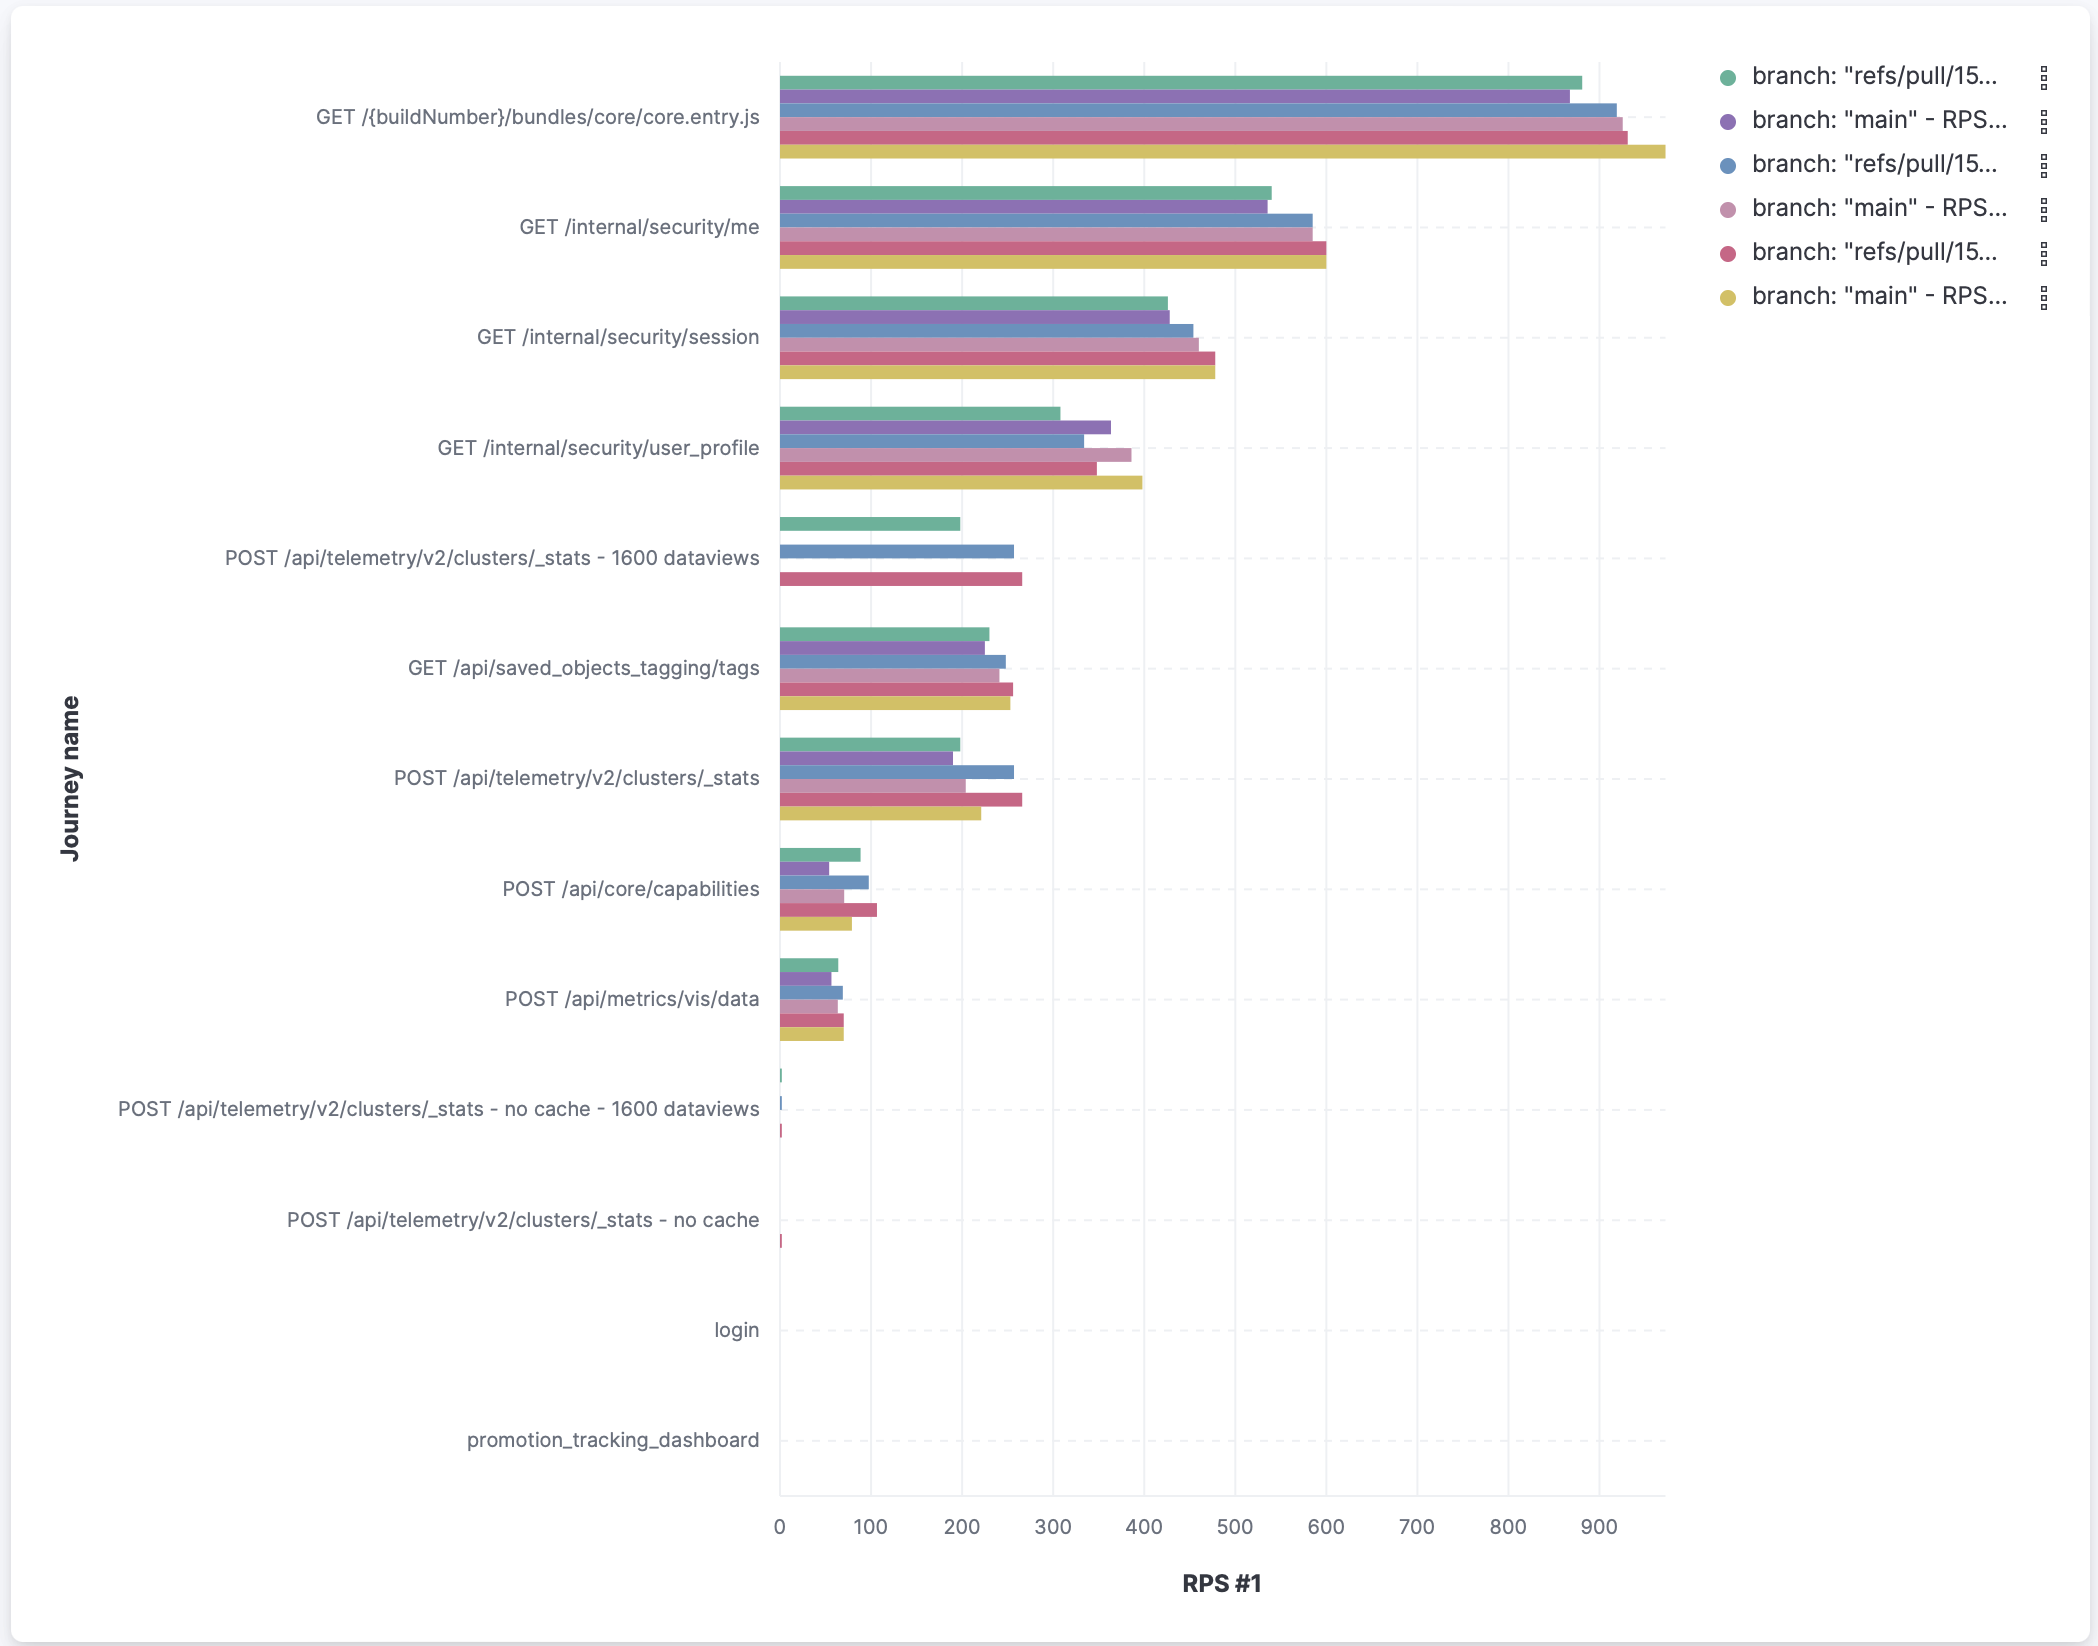
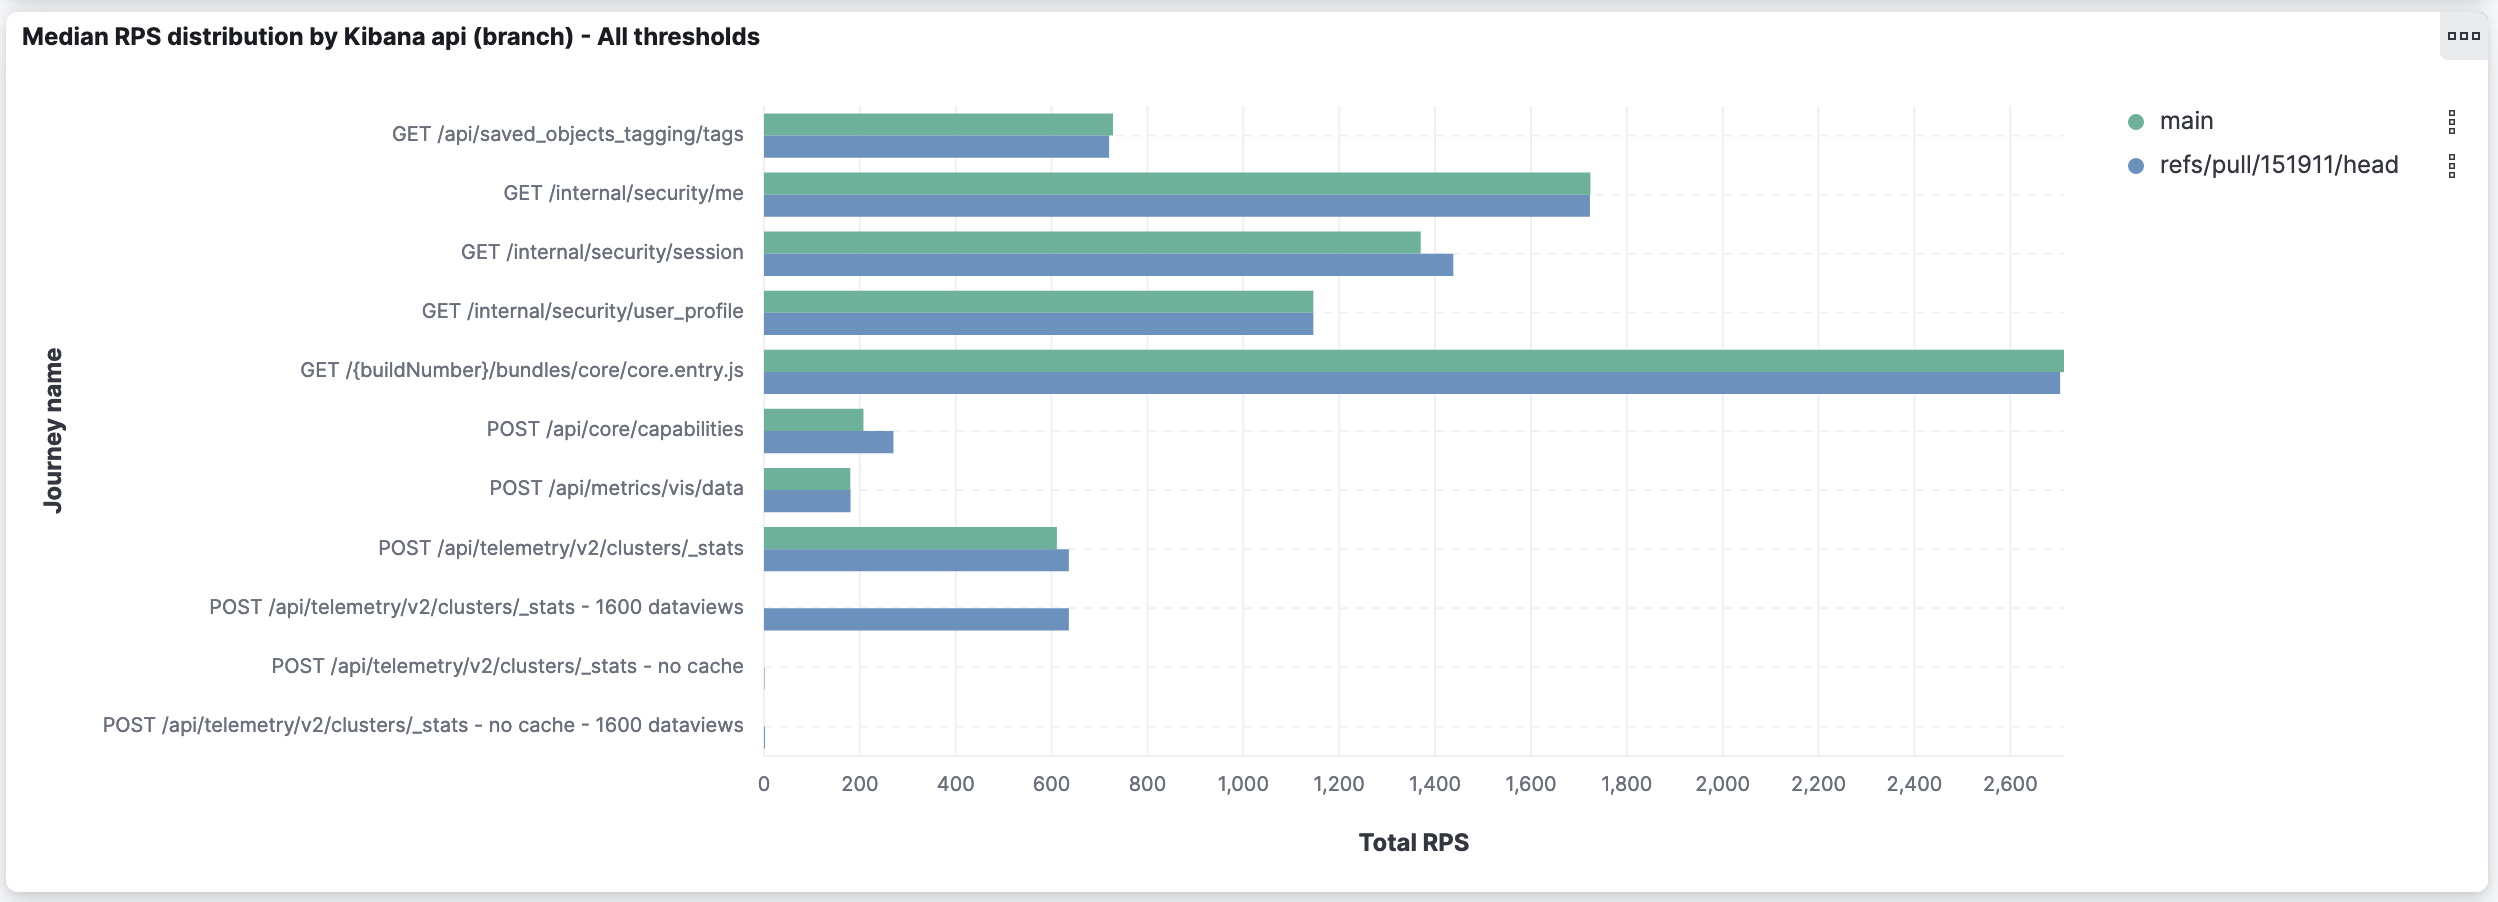
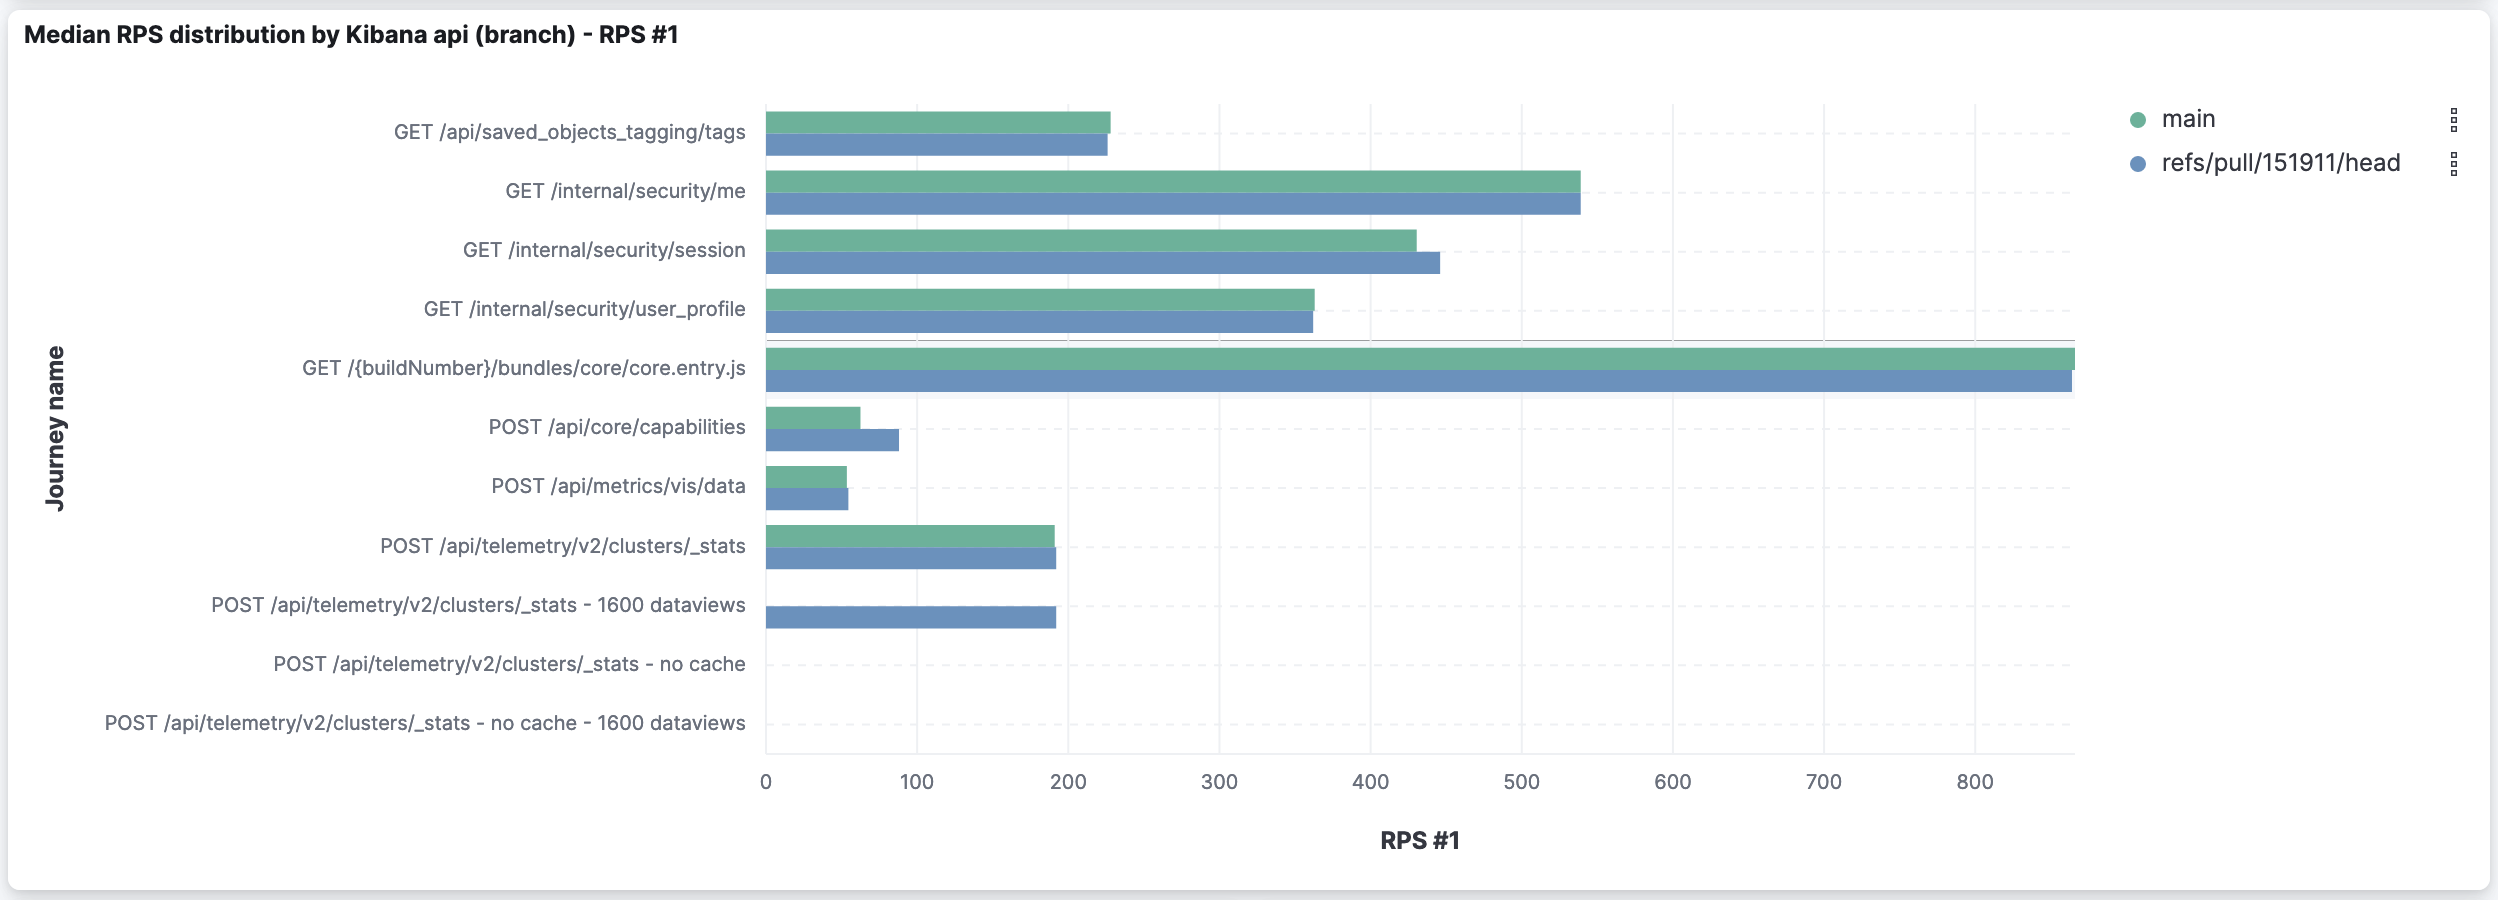
To extend @rudolf's assessment, I thought it was useful to compare the sum of RPS for all thresholds (which version is capable of handling more requests?) and the RPS for the first threshold (which version is faster?):
As highlighted by Rudolf: it shows slight improvements for some APIs and slight degradation in others. The deeper analysis I went through earlier showed the degradation is caused by a higher amount of timeouts on already timeout-prone APIs.
I'll push to get #151110 merged, so we can have those metrics from I'll also work today on comparing the CPU and memory usage in both versions. |
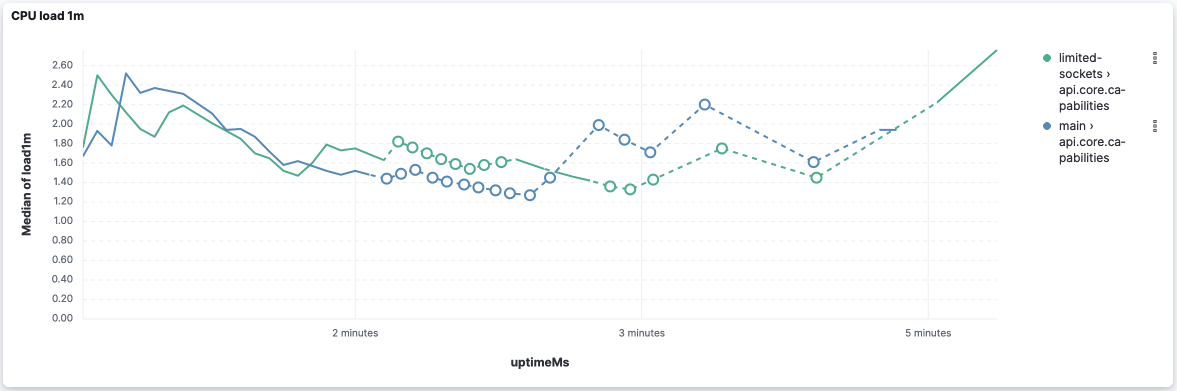
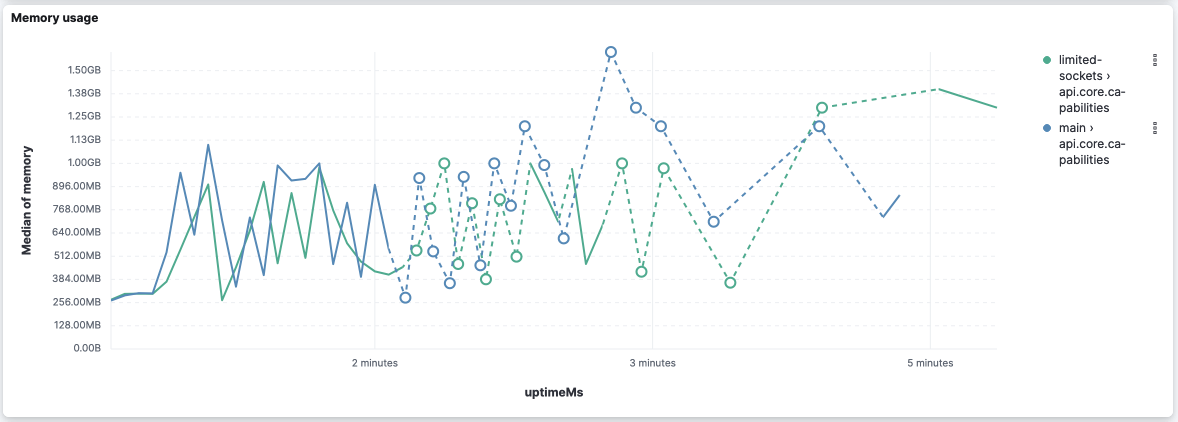
I processed the The logs and scripts used are here: scalability tests.zip. TL;DR, CPU load and memory utilization are very similar. Event loop delays might be a decisive factor. However, I noticed that Ops Metrics is not able to report it when it's too high 😢. And, with the current data, I'd say they are inconclusive. I'll process and upload the logs from subsequent CI jobs to have more data points and reduce the randomness of the data. Preliminary analysis from 1 CI job for each versionapi.core.capabilitiesBased on the reported metrics, I think we can claim that CPU and memory utilization are very similar:
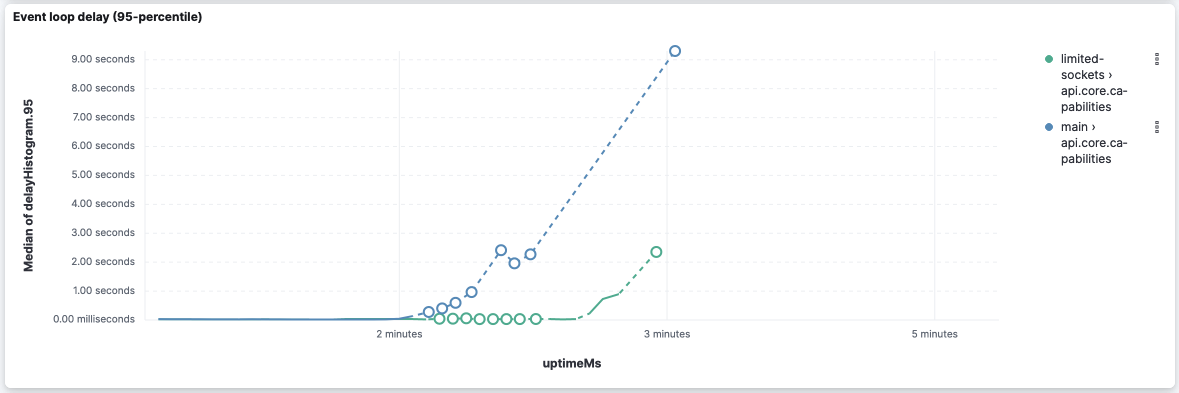
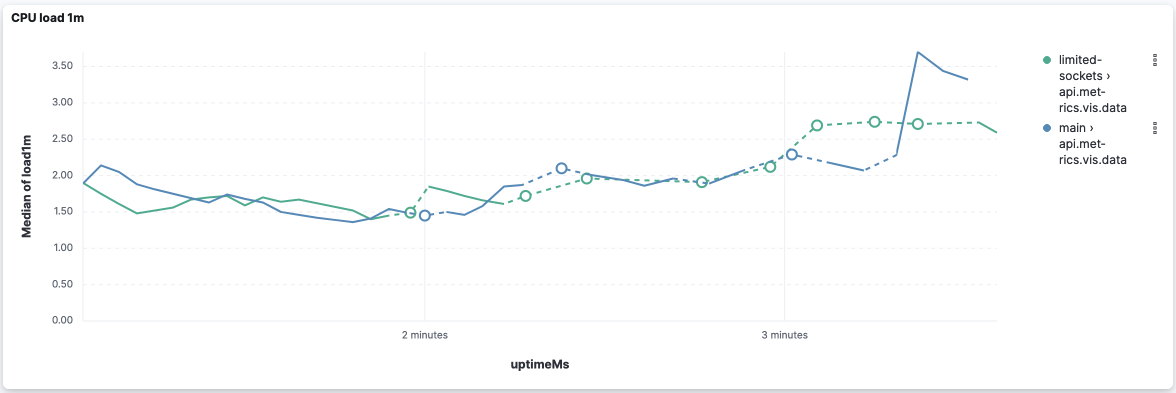
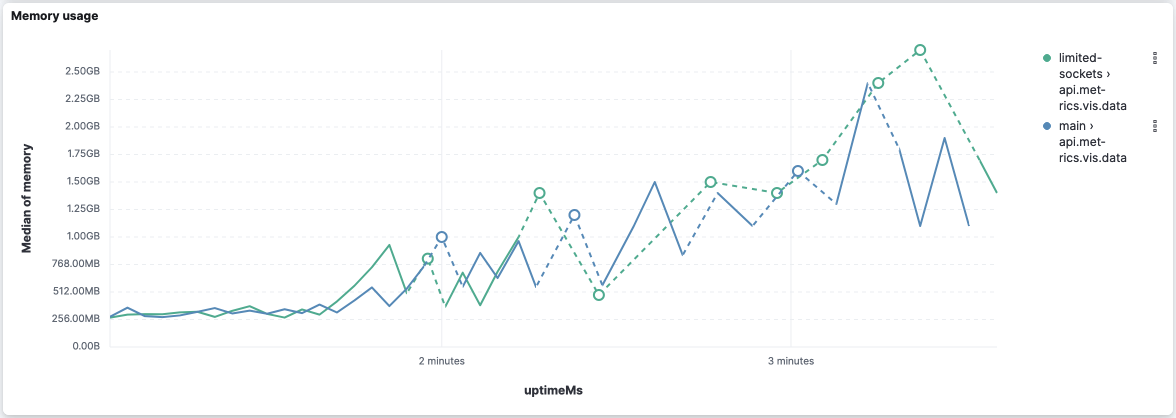
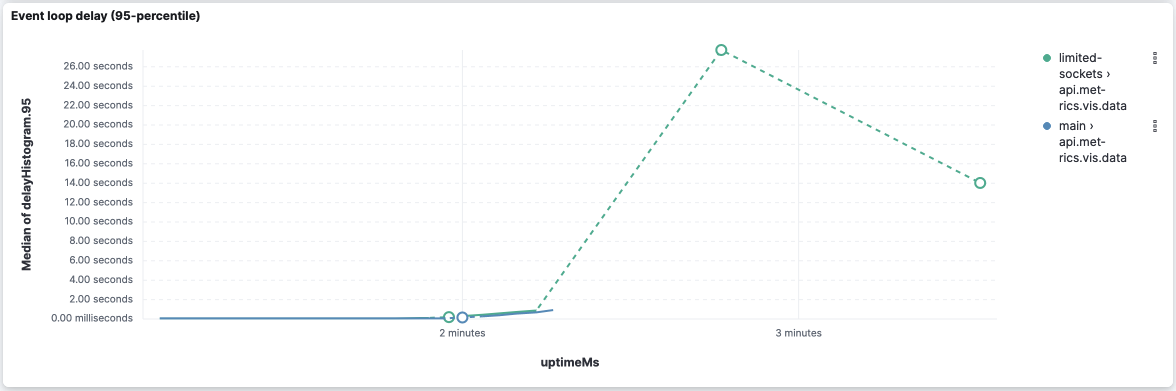
This version seems to improve the event loop delay for this API: However, it's worth noticing that both versions stopped reporting the event loop delay after 2 thirds of the execution (while memory and CPU are still metered). api.metrics.vis.dataAgain CPU and memory look very similar:
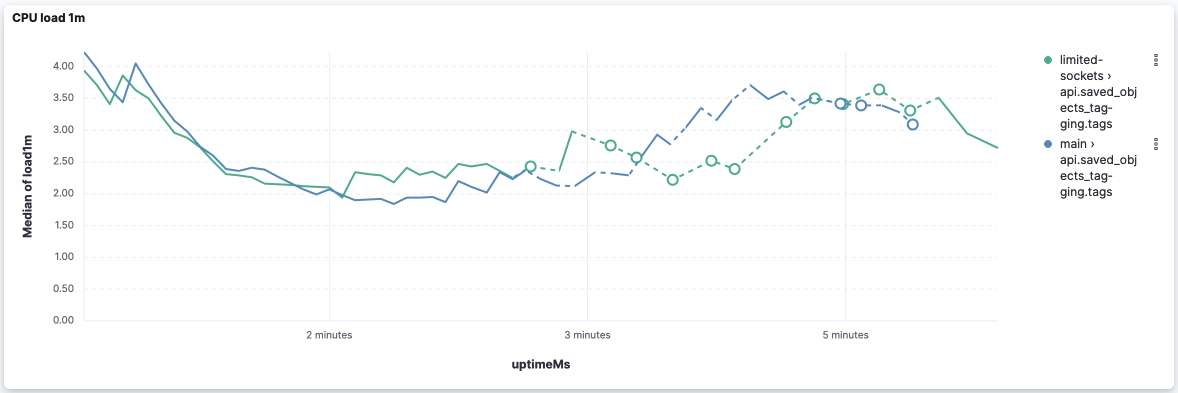
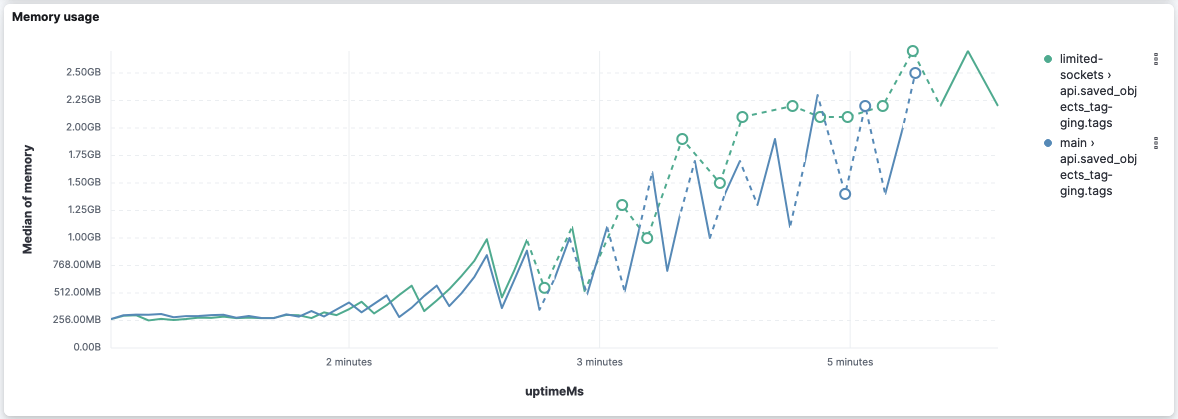
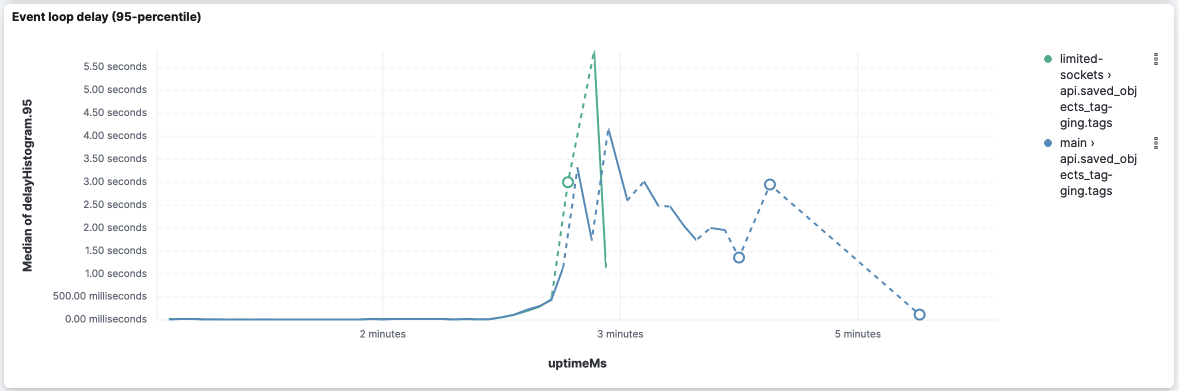
Event loop delay is really bad on both versions because they stop reporting right after the middle of the execution: However, this version was able to report some event loop delay (despite it being very high) while Looking at the logs, we can leverage the log entries However, I'd take these values with a grain of salt because I've seen logs where api.saved_objects_tagging.tagsCPU and memory:
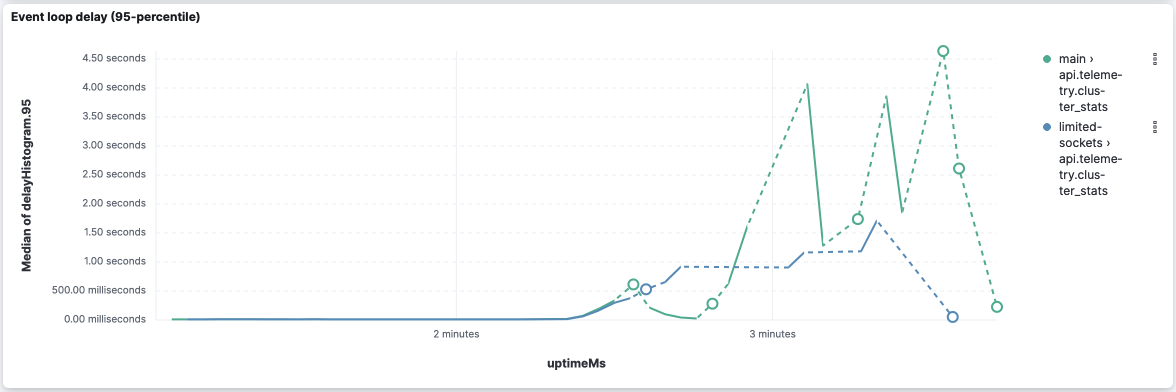
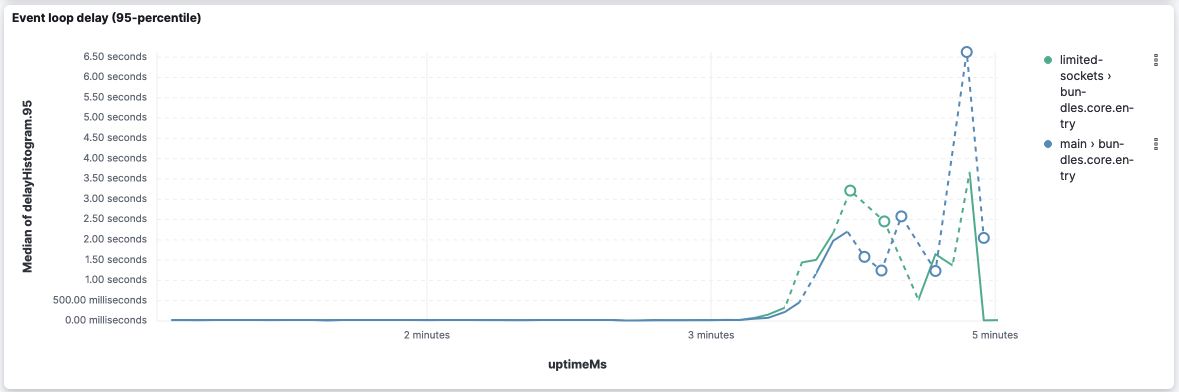
WRT Event-loop delays, it looks like Looking closer at this version's logs, we can see the following log entries (the first entry shows at the 3 minutes of execution): It goes up to 11s in the 4m30s of execution and starts going down after that. api.telemetry.cluster_statsCPU and memory are very similar... I'll focus on Even-loop delays from now on... bundles.core.entry
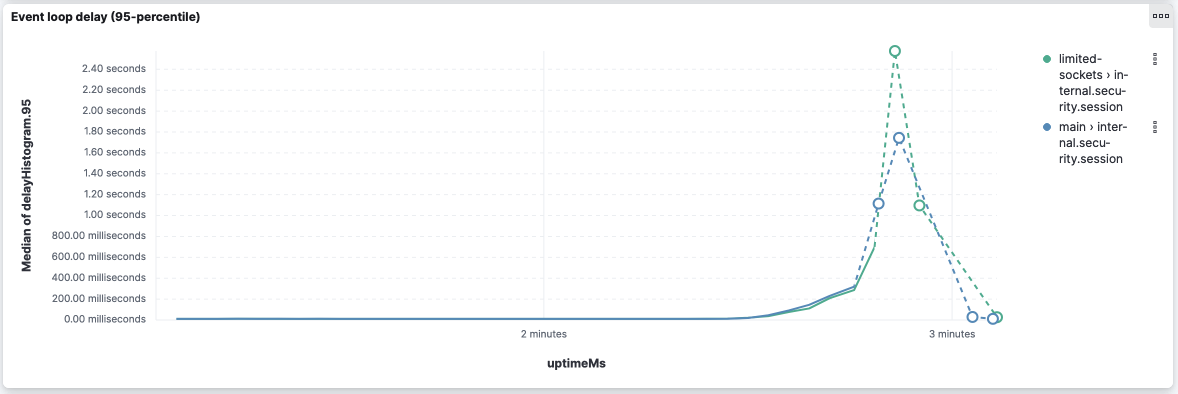
internal.security.session
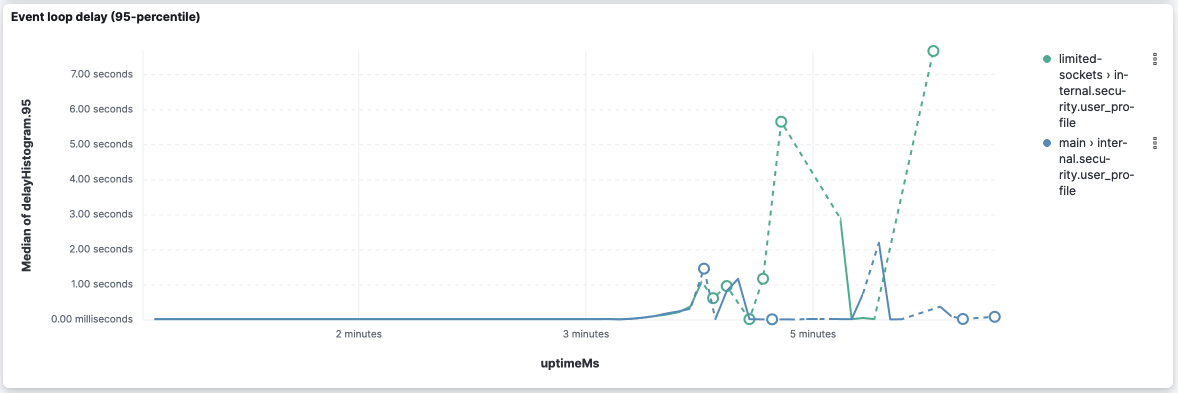
internal.security.user_profile
security.me
|
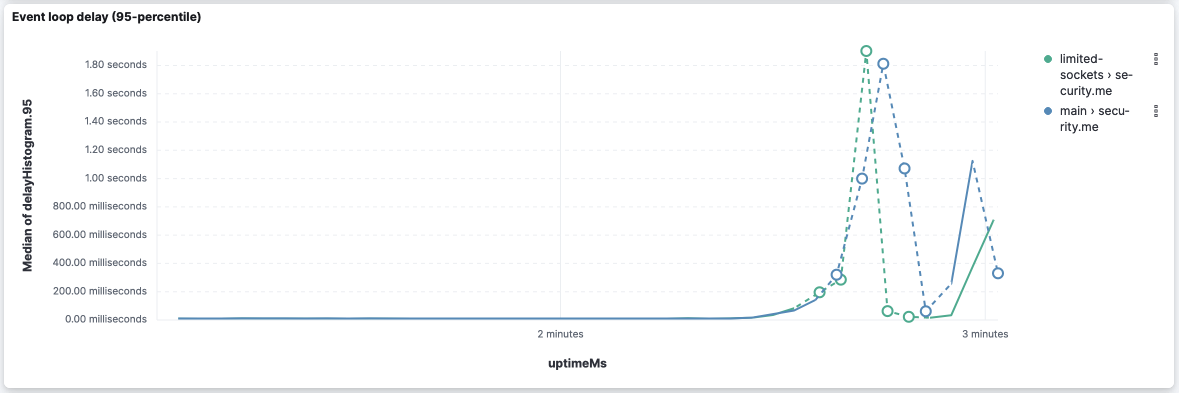
Done! Results can be analyzed at https://sec-tests.kb.europe-west1.gcp.cloud.es.io:9243/s/ops-metrics-analysis/app/dashboards#/view/cab987b0-8c68-4432-b920-1abf76874bb6 (u: TL;DR, the differences are smoothed out: Event-loop delays are more similar now. Although there are similar results: some APIs, Raw data and processing scripts here. |
|
Setting it as "ready to review" now... it looks like most of the results point out that this change is good for Kibana resilience in general, and the downsides are pretty minimal based on our tests (RPS and overall CPU and memory utilization are fairly similar). Adding @dmlemeshko as an additional reviewer. |
 rudolf
left a comment
rudolf
left a comment
There was a problem hiding this comment.
I think this would be an improvement and I think 800 is a good value to start with. But at this point I'm not confident that our testing ruled out that this would not have a negative impact on some workloads.
Because we don't have socket pool size metrics on ESS we also can't detect how many Kibana's might be exhausting their socket pools.
Perhaps we can add a logger similar to the "event loop delay threshold exceeded" logger. This would log whenever one of the httpAgents open sockets count matches the maxSockets limit. This way we (and users) can know that a cluster's throughput might be limited by the maxSockets config.
packages/core/elasticsearch/core-elasticsearch-server-internal/src/elasticsearch_config.ts
Show resolved
Hide resolved
I like that! I can look at how to add that logger. |
|
@elasticmachine merge upstream |
|
Update: we've enabled this on Cloud for deployments on 8.8.0+ as a way to monitor any potential impact. Once it's released with ms-93 in early June we should be able to validate the impact. |
|
Alternatively, we enriched metricbeat with the Do you think we should push to have this updated? |
This is on their roadmap but they didn't have a timeline last time I asked. |
💛 Build succeeded, but was flaky
Failed CI StepsMetrics [docs]
History
To update your PR or re-run it, just comment with: cc @afharo |
 justinkambic
left a comment
justinkambic
left a comment
There was a problem hiding this comment.
Rubberstamp Codeowners LGTM, changing a value in a test file we own.
Summary
It lowers the default
elasticsearch.maxSocketsfrom the currentInfinityto800.Why 800?
We are trying to prioritize 0% drops. Our tests indicate that 800 is the highest value we can set today to achieve this.
Scalability tests
The scalability tests (compared to
main) show an overall improvement in the resilience of Kibana (the rejection rate drops to 0%) at the cost of larger response times on average, although improving the 95 and 99 percentiles (lower standard deviation).👍 Lower drop rate / Higher capacity
Limiting the number of connections to ES allows Kibana to use those extra sockets to handle more incoming requests, drastically reducing the number of rejections and being able to handle
👎 Slower average response time
The average response time doubles in all tested scenarios. However, the Std Dev and 95 percentiles are lower in the socket-limited scenario.
main⏳ Note about timeouts
APIs that are typically slow in
main(response times are close to 60s) tend to 60s-timeout more consistently in this branch. We may want to extend the timeout for these tests.POST /api/metrics/vis/datamainRisk Matrix
800is still better thanInfinityin those scenarios.For maintainers
This PR was built on top of #151110. The actual changes in this PR are in the commit
c947695(#151911).