[ML] Hide anomaly charts for rare by mlcategory detector with model plot enabled #65080
Description
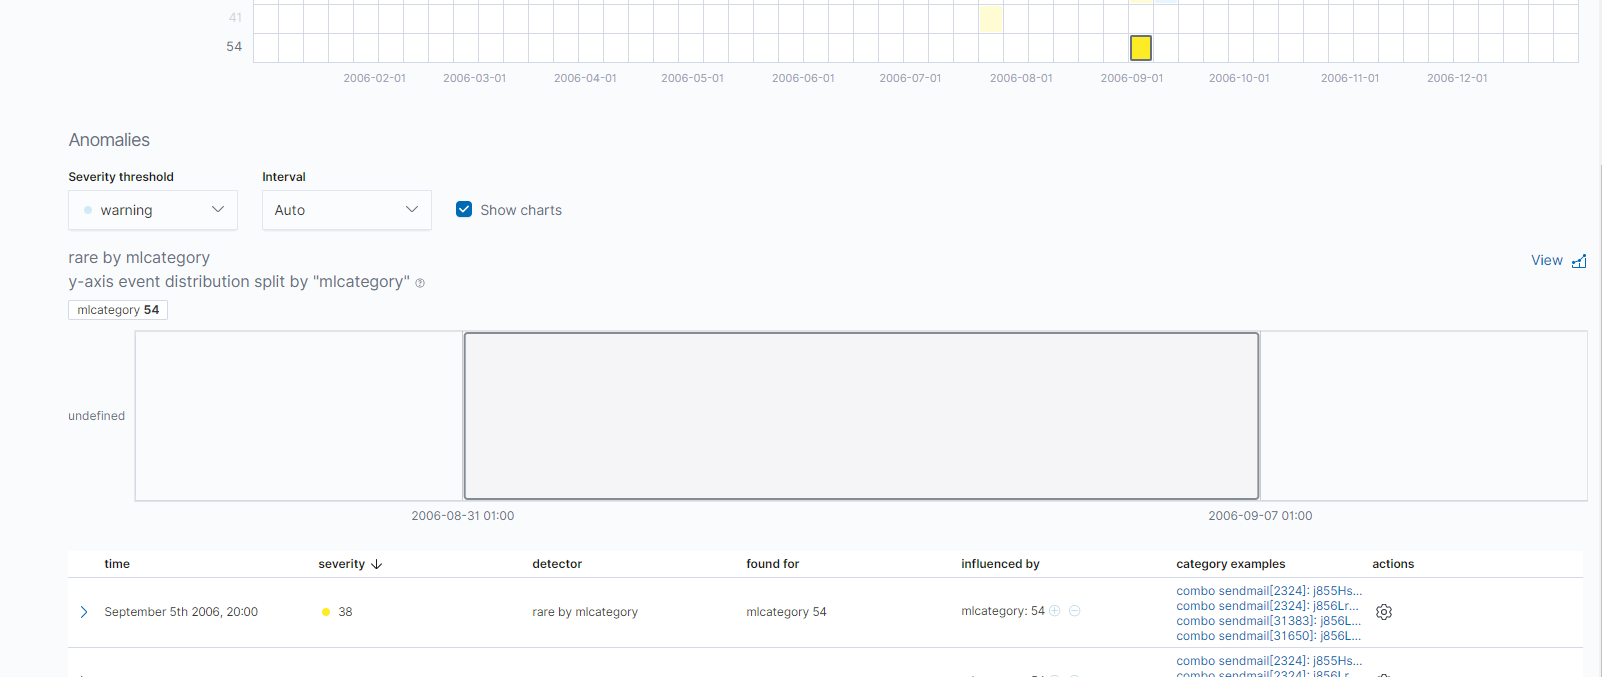
Anomaly charts for detectors using rare by mlcategory with model plot enabled are not currently supported in the Anomaly Explorer or Single Metric Viewer, but the charts are not being hidden, with the plots being rendered as empty:
The charts in the Anomaly Explorer should be hidden, and the links to the Single Metric Viewer should be disabled, until a chart is available for this detector (see #22922).
cc @tveasey