feat(legacy-preset-chart-nvd3): add zero imputation#758
feat(legacy-preset-chart-nvd3): add zero imputation#758villebro wants to merge 2 commits intoapache-superset:masterfrom
Conversation
|
This pull request is being automatically deployed with Vercel (learn more). 🔍 Inspect: https://vercel.com/superset/superset-ui/2a9yfk4ii |
a68da50 to
a1bb4e0
Compare
Codecov Report
@@            Coverage Diff             @@
##           master     #758      +/-   ##
==========================================
+ Coverage   24.45%   24.90%   +0.44%
==========================================
  Files         335      353      +18
  Lines        7654     7839     +185
  Branches      938     1003      +65
==========================================
+ Hits         1872     1952      +80
- Misses       5708     5785      +77
- Partials       74      102      +28
Continue to review full report at Codecov.
|

|
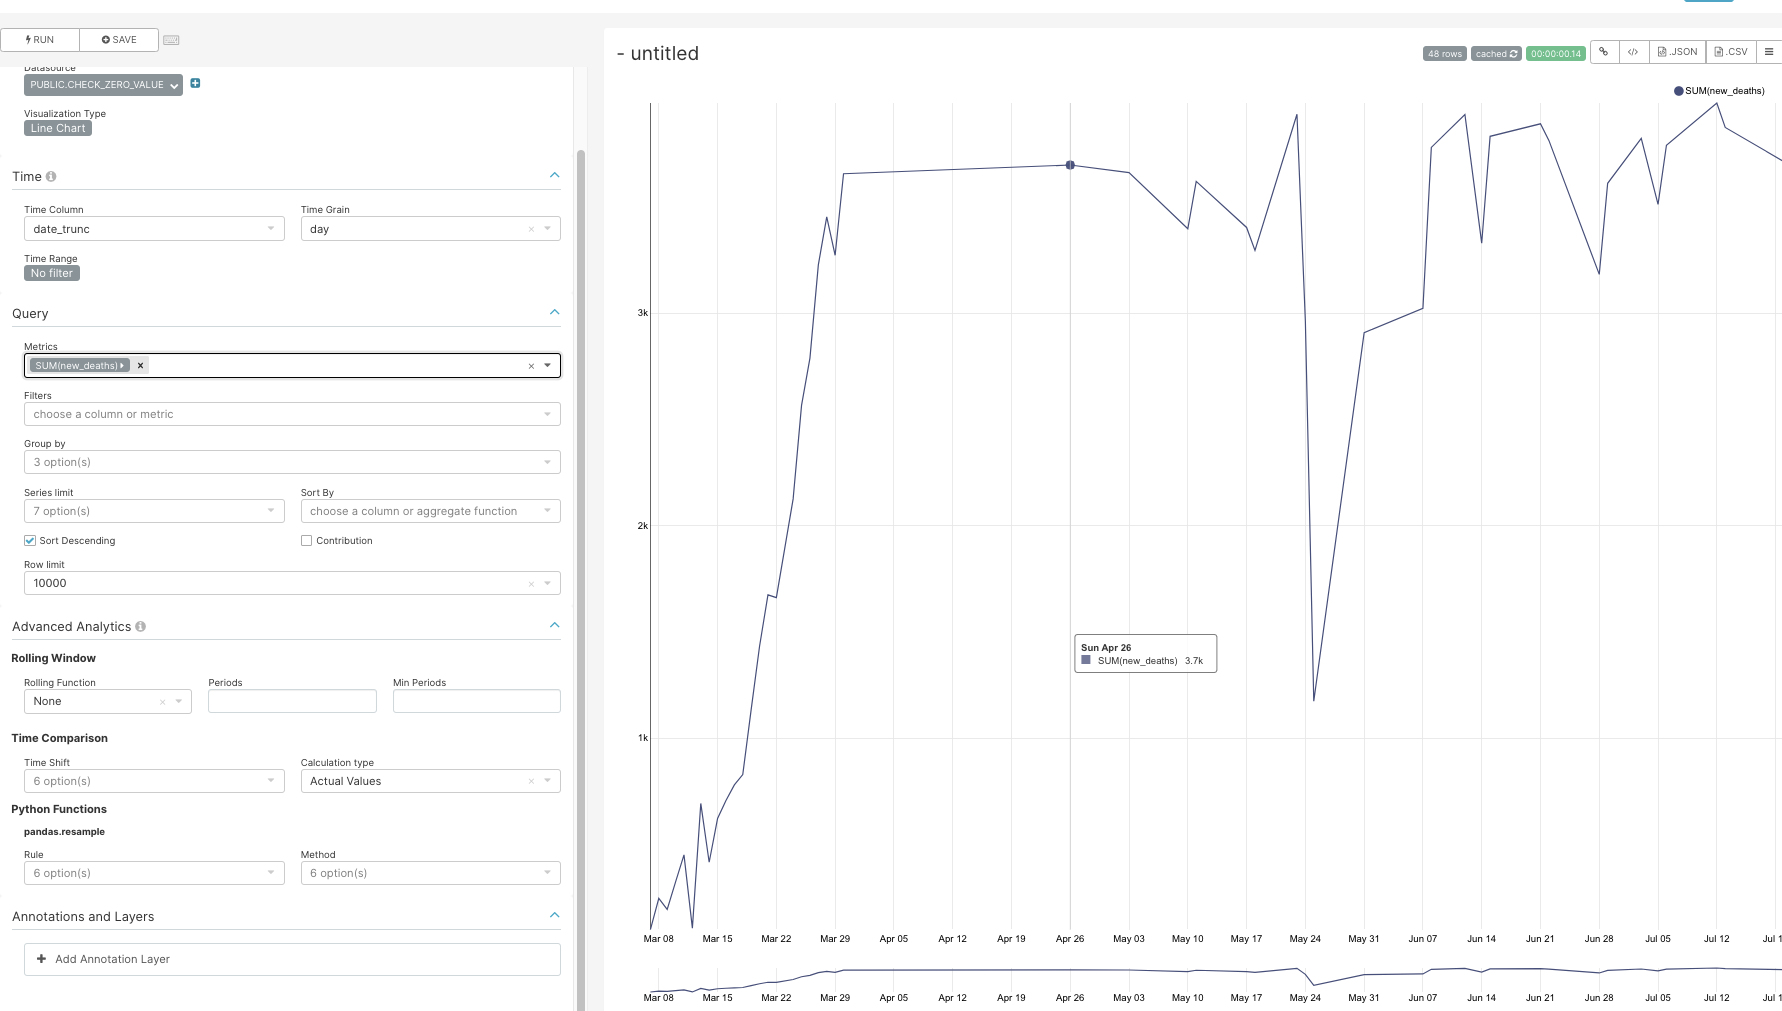
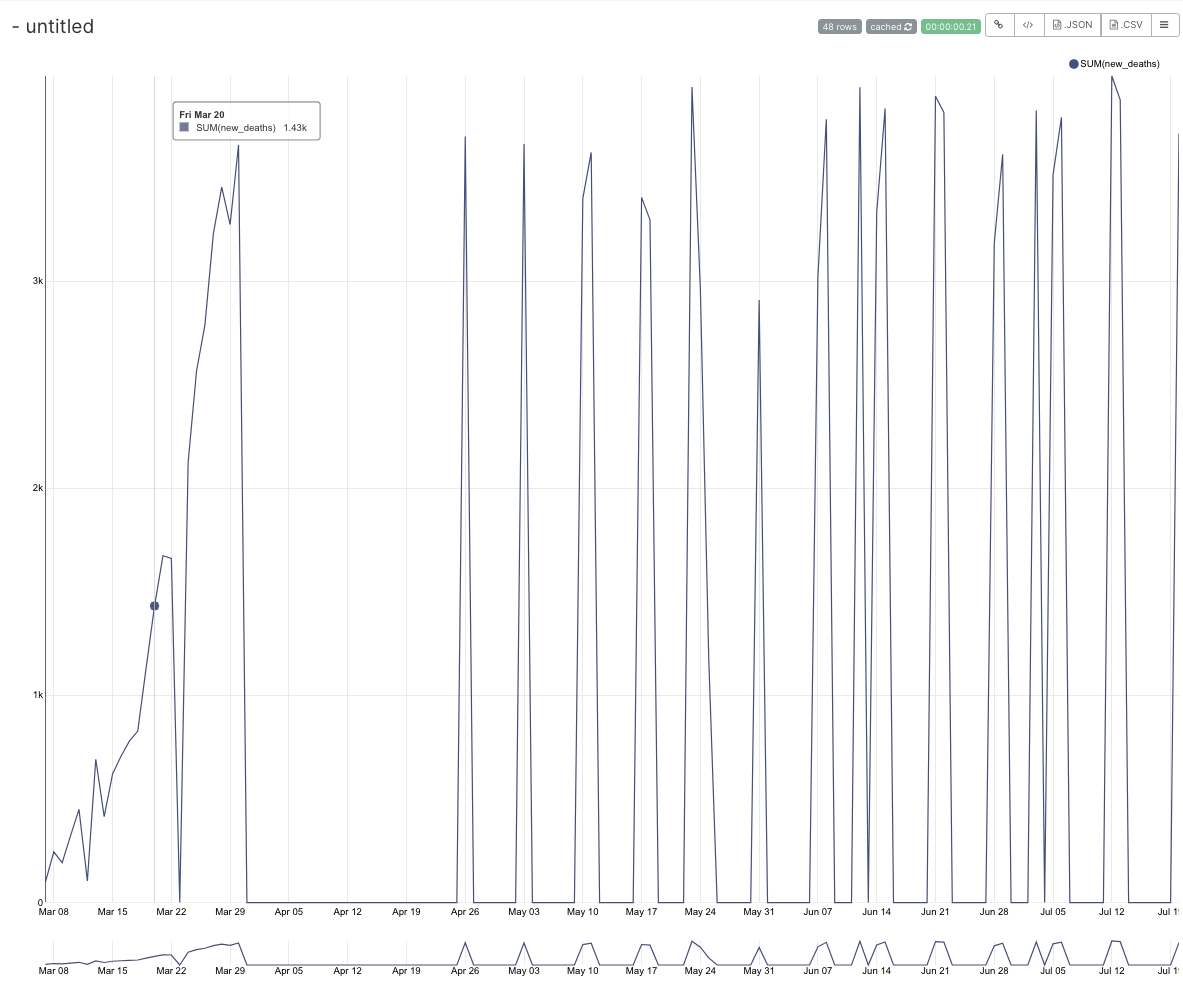
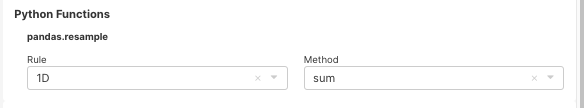
this feature is very important as it can completely change the chart interpretation if it is not clear that the data points are missing. For example, this chart has several dates missing : if we "fill the gap" of missing data points : I had been fixing this in the DB with time-series functions but not all the db support time series. I also had been resolving this by working around with resample :
but it is not scalable if the grain changes and also does not allows to use of other advance analytics function. |
|
And another good use case is in Time Series Chart; if dates are missing, the Comparison function does the comparison between data points to do WoW or MoM are not the real WoW. For example, if this is my dataset : 6/25/20 and I use the time-series table to do WoW by setting comparison of 7 periods, 07/09/2020 -> will be compared with 6/25/20, not with 07/02/20 |
+1 for this feature. |
| [<h1 className="section-header">{t('Data imputation')}</h1>], | ||
| [ | ||
| { | ||
| name: 'zero_out', |
There was a problem hiding this comment.
can the name be more specific e.g. fill_missing_with_zero or fill_zero? this parameter will be stored.
There was a problem hiding this comment.
Agreed, will update the name.
a1bb4e0 to
971607a
Compare
|
There's interesting interplay with the Another approach (not necessarily a better one) would be to add a new "Rule" that says "matches query time grain", and add a method "fill with zeros". This would enable for applying whatever fill-method makes sense at the specified time grain. Overall both these features (pandas.resample and this new checkbox) could be redesigned to be more comprehensive. This feels a bit like adding a layer to something already opaque. |
|
I don’t think that filling the gap is just a function the resample but a
feature for all the time series chart. If you use it only as resample you
can’t use any of the others functions as time comparison or rolling
functions.
|
I thought of adding that combo, but part of this design was influenced by discussions with a few business users who were clearly put off by using a multi-field option to fill missing grains with zero. So here the proposal was to make something that is easy to toggle on/off, and make it as business user friendly as possible. But I agree, this does add some potential clutter to the mix. Another option would be to reword and redesign the whole "resample" + "rule" fields to be less Pandas centric and more business centric, focusing more on what the feature does in a viz context (in this case gap filling). It'd be interesting to hear what people are currently using resampling for, but I'm guessing users should almost never be doing downsampling (that's what the time grain is for). So something like a checkbox for "Fill gaps" and then a "value" selector with a slightly simpler options, such as "zero" and "previous" should probably cover the majority of use cases. |
That's what I'm advocating for. About pandas.resample's typical use case, I think what's really typical here is to use timestamp level data event data (say at the millisecond level) that can be very "bursty" and defining how to both aggregate and fill the gaps. In our case, we're NOT interested in aggregating as we absolutely want to push that down to the db engine. From a more conceptual perspective (deviating form pandas' take on this here) we are interested in dealing with gaps though. I think that the methods that are reasonable to expose are (in order of my interpretation of popularity of desires & expectations):
While people might want forward-fill and backward-filling, I don't think that generally it's right to make up data points that don't exist. There's a case where your raw data represents something like "setting a gauge" or "changes in rank" where conceptually forward filling is right though. Pretty narrow use case... Am I missing anything? |
|
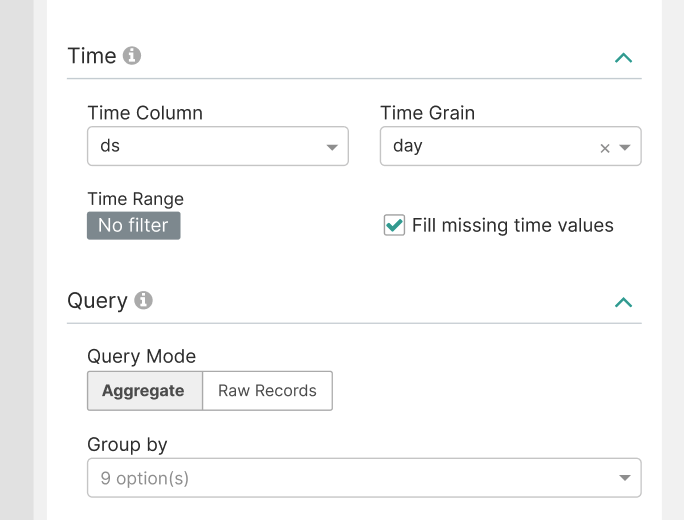
Missing data was once a pain for Big Number with Trendline, too. I I did something similar but different to fix: apache/superset#9341 For my case, I didn't have to fill missing dates in between available records because they already look like zeros in the viz, but had to also added forward fill just for the last timestamp. I agree it would be very helpful to have data imputation based on time grains. Coming to think of it, I feel maybe we can just make this checkbox + fill method select part of the "Time" control section so to enable it for any timeseries chart:
Users may also choose to configure fill methods for each metric separately in AdhocMetricsControl or another control. |
Looking forward to this solutions, thank you @villebro & @eugeniamz for fixing this. |
|
This feature very useful for non-aggregate data to show the gaps |
🏆 Enhancements
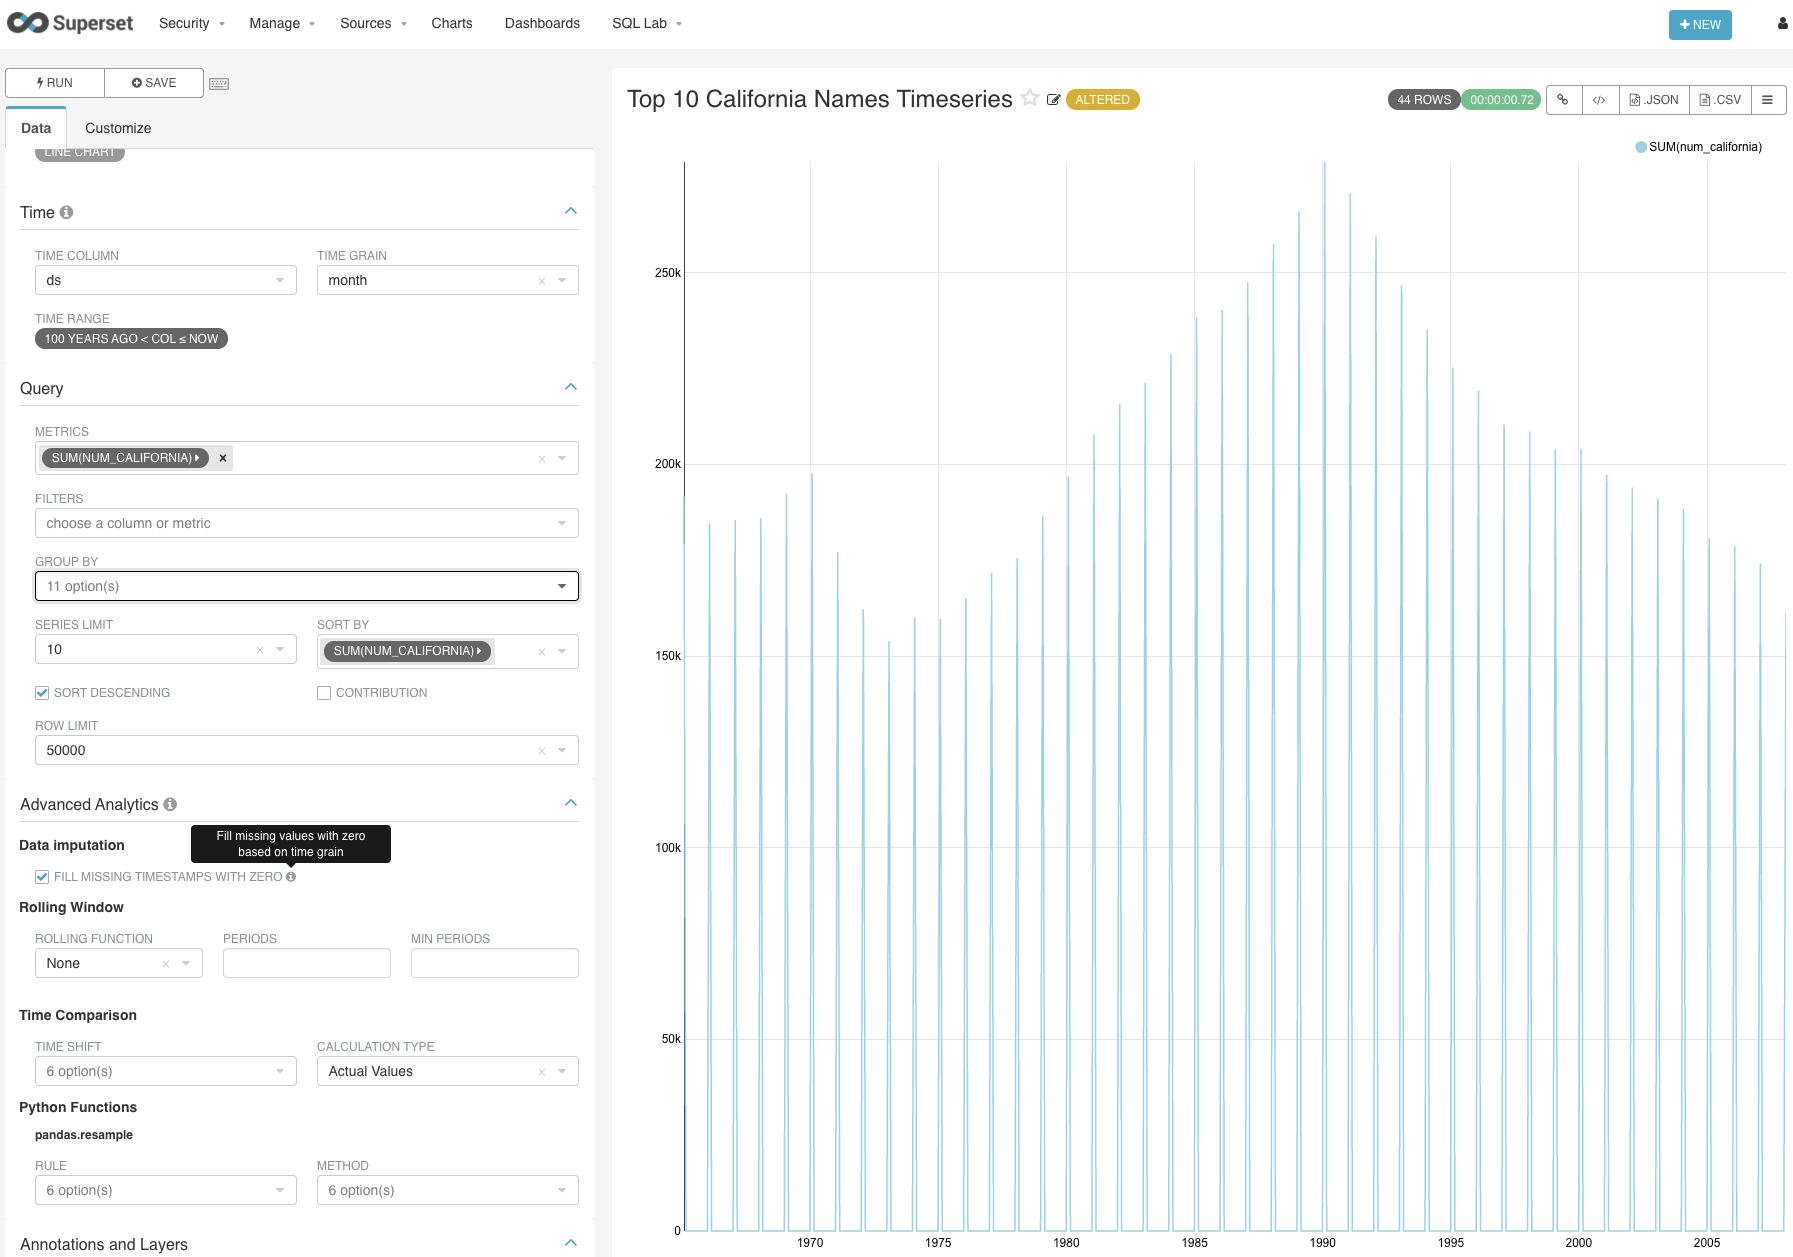
Add control for imputation of missing timestamps. Useful if missing data indicates zero observations.
SCREENSHOTS (these changes are on a forthcoming PR on
incubator-superset)When imputing annual data with monthly time grains:
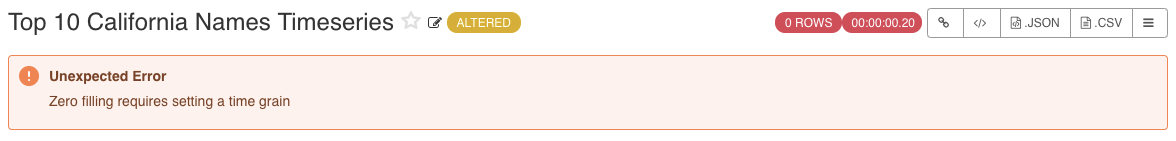
When trying to zero out without selecting a time grain first: