Request presentation use
In order to use the request presentation UI, a valid OpenIoT account is required. When the user first launches the request presentation UI they will be automatically redirected to a log-in screen. After a successful log-in, the user will be redirected to the main application UI.
[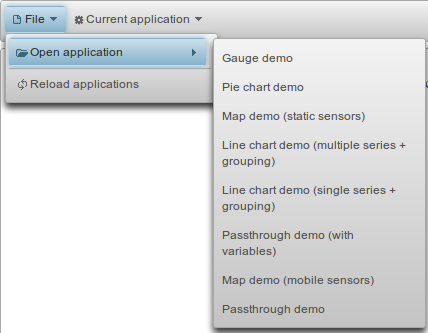 ](Documentation/images/request-presentation/01-file-menu.png)
To open a specific application dashboard click the open application menu and select one of the available applications. A dashboard containing all sink nodes that were defined in the selected applications will be generated and displayed. The dashboard data will be periodically updated every 1 minute.
This menu option allows the user to reload their applications from the openIoT repositories. The loaded applications will replace the currently loaded applications.
[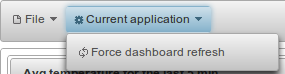 ](Documentation/images/request-presentation/02-app-menu.png)
The dashboard data will be periodically updated every 1 minute. It is possible however to manually trigger a data refresh for the entire dashboard by selecting this menu item. Keep in mind that all dashboard widgets update asynchronously and independently from each other.
The meter gauge node displays its input with a meter gauge configured with the property values that were set by the request presentation UI. To reset the widget measurement, click the icon on the top left corner of the widget.
[ ](Documentation/images/request-presentation/02-meter-widget.png)
This node displays a map where the node's inputs are displayed using markers or circle overlays. To reset the map's markers and overlays, click the icon on the top left corner of the widget.
[ ](Documentation/images/request-presentation/03-map-widget.png)
This node displays a pie-chart with a configurable number of series. To reset the widget measurements, click the icon on the top left corner of the widget.
[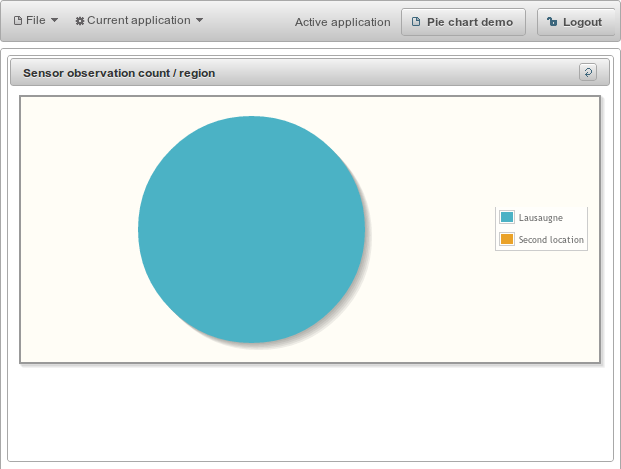 ](Documentation/images/request-presentation/04-pie-widget.png)
This node displays a line chart that supports multiple user-configurable series. You can examine a value at a particular point by hovering over the point with your mouse. To reset the widget measurements, click the icon on the top left corner of the widget.
[ ](Documentation/images/request-presentation/05-line-chart-widget.png)
This is a special node that works as a generic sink. It allows the user to define a configurable number of attribute endpoints and connect values to each one of the attributes. This widget renders all attribute values in tabular form. To reset the widget measurement, click the icon on the top left corner of the widget.
[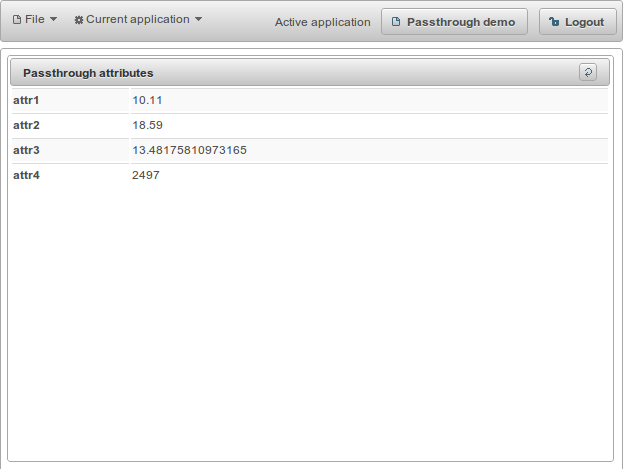 ](Documentation/images/request-presentation/06-passthrough-widget.png)
For using the Request Presentation application a service must have been created for it. When the OpenIoT graph is initialized, a service is created for the Request Presentation with the following address, key and secret as defined in the openiot.properties:
- security.initialize.reqPres.prefix=http://localhost:8080/ui.requestPresentation
- security.initialize.reqPres.secret=requestPresentationUI-secret
- security.initialize.reqPres.key=requestPresentationUI
Currently, for using the application, no permissions are needed for the user on the request definition service. However, the user must have the permission "*" on the Scheduler and SD&UM services.
The security configuration for the Request Presentation application is located in security-config.ini in the JBoss configuration directory. The configuration content is delimited by @BEGIN-requestPresentation and @END-requestPresentation.