-
Notifications
You must be signed in to change notification settings - Fork 357
Debugging
🎵Note: This documentation is outdated at this point, especially when using the Node tools in Visual Studio 2017. We're working on update docs, and will redirect you to those when they're ready.
This page explains how to get started debugging a Node.js application using Node.js Tools for Visual Studio (NTVS). Topics covered include: setting up and debugging a project, setting breakpoints, stepping through code, breaking on exceptions, and inspecting application state.
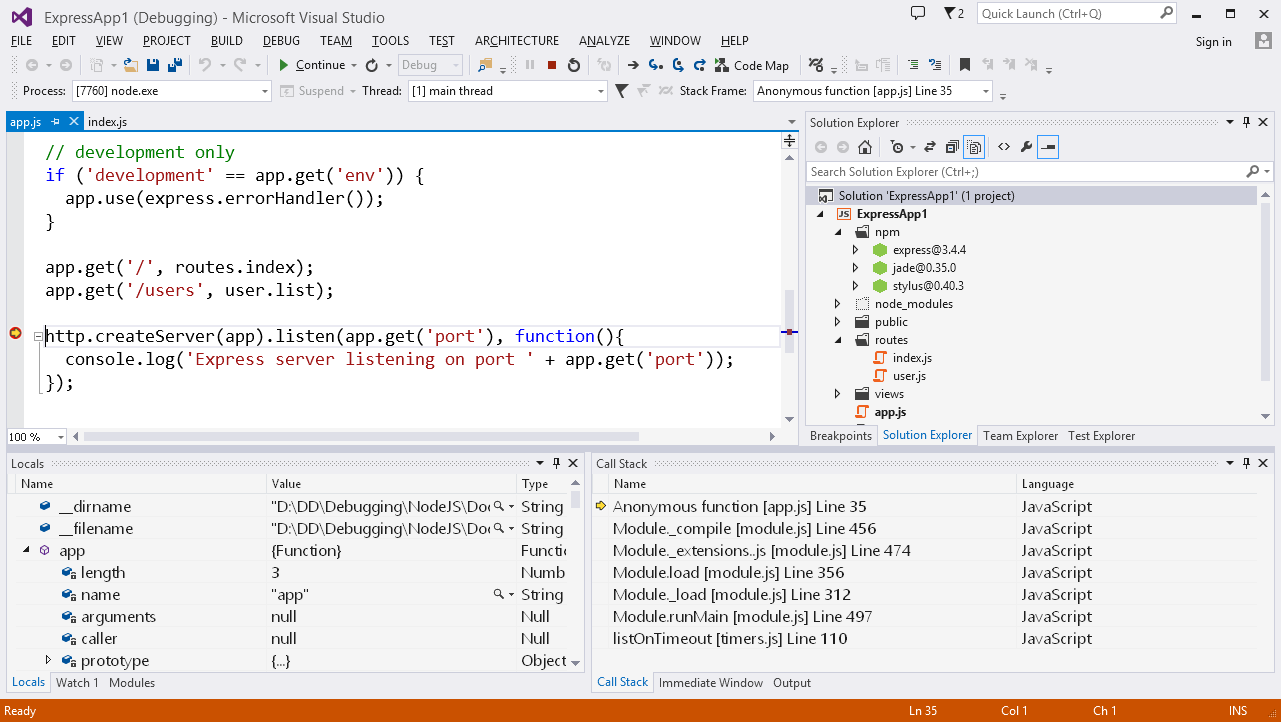
The NTVS debugging workflow should be familiar to anyone who has debugging using Visual Studio before, but this guide assumes that you are just getting started with Visual Studio.
- NTVS Debugger Overview Video - Covers much of the same material as this document.
- Advanced-Debugging - Details more advanced debugging techniques such as conditional breakpoints and remote debugging.
To debug using NTVS, you will need to be using a project. (See Projects for information on creating and using projects.) With a project, you can associate debugging settings with your script, including a startup file and command-line arguments. These options will prevent you from needing to start your programs from the command line. See Debugging options for information about modifying these settings.
Debugging a Node.js project is as straightforward as opening (or creating) the project in Visual Studio, setting desired breakpoints, and choosing 'Debug\Start Debugging' (F5). By default this will launch Node.exe under the debugger for your project's startup file, and launch a browser to your Node.js application's URL.

🎵Note: It is also possible to start debugging a Node.js project by choosing Step Into (F11) or Step Over (F10). This will launch the debugger and the browser, and break at your project's startup file's entry point.
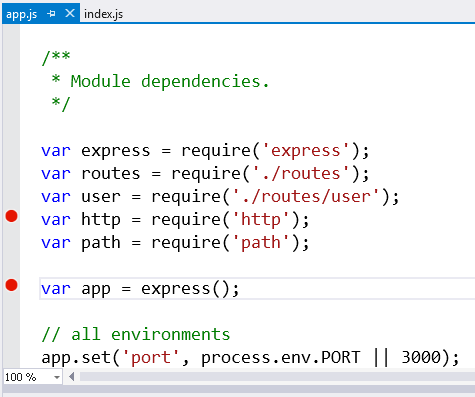
Breakpoints, as shown in the image to the right, are lines of code where the debugger should stop executing and allow you to investigate the program state. They can be set by clicking in the margin of the code editor, or by right-clicking on a line of code and selecting Breakpoint, Insert Breakpoint.
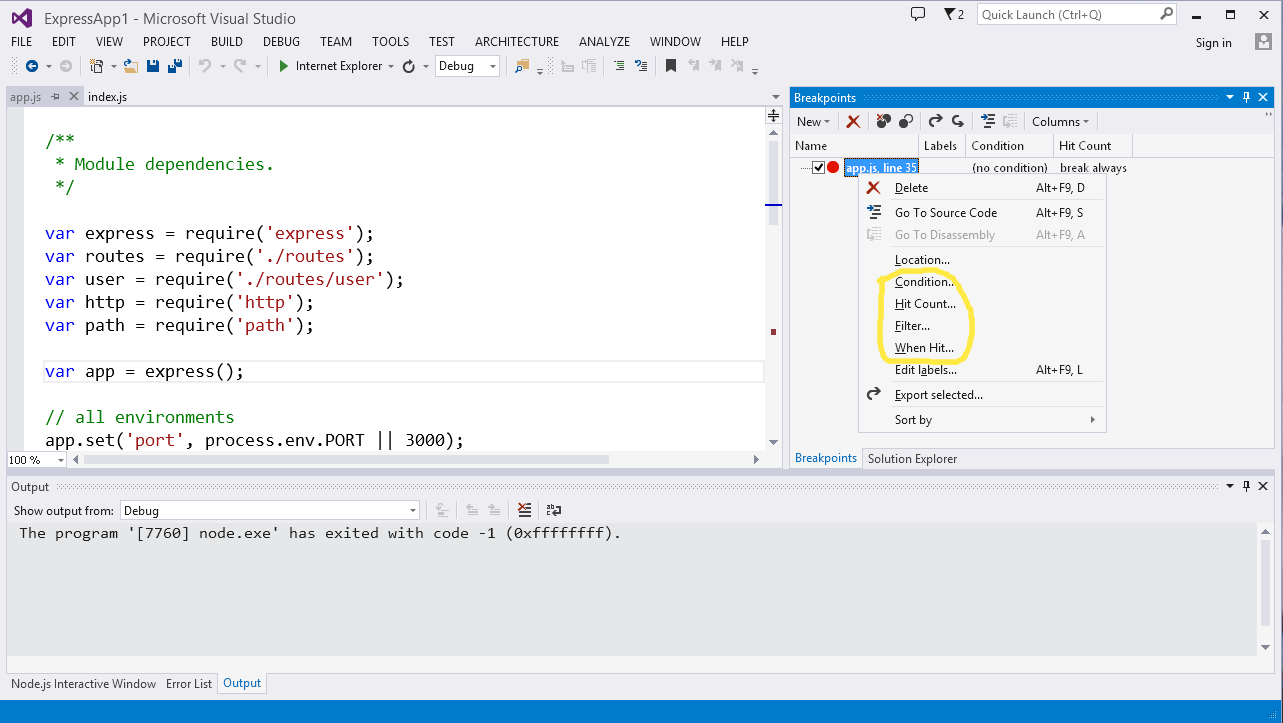
Node.js Tools for Visual Studio supports standard and advanced (conditional, "Hit Count" and "When Hit") breakpoints. (See Advanced Debugging for information on creating and using advanced breakpoints.)

Once you've broken into the debugger, you can step through your code one statement at a time. The step commands include Step Into, Step Over, and Step Out.
Step Into will execute the next statement and stop. If the next statement is a call to a function, the debugger will stop at the first line of the function being called. Check the Debug, Step Into menu to find the keyboard shortcut to use to step (typically F11).
Step Over will execute the next statement, but if it is a call to a function then the entire function will be executed. This allows you to easily skip functions when you are not interested in debugging them. Check the Debug, Step Over menu to find the keyboard shortcut (typically F10).
Step Out will execute until the end of the current function. It is useful when there is nothing else interesting in the current function. Check the Debug, Step Out menu to find the keyboard shortcut (typically Shift+F11).
If you want to continue running, you may use the Continue command (typically F5). Your program will not break until the next breakpoint. Note that when you Step Over or Step Out, if the running code hits a breakpoint it will break again, even if it has not reached the end of the function.
By default, the Node.js debugger breaks on exception. If an exception is hit while running under the debugger, the debugger will break and then pop-up a dialog containing the exception details.
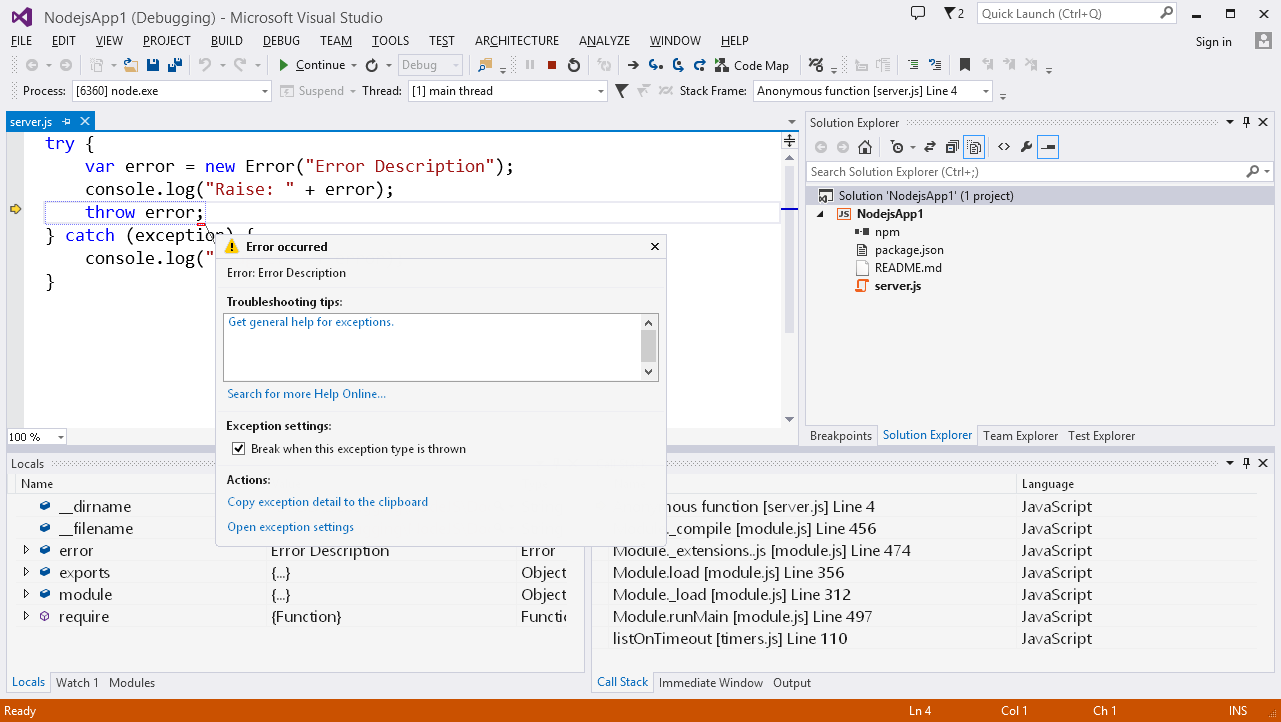
When broken after an exception is hit, the debugger supports the same running state inspection as when broken after stepping, or at a breakpoint (discussed below).
By default, the Node.js debugger breaks on all exceptions, however, the set of exceptions to break on may be modified using the Exceptions window.
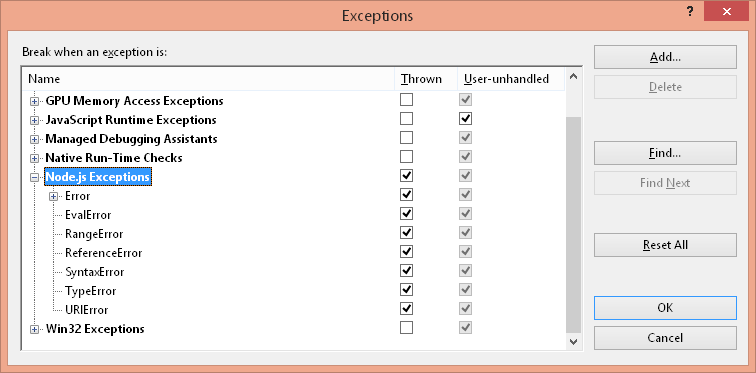
You may bring up the Exceptions window from the "Debug\Exceptions..." menu command.
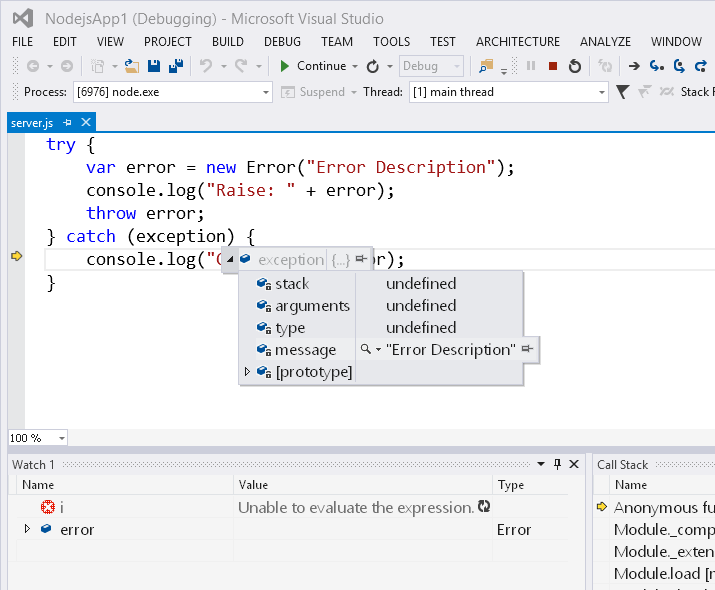
When broken under the debugger, you may use the Locals, Watch, Immediate and Callstack windows to inspect the running state of a debugged app.
The Locals window provides a view of the current stack frame's parameters and local variables. It also allows expanding objects and arrays to see their members by clicking the '>' expansion indicator

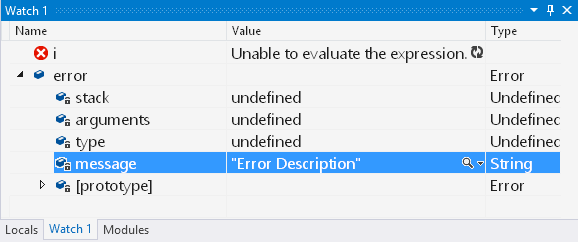
The Watch window provides a view of user defined expressions. Other than only including user added items, it behaves much like the Locals window.
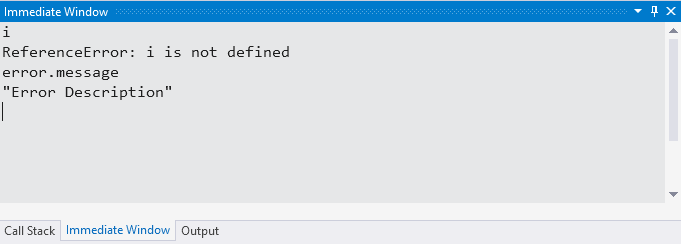
The Immediate window behaves much like a debug REPL in that entered expressions are evaluated against the current stack frame and results are printed.
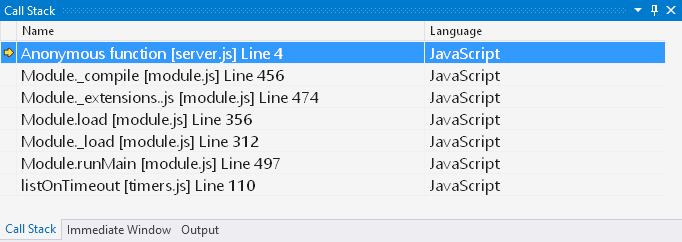
The Callstack window provides a view of the callstack for the "instruction pointer" at which the debugger is broken. You may select the stack frame used as context in the other state inspection windows (Locals, Watch and Immediate) by double clicking on a desired stack frame's name.
It is worth noting that hovering over a valid identifier or selected expression in a Node.js code editor while broken in the Node.js Debugger will provide a popup with results from evaluating the identifier or expression. Like the Locals and Watch window, the evaluation results may be expanded to drill into object and array members.
Edit and Continue feature allows you to make changes to your source code and continue program execution without having to stop and restart the debugging session. To do so, while stopped in the debugger, modify the source code and save your changes. When you resume program execution, your program will continue executing from the beginning of deepest modified stack frame.
For example, in the following application:
var hello = 'Hello';

function appendExclamation(text){
    return text + '!';
}

function appendWorld(text){
    var world = appendExclamation(' world');
    return text + world;
}

console.log(appendWorld(hello));
Put a breakpoint on the return text + '!' line, start debugging (F5) and wait until program execution is stopped at the breakpoint. Then modify the statement return text + world, save changes, and perform a Step Over (F10). You will see that the step will proceed from the beginning of appendWorld function.
To enable or disable the Edit and Continue feature, go to Tools menu and click on Options. In the Options dialog box, expand the Node.js Tools node and set or clear the Enable Edit and Continue check box.
Non-default debugging options may be set from a project's 'General' property page. To access the debugging options, right click on the project in solution explorer and choose 'Properties'.

Here you can override the defaults for the following:
- Node.exe to run
- Command line arguments passed to Node.exe
- Arguments passed to the debugged/run script
- Working directory
- Whether to launch a web browser when launching the debugger
- URL to which to navigate a launched web browser
- Node.js port to use -- Note that this defaults to a generated, available port number
The Alpha release of the Node.js debugger has the following limitations:
- Closed over variables don't show up in the locals window when broken within a closure. As a workaround, you may hover over identifiers for closed over variables in the editor, or add them to the watch window.
- Stepping over "require" of modules with many thrown exceptions (ex. express) is slow when break on exception is enabled. As a workaround, you may disable all NTVS exception "trapping" from the 'Debug\Exceptions' dialog.
- As NTVS does not yet include full support for 'Just My Code', break on exception configuration is restricted to BreakAlways or BreakNever. Given that canned express apps (and derivations) are common and throw handled SyntaxError exceptions, NTVS Alpha has break on exception for SyntaxError set to BreakNever by default. If you would like to "trap" SyntaxErrors while debugging, you may enable them from the 'Debug\Exceptions' dialog.