Support comparison with a reference run #292
Conversation
|
This PR branches off of #288 so will only be merged after that PR has been fulfilled |
|
This PR is intended to address #212 |
|
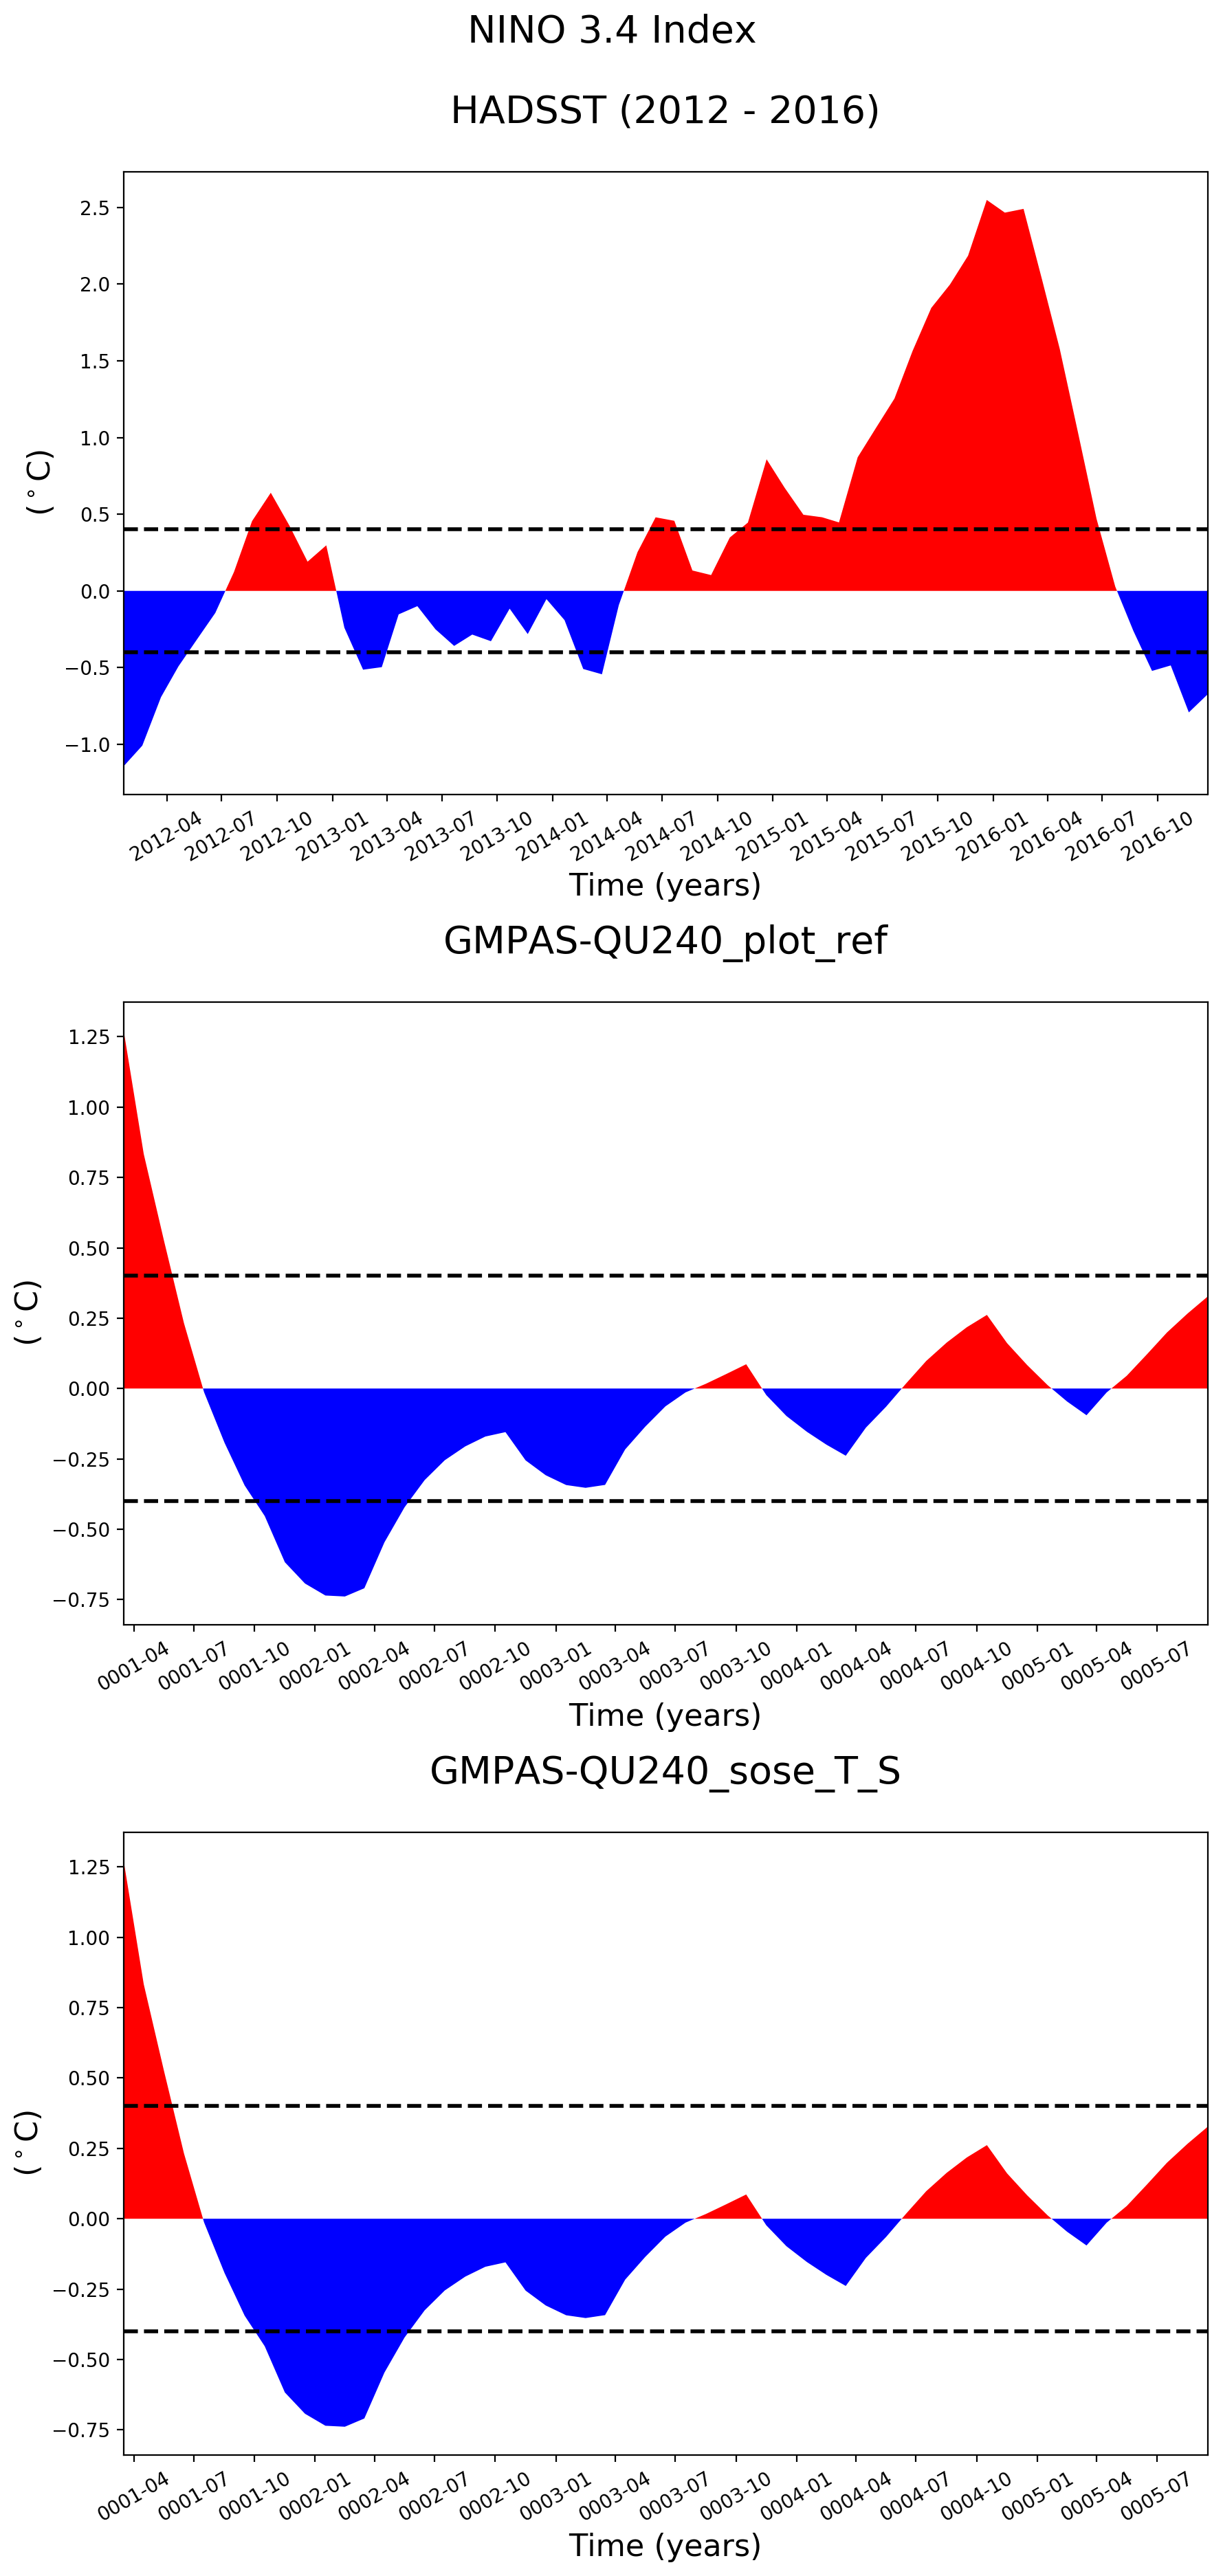
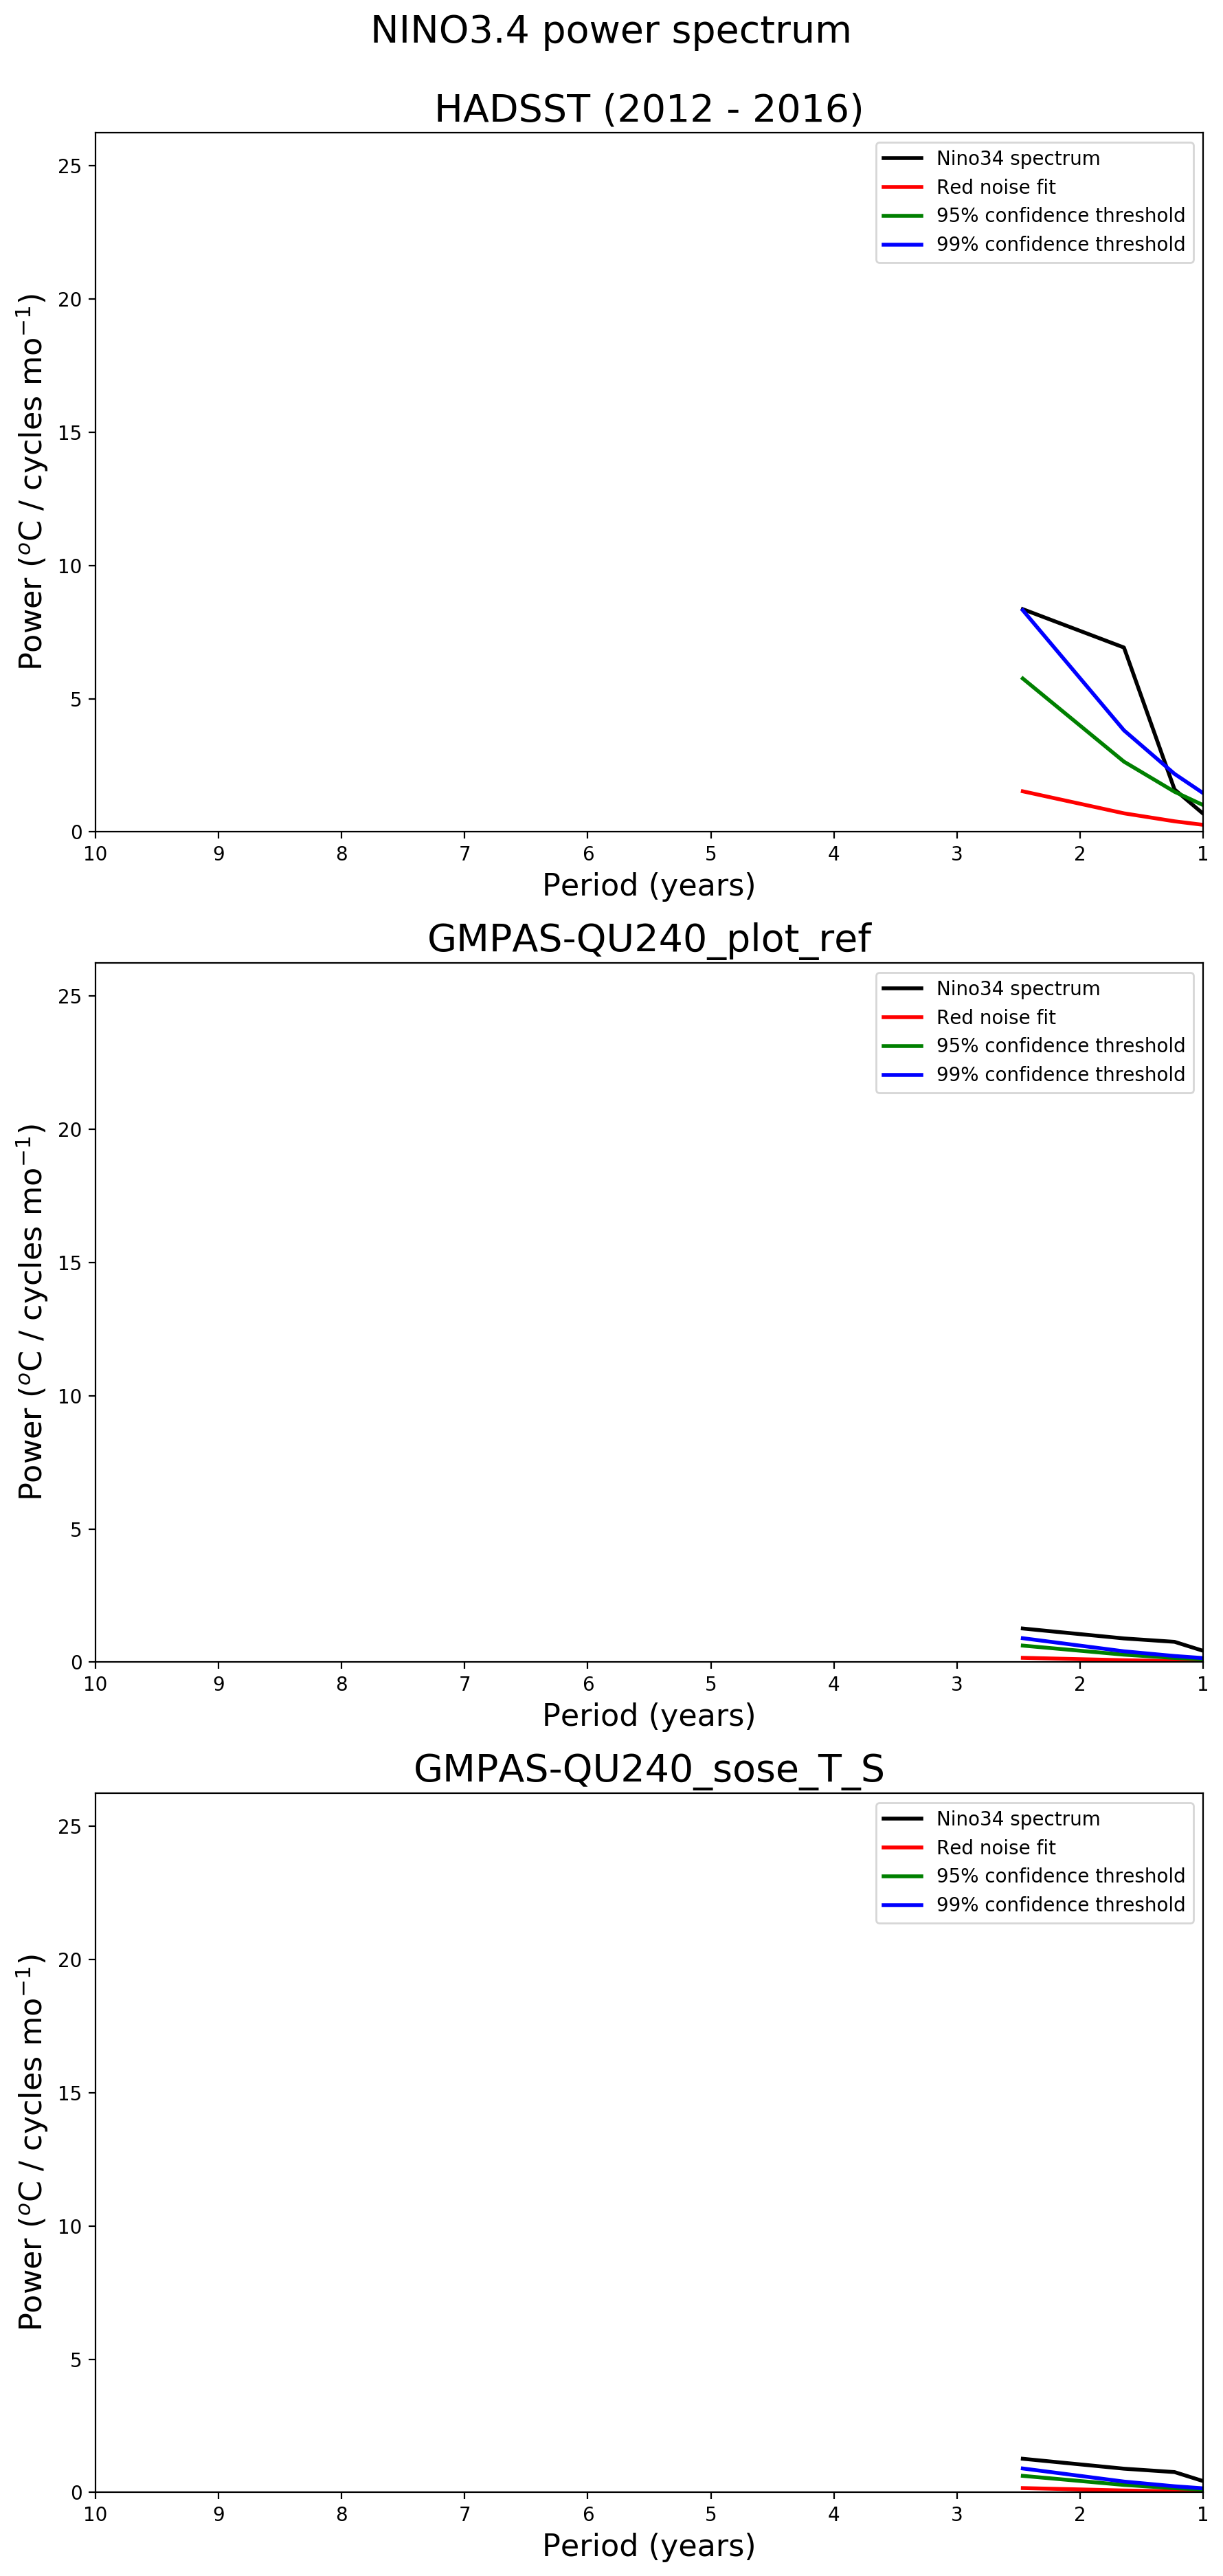
@vanroekel, I would like to discuss with you how best to add a new plot to the Nino34 Index plots. It becomes cumbersome to have 4 plots in a row. Do we want to do 2x2 plots when we include a reference run? Or do we want to remove one or the other of the observations plots? How would you lay things out? |
TestingI tested this with the QU240 run on my laptop and with several EC60to30v3wLI runs on Edison. An example of the latter can be found here: Note: there is a problem with the reference melt rate field -- it appears to be all zeros. I experienced NetCDF errors in Update: the melt problem has been fixed. The HDF5 errors seem to persist. When several tasks are analyzing the same files, the first task seems to be successful but remaining tasks show hdf5 errors like: This could be an issue with Update 2: I switched the approach used to specify the reference run. Now, a config file is specified and the reference analysis must have already been performed in advance. This saves computing the reference climatologies and time series over and over, and also seems to have fixed the issue with file conflicts. This allows a different year range to be specified for the reference run and for the main run (for climatologies, time series and climate indices). This has been tested on the QU240 run. |
5111f25 to
da78bd4
Compare
|
@xylar what would the 4th NINO plot be? Are you thinking 2 OBS, 1 MainSimulation, and 1 REF RUN? Or something else? If you are thinking just Obs + 2 simulations, I would personally lean to removing 1 of the observation plots and retain three plots. Perhaps we could plot the same length of observational record as the simulation (or as close as possible) to eliminate one plot. I don't think we should do a difference plot for NINO34 simulation output against OBS or another run. I don't think we would gain any useful insight and are much more likely to get distracted and/or misled by the direct comparison. |
|
@vanroekel, thanks for the reply
Yes, that's exactly what I had in mind
I think that's a very good idea and shouldn't be too hard. Would you want to do that instead of the 30-year plot in all cases? Or would you want to keep the 3 plots the same as what we currently have if we're not comparing with a reference run?
Oh, I completely agree. Whereas difference plots make sense for climatologies, I wasn't planning on doing them for any time-series fields. |
3357481 to
cde31e8
Compare
|
@vanroekel, I added new panel for the reference run as follows (this is obviously too short and low res a run to get a proper feel for these plots). First panel is obs, second is the main run, 3rd is the reference run. I'm going to add text "Reference run: " before the last plot, just to make things clearer: I'll post an example with a longer time series once I have one. |
cde31e8 to
66ef5ad
Compare
|
This branch now also depends on #293 and will only be merged after that PR. |
41aebdf to
5ce69c7
Compare
ce8e0d5 to
a20ca29
Compare
|
@xylar: what does this PR need, besides some testing? can it still be considered WIP? |
|
@milenaveneziani, yes, feel free to test it out. Since it's based off of #294, you'll need a python environment with xarray>=0.10.0. @stephenprice, as you have time, could you see if this will work for you as well? You'll need to use the acme-unified/1.1.2 environment on Edison. Run the analysis on some reference run. Then, point the analysis for the config file for the reference run via the |
a20ca29 to
331998c
Compare
The task now takes an optional task that remaps a reference run
instead of observations.  Support has also been added for having
neither a reference run nor observations (e.g. for plotting
climatologies where no observation are available and no reference
run has been specified).
The task now takes an optional task that remaps a reference run
instead of observations.  Support has also been added for having
neither a reference run nor observations (e.g. for plotting
climatologies where no observation are available and no reference
run has been specified).
All climatology and time series tasks except MOC now can be plotted
against a reference run.

Support for plotting the MOC against a reference run is not likely
to be supported.
This also requires writing out the aggregated melt time-series data
set, so that this data set can simply be read in from the reference
run.  Because it is easy to include, this merge also loads the
time series data for the main run if the data has already been
cached.
Also add a few other items missed by recent commits
Instead, use the ref config. file toa construct file names without
the need for subtasks.  This removes any need for the reference
simulation data to exist; only the analysis results are required.

funcitons for constructing unmasked, masked and remapped MPAS file
names have been added to shared.climatology.  These functions are
now used in the associated climatology tasks/subtasks.

All tasks that support plotting reference data have been updated
with this change.

The documentation has also been updated.
This is needed so it can be read back in from the reference run
without needing the mesh from the reference run.
The MHT latitude bins, depths and climatology are stored in a file
so these can be read back in for a reference run.
It is commented out but it (hopefully) makes clear how one would
point to a reference run.
This allows comparison between runs with different vertical coordinates
Also, print message that reference analysis should already have
been run (if a ref config file is specified).
e429077 to
00cb6a6
Compare
|
@xylar finally testing this now. I've successfully done a comparison between different years of the 18to6. I want to test a comparison with low res and high res and will approve if that goes well (should be done this morning). One minor suggestion / request. When this feature is used to compare different years in the same run it is hard to know which time period is which on the time series plots e.g. |
|
@vanroekel, thanks for your testing. My suggested solution to the case you show above would be to change mainRunName to be different in your 2 config files (e.g. appending _main and _ref or the year range). This is what I have done in my testing. In fact, you could just name the runs "main" and "ref" if you wanted. |
|
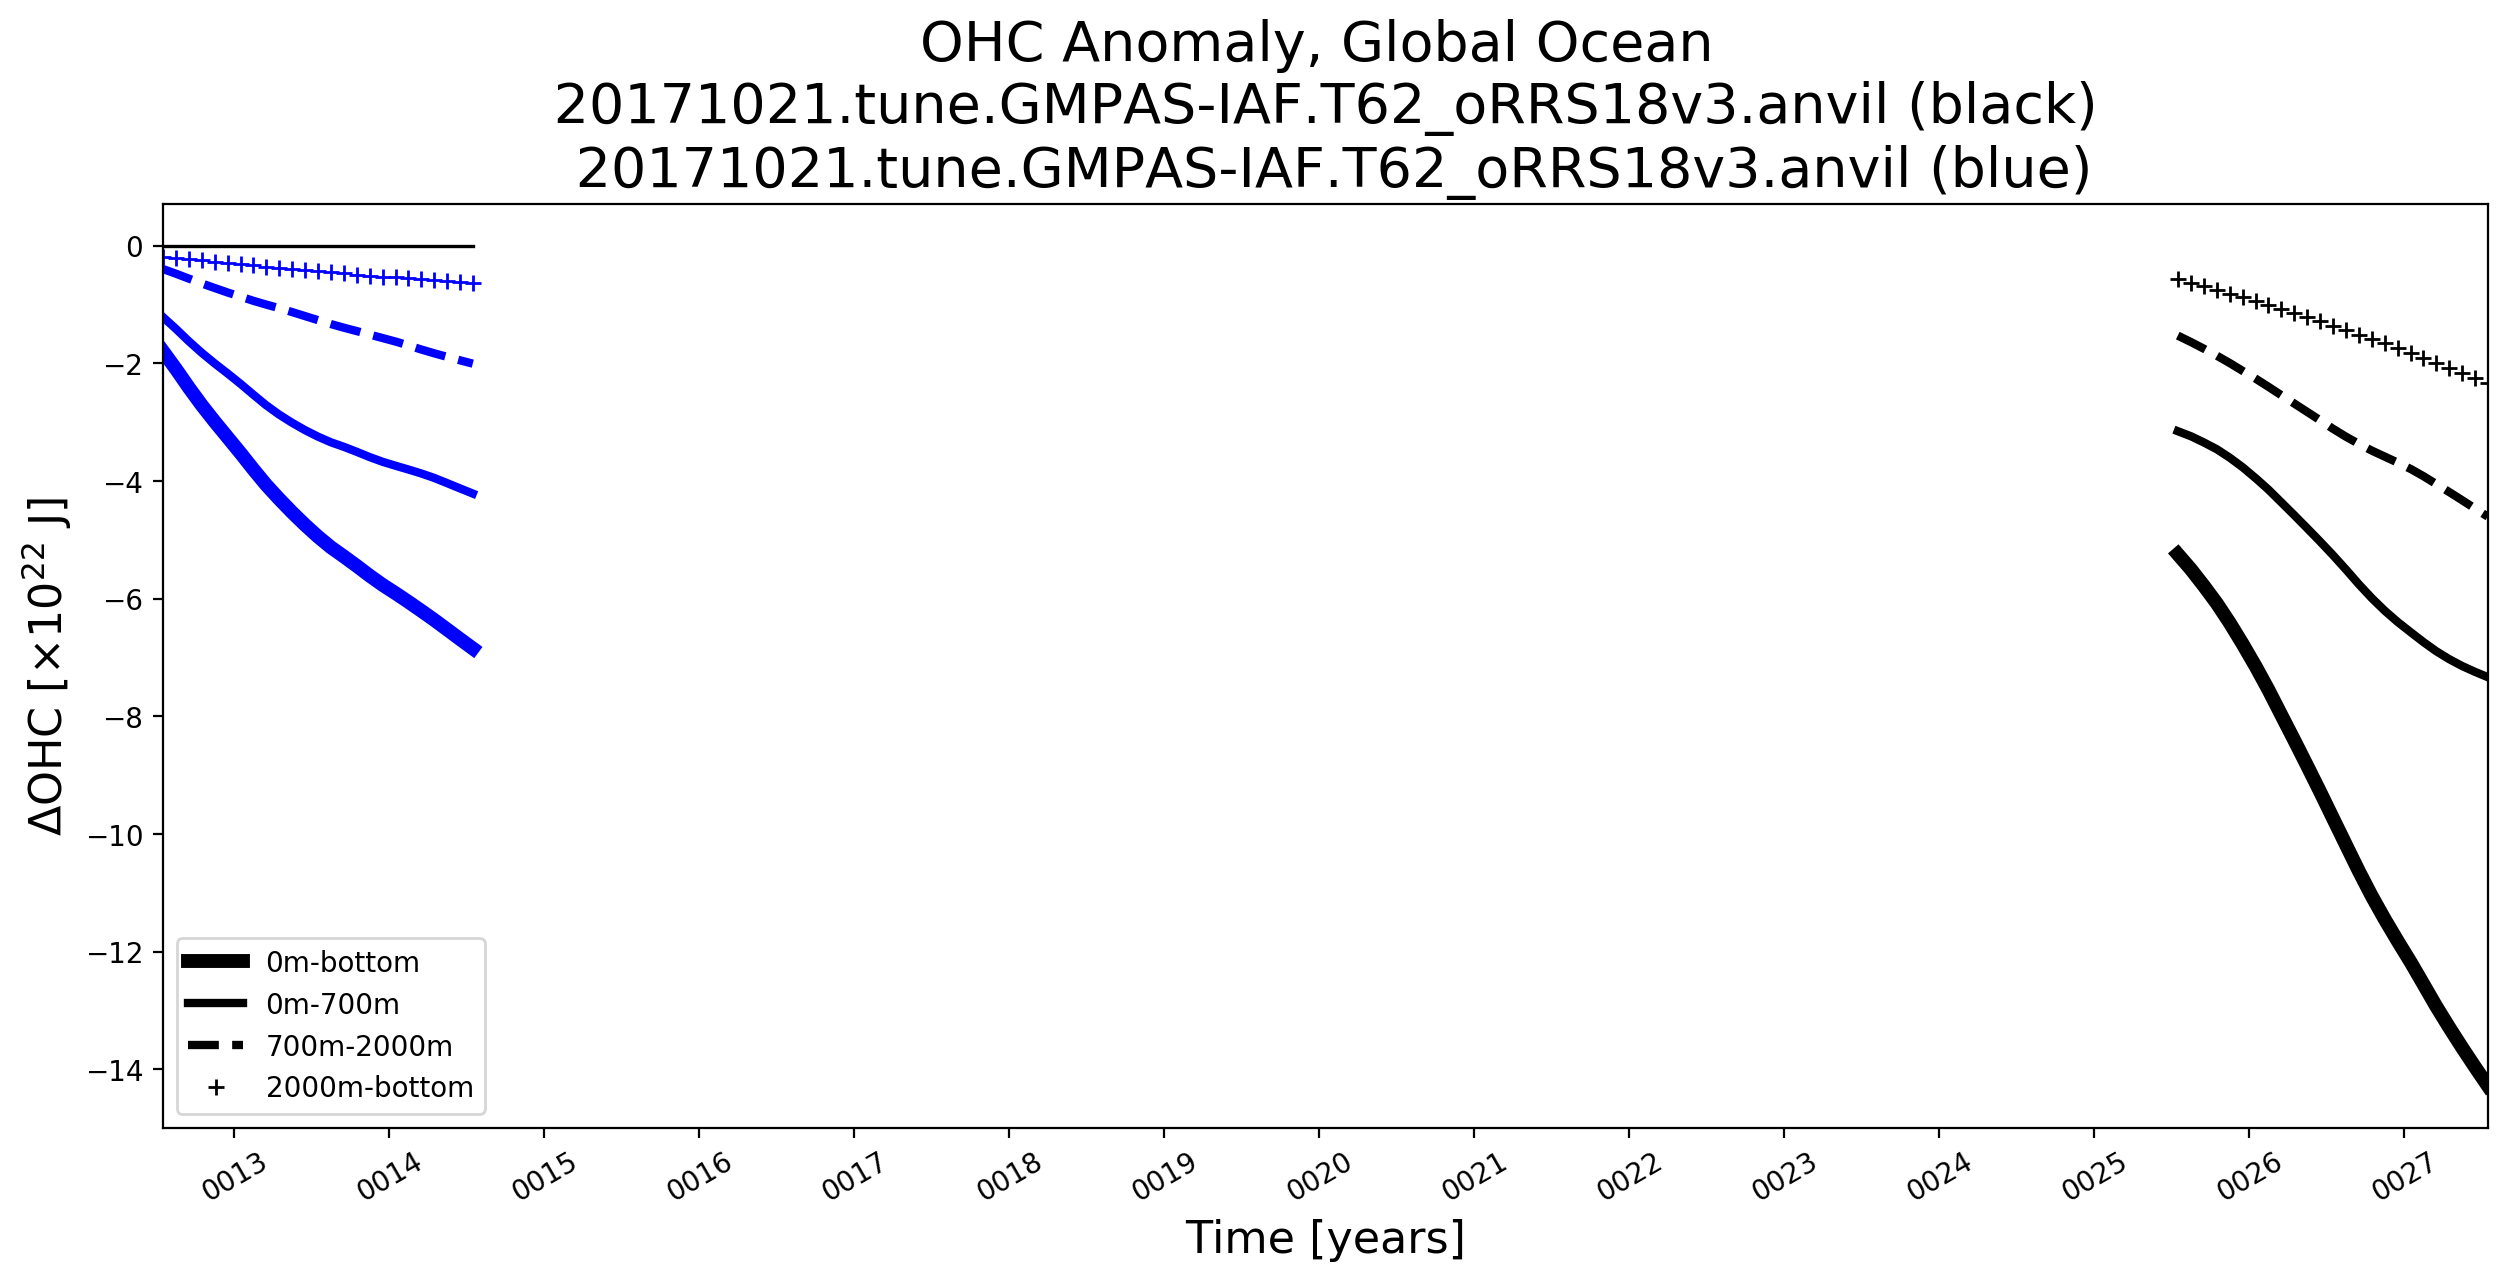
By the way, that OHC plot looks really strange. I'm worried something has gone wrong with the computation. |
|
@xylar thanks for the great suggestion, makes perfect sense. As for the OHC plot, you are right. It is odd the zero line doesn't move across the whole plot and it also looks like the black lines may be on a different vertical scale when compared to previous OHC plots of this run. I'll take a look. |
|
I believe the problems with the OHC plot are unrelated to this PR but they should be posted as an issue and get fixed. If you can just post the plot and give some basic info (e.g. which years you used for each time series), that should help me debug. |
|
all tests went well. I can post an issue on the odd OHC plot above. Thanks @xylar! |
|
Thanks for testing, @vanroekel! Much appreciated. |
This merge adds the capability to compare the output of a simulation against a reference simulation.
In the case of climatologies, the comparison with the reference run is performed instead of the comparison with observations (or state estimates, reanalyses, etc.).
In the case of time series, an additional plot is added for the reference run.
Notes:
The reference run is specified through the
[runs]/referenceRunConfigFileoption, which points to a config file describing analysis that must have already been performed on the reference run. This saves computing the reference climatologies and time series again and again if the same reference run is used several times. (It also seems to fix some NetCDF/HDF5 errors I encountered when trying to compare several runs at once to the same reference run.) Additionally, the reference config file can specify a range of years for the climatology and/or time series that differs from the main run.The startYear and endYear for climatologies, time series and indices in the reference config file must be the actual range that was used to compute them. Otherwise, the results may not be found correctly or the results may not plot correctly. One way to make sure this is the case is to use the config file saved to the
logsdirectory in when the reference analysis is performed.