Finalize assignments: Chapter 20. HTTP/2 #22
Comments
|
Hey @mnot, Paul says he reached out to you and you may be interested in being the designated subject matter expert for the H2 chapter. You can learn more about the Almanac project here. Let me know if you have any questions about the time/deliverable expectations and if you're able to commit. |
|
I’m happy to help out here if you need help in this section? Just published a book on HTTP/2 (https://www.manning.com/books/http2-in-action) so spent last couple of years digging into this topic and what it’s meant in real world since launch. I don’t know HTTP Archive or BigQuery though, but know SQL very well so sure I can learn it with a few pointers in the right direction. Or just help interpret the results others serve up, or review writing or whatever. |
|
Hey @bazzadp thanks for reaching out, we'd love to have you! Sounds like you're a great fit for the subject matter expert role, driving the direction of the metrics included in the chapter and writing your interpretations. I'll put your name down. |
|
Potential metrics (just rough thoughts for now but will update):
Also some stats here for validation that in right ballpark: https://http2.netray.io/stats.html but obviously as an HTTP Archive report we should use HTTP Archive stats. |
|
That's a great list, big +1 to everything. @pmeenan could you help answer some of Barry's questions? (also let us know if you'd be interested in reviewing this chapter)
Did you have something in mind to weigh adoption by traffic? The HTTP Archive dataset doesn't currently include popularity signals. |
|
And there's where my lack of HTTP Archive knowledge comes into play! :-) This shows sites: https://w3techs.com/technologies/details/ce-http2/all/all So you can say 60% of web traffic is HTTP/2 but that's dominated by the big boys. Or you can say 35% of sites are HTTP/2. Both are correct but depends what metric you want. This is something that probably should be decided at a project level as will affect all other chapters too. And if, as you say, HTTP Archive only has one then that's an easy question to answer! But that begs the next question (also a project level question): should we just use HTTP Archive stats? Or also include other stats like the two examples above? I can understand if want to just use HTTP Archive but thought I'd ask the question in case artificially limiting myself here! |
|
Great questions.
Let's stick with "% of websites" or "% of all requests". We include a chart of the latter in our State of the Web report on the website.
I'd say let's exhaust all of the stats we can extract from the HTTP Archive dataset first, and if we still can't paint a complete picture, then it makes sense that we should pull in outside research and cite it accordingly. Things like % of sites vs traffic are just matters of perspective, but if we're missing out on a key metric then that's worth outsourcing. |
|
Just a note on the "say 60% of web traffic" @bazzadp: that's 60% of all browser traffic. It might be worth considering that HTTP/2 is only ever attempted when doing HTTPS, which is now on around 80% of the browser page loads so that makes the amount of HTTPS loads done by Firefox that uses HTTP/2 to be 75%. |
|
Sounds great, I've added @bagder and sent an invitation to the @HTTPArchive/reviewers team. |
|
You’ve a typo in his username: @bagder Am sure he gets this a lot - I know I’ve mistyped it like that before! :-) |
|
I'm mr typo. 😁 |
|
Hah! That explains the autocomplete fail :) |
|
Back in Jan about 26% of the traffic over Akamai's network was H2 - https://developer.akamai.com/blog/2019/01/31/http2-discover-performance-impacts-effective-prioritization |
|
regarding "Average number of domains per site going down?", I know HTTParchive already tracks number of TCP connections needed, which is of course more a result of number of domains used and/or HTTP/2-"unsharding" of them. |
I was wondering why so low? As would have expected CDN traffic to be ahead of average not behind assuming it’s on my default for HTTPS users. But I see they only enabled that since March (https://blogs.akamai.com/2019/03/http2-will-be-automatically-enabled-by-default-on-the-akamai-intelligent-edge-platform.html). Wonder what that percentage is now since that change? |
|
I am also interested in acting as a reviewer for this chapter :) |
I think the "alt-svc" response header is the only thing we capture that can help with this (at least without processing the raw trace files). The ALPN details for a connection aren't kept though it might be possible to add later.
You might be shocked and dismayed because of the automatic translation from "preload" response header to PUSH, it happens WAY more often than I'd like. It may be a small overall * of sites but would be interesting to deep dive into the distribution of number of pushed resources and bytes for those that do use push.
No, not currently anyway.
As in number of slots available or something else? For the ALPN and H2 settings that might be of interest, if you file an issue with wptagent I may be able to add the connection-level protocol details (or at least whatever I can extract from the netlog). |
|
I just added a few connection-level fields to the WebPageTest data collection. They will only be reported for the first request on a given connection (same request that has the connect timings): The June 1 crawl will include the data. I didn't see any other TLS or H2 session-level settings exposed in the netlog but hopefully this helps. |
If the netlog included the raw HTTP/2 frame events I could calculate the size of the HEADERS frame relative to the decoded headers but looking through the raw netlog events it doesn't look like it does. At best I could infer it from the socket bytes events right beside it but that may include other frames as well and feels too fragile. |
|
It looks like this is in good hands; I'm going to put some suggestions in a few other places. |
|
Thanks @mnot! You're still welcome to contribute to this chapter as a coauthor or reviewer if interested. |
|
Definitely! Or if you've any thoughts on what stats to measure then let us know. |
|
Happy to be added as a reviewer. |
|
Thanks @dotjs! Happy to add you as a reviewer. Is your first/last name public anywhere? |
|
Yes, Andrew Galloni - Updated my profile |
|
👍 👍 Thanks! |
|
I've updated the stats to the following:
The current HTTP Archive State of the Web lists mobile and desktop but think only the number and bytes pushed should differ between mobile and desktop. Any other suggestions from anyone? Particularly the reviewers (@bagder , @rmarx , @dotjs)? @rviscomi , @pmeenan - can you see any of these being a problem? Note sure I'll use all of these, depending on whether they show interesting information or not, so if any are particularly hard to get, or there's too many stats, then let me know. |
Server push
HPACK
|
|
Capturing the mix of h2 and h1 on a single page load would also be interesting, as would the total number of connections per page load in relation to that. |
Not familiar with server push or how it appears in WPT results. Two questions:
To complicate things, we've been increasing our sample size ~8x since last year, so many of of the sites in today's dataset were not available last year. So this metric might not be reliable. |
|
Incorporated some of these. @dotjs some comments ion yours:
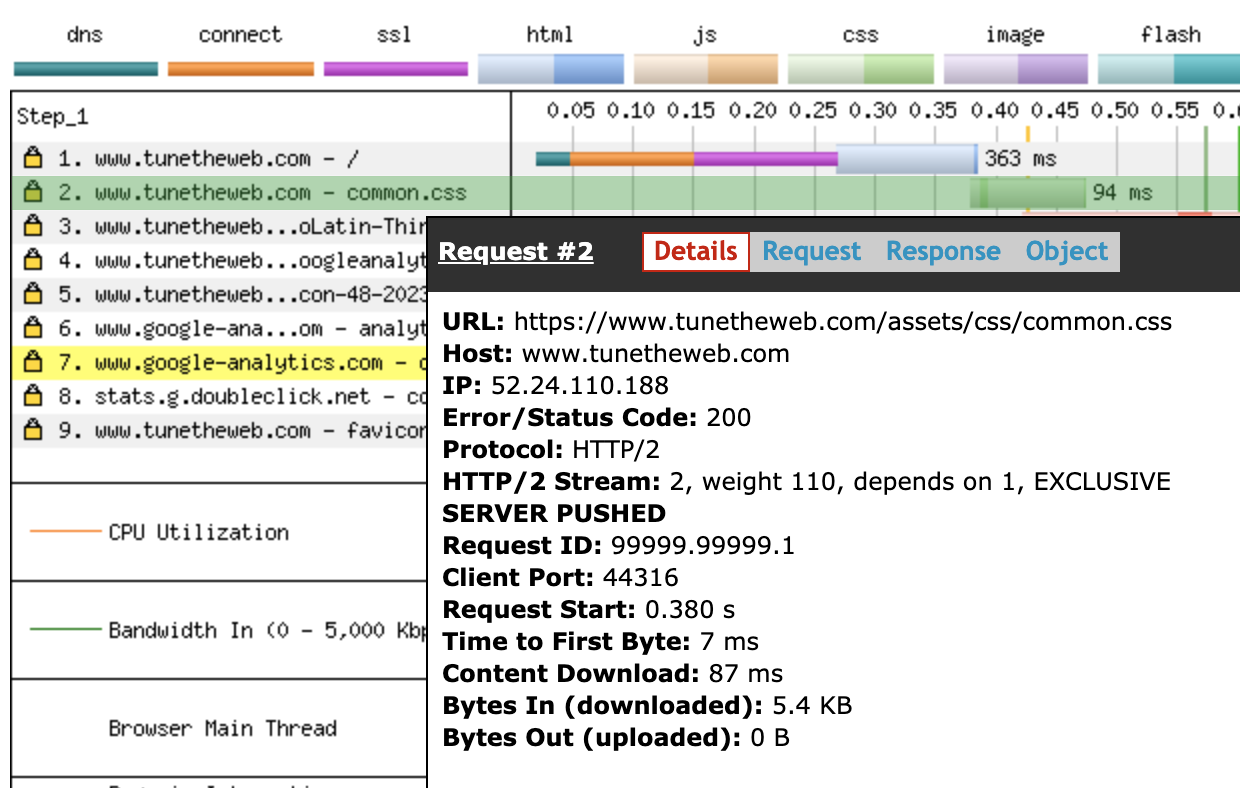
@rviscomi, a pushed resource has a "SERVER PUSHED" attribute in WebPageTest as shown below.
When a client uses a pushed resource it sets the Initiator to "Push/Other" in Chrome Dev tools Network tab:
When an asset is pushed that is NOT actually needed by the page, it doesn't show in Dev Tools Network tab at all (but is hidden in the net-externals page). Though this is complicated if the preload header is used (which is often also used as a signal to push). In this case the very presence of the preload header means Chrome thinks it is needed by the page and so does show it in the Network tab. Sigh it's complicated... WebPagetest seems to always show pushed resources (whether preload header is included or not), but can't see any way it indicates if an asset is pushed, but then not subsequently referenced on the page. @pmeenan not sure if you've any thoughts on whether possible to measure unnecessarily pushed resources? |

|
I was considering the encoding table sizes. For nginx there is a patch that sets the default table size to 4096 https://github.com/cloudflare/sslconfig/blob/hpack_1.13.1/patches/nginx_1.13.1_http2_hpack.patch |
|
@bazzadp thanks for the context. It sounds like detecting unused pushes should be possible using the resource metadata in HTTP Archive.
So we can check for resource that have been pushed but not initiated or preloaded. @pmeenan does this sound accurate? |
Yeah, as I say I was aware of that and so I tested that on an unpatched Nginx, expecting a table size of 0 in the initial connection settings but didn't see that. I presume therefore that, without this patch, Nginx handles indexed headers on incoming requests, but just doesn't use them on responses? If so there is no need to explicitly set a table size of 0 if it never uses "indexed header" type in responses, which would explain my observations: the table size is left at the default but just never used for responses. Which means it is not possible to measure this metric (though I agree it would be a good one if we could!). There's a lot of assumptions in there, so happy to be proven wrong if someone actually knows this or can explain it better? |
Excellent if that's the case! I've left that in there as one of the metrics. So that list in the first comment is all I can think of, so have marked the "Finalise metrics" tickbox as done. If anyone has any other comments or suggestions in next few hours (or even if after!), then let us know. @rviscomi should I close this issue? |
|
Woohoo, I think you're the first author to finish your metrics (even before me! 😅). Yes, we're ready to close this issue. Next step will be for the analysts to review your metrics more carefully. That process will happen on the HTTP Archive discussion forum at https://discuss.httparchive.org. For now, it would be great for you to create an account there if you haven't already so we can @ you in the discussion if needed. I'll also be creating a new tracking issue (and corresponding spreadsheet) to monitor the progress of each metric, which I'll share with you and tag you in when ready. |
Done. My username in there is "tunetheweb". Probably should change my GitHub username too to match what I more commonly go by nowadays, but have it referenced in a few places so would prefer not to. Hope it doesn't cause too much confusion! |
|
Hi @paulcalvano, just had a nosey at how you were getting on triaging these metrics and wanted to clarify a few stats that you currently have down as Not feasible/Needs more info:
Badly worded on my part so have reworded in first comment above: #22 (comment). I meant the negotiated version for all home pages crawled and not necessary all the versions supported by that page/site (I presume we will negotiate maximum supported version and every site will support all versions beneath the negotiated version with the possible exception of 0.9). See the example table I created to show what I'm looking for:
As you can see I don't list that HTTP/1.0 is probably supported by 100% of sites but only the 2% of sites that negotiate using that (these are totally made up stats btw but don't think they will be too far off). It's somewhat similar to the first stat requested (the adoption of HTTP/2 over time) but also looks at sites on older versions of HTTP and newer version (QUIC), and I also wanted to look at HTTP/2 usage by HTTP versus HTTPS. I just didn't want to cloud the first stat graph with all that noise hence why I put these in a separate second stat. As per above example table, I suspect most will be HTTP/1.1 or HTTP/2 with a smaller number on gQUIC. Mozilla telemetry suggests some sites still use HTTP/1.0 but they might be internal sites or assets rather than main page so wouldn't be surprised if they don't show in our stats at all. And I don’t expect any to use HTTP/0.9.
Yeah this one wasn't mine but would be interesting to know. Maybe just list HTTP/2 sites by top CDNs (similar stats to 17.1 and 17.2?) and then can manually vlookup based on the known bad ones from Andy's github listing? Not sure how we know if a site is server by a CDN (server header? IP address range?) but if you can get it for the CDN chapter in stats 17.1 and 17.2 then presume there is some way :-)
Fair enough thought this one might be difficult. There were some comments above in #22 (comment) but it sounds tricky to be honest so happy to skip.
@pmeenan added this stat as per #22 (comment) above so stats should be in June crawl. Note if this value is not explicitly set at connection set up like in that example, then it defaults to unlimited so will need to account for that. Also this stat should only be captured for HTTP/2 sites. Hope that clarifies some things and allows us to get some more of these. Give me a shout if anything is not clear. And off course if they are still too difficult to get them can live without them. Thanks, |
|
For the prioritization issues, WebPageTest runs it's CDN detection as part
of the crawl and should get pretty good coverage. One possible issue will
be what origin(s) to look at for a given page? Just checking the pages
origin is probably safest but will miss the cases where the static content
is served by a different CDN (like all of shopify for example).
…On Mon, Jun 24, 2019 at 6:26 PM Barry Pollard ***@***.***> wrote:
Hi @paulcalvano <https://github.com/paulcalvano>, just had a nosey at how
you were getting on triaging these metrics and wanted to clarify a few
stats that you currently have down as Not feasible/Needs more info:
20.2 - Measure of all HTTP versions (0.9, 1.0, 1.1, 2, QUIC) for main page
of all sites, and for HTTPS sites. Table for last crawl.
*We can only see the negotiated protocol, not all of the versions
supported.*
Badly worded on my part so have reworded in first comment above: #22
(comment)
<#22 (comment)>.
I meant the negotiated version for all home pages crawled and not necessary
all the versions supported by that page/site (I presume we will negotiate
maximum supported version and every site will support all versions beneath
the negotiated version with the possible exception of 0.9). See the example
table I created to show what I'm looking for:
Version All sites HTTPS only sites
HTTP/0.9 0% 0%
HTTP/1.0 2% 0%
HTTP/1.1 48% 20%
HTTP/2 44% 70%
gQUIC 6% 10%
As you can see I don't list that HTTP/1.0 is probably supported by 100% of
sites but only the 2% of sites that negotiate using that (these are totally
made up stats btw but don't think they will be too far off). It's somewhat
similar to the first stat requested (the adoption of HTTP/2 over time) but
also looks at sites on older versions of HTTP and newer version (QUIC), and
I also wanted to look at HTTP/2 usage by HTTP versus HTTPS. I just didn't
want to cloud the first stat graph with all that noise hence why I put
these in a separate second stat.
As per above example table, I suspect most will be HTTP/1.1 or HTTP/2 with
a smaller number on gQUIC. Mozilla telemetry suggests some sites still
use HTTP/1.0
<https://telemetry.mozilla.org/new-pipeline/dist.html#!cumulative=0&measure=HTTP_RESPONSE_VERSION>
but they might be internal sites or assets rather than main page so
wouldn't be surprised if they don't show in our stats at all. And I don’t
expect any to use HTTP/0.9.
20.7 - % of sites affected by CDN prioritization issues (H2 and served by
CDN).
*Not sure if this is possible with HA data.*
Yeah this one wasn't mine but would be interesting to know. Maybe just
list HTTP/2 sites by top CDNs (similar stats to 17.1 and 17.2?) and then
can manually vlookup based on the known bad ones from Andy's github
listing
<https://github.com/andydavies/http2-prioritization-issues#cdns--cloud-hosting-services>?
Not sure how we know if a site is server by a CDN (server header? IP
address range?) but if you can get it for the CDN chapter in stats 17.1 and
17.2 then presume there is some way :-)
20.14 - Is it possible to see HTTP/2 Pushed resources which are not used
on the page load?
*We only see the resources that were used in HA data since rejected push
promises are not logged in the network panel.*
Fair enough thought this one might be difficult. There were some comments
above in #22 (comment)
<#22 (comment)>
but it sounds tricky to be honest so happy to skip.
Count of HTTP/2 sites grouped by SETTINGS_MAX_CONCURRENT_STREAMS
(including sites which don't set this value). Once off stat for last crawl.
*We don't have H2 frame data*
@pmeenan <https://github.com/pmeenan> added this stat as per #22 (comment)
<#22 (comment)>
above so stats should be in June crawl. Note if this value is not
explicitly set at connection set up like in that example, then it defaults
to unlimited so will need to account for that. Also this stat should only
be captured for HTTP/2 sites.
Hope that clarifies some things and allows us to get some more of these.
Give me a shout if anything is not clear. And off course if they are still
too difficult to get them can live without them.
Thanks,
Barry
—
You are receiving this because you were mentioned.
Reply to this email directly, view it on GitHub
<#22?email_source=notifications&email_token=AADMOBMXTRKFT2GOSICD6YTP4FCX7A5CNFSM4HOOMKG2YY3PNVWWK3TUL52HS4DFVREXG43VMVBW63LNMVXHJKTDN5WW2ZLOORPWSZGODYONAGA#issuecomment-505204760>,
or mute the thread
<https://github.com/notifications/unsubscribe-auth/AADMOBIBZJ6E3ZPNGUSBDH3P4FCX7ANCNFSM4HOOMKGQ>
.
|
This is based on identifying the CDN via these server headers being set I presume? Was always curious how this worked!
Yeah think best we can probably do is test the website home page and accept it's not 100% accurate. Trying to figure out the "most used CDN" for a web page to identify the shopify scenario is probably overly complicated. |
|
The headers are a fallback. Main method is the CNAME mappings right above
that (and reverse-IP lookup).
…On Mon, Jun 24, 2019 at 7:37 PM Barry Pollard ***@***.***> wrote:
For the prioritization issues, WebPageTest runs it's CDN detection as part
of the crawl and should get pretty good coverage.
This is based on identifying the CDN via these server headers
<https://github.com/WPO-Foundation/wptagent/blob/master/internal/optimization_checks.py#L197>
being set I presume? Was always curious how this worked!
One possible issue will be what origin(s) to look at for a given page?
Just checking the pages origin is probably safest but will miss the cases
where the static content is served by a different CDN (like all of shopify
for example).
Yeah think best we can probably do is test the website home page and
accept it's not 100% accurate. Trying to figure out the "most used CDN" for
a web page to identify the shopify scenario is probably overly complicated.
—
You are receiving this because you were mentioned.
Reply to this email directly, view it on GitHub
<#22?email_source=notifications&email_token=AADMOBLHDJL2KPBZVZNEOKLP4FLDVA5CNFSM4HOOMKG2YY3PNVWWK3TUL52HS4DFVREXG43VMVBW63LNMVXHJKTDN5WW2ZLOORPWSZGODYOQ3ZI#issuecomment-505220581>,
or mute the thread
<https://github.com/notifications/unsubscribe-auth/AADMOBN3ZX6HUW45ZNTCGBDP4FLDVANCNFSM4HOOMKGQ>
.
|
Due date: To help us stay on schedule, please complete the action items in this issue by June 3.
To do:
Current list of metrics:
For gQUIC it will be sites that return
Alt-SvcHTTP Header which starts withquic.upgradeHTTP header containingh2. Once off stat for last crawl.upgradeHTTP header containingh2. Once off stat for last crawl.upgradeHTTP header containingh2. Once off stat for last crawl.serverHTTP header value but strip version numbers (e.g. Apache and Apache 2.4.28 and Apache 2.4.29 should all report as Apache, but Apache Tomcat should report as Tomcat. Probably need to massive the results to achieve this). Once off stat for last crawl.serverHTTP header value but strip version numbers. Once off stat for last crawl.SETTINGS_MAX_CONCURRENT_STREAMS(including HTTP/2 sites which don't set this value). Note this was added recently as per Finalize assignments: Chapter 20. HTTP/2 #22 (comment). Once off stat for last crawl.👉 AI (@bazzadp): Finalize which metrics you might like to include in an annual "state of HTTP/2" report powered by HTTP Archive. Community contributors have initially sketched out a few ideas to get the ball rolling, but it's up to you, the subject matter experts, to know exactly which metrics we should be looking at. You can use the brainstorming doc to explore ideas.
The metrics should paint a holistic, data-driven picture of the HTTP/2 landscape. The HTTP Archive does have its limitations and blind spots, so if there are metrics out of scope it's still good to identify them now during the brainstorming phase. We can make a note of them in the final report so readers understand why they're not discussed and the HTTP Archive team can make an effort to improve our telemetry for next year's Almanac.
Next steps: Over the next couple of months analysts will write the queries and generate the results, then hand everything off to you to write up your interpretation of the data.
Additional resources:
The text was updated successfully, but these errors were encountered: