Conversation
|
Just pushed a new commit which adds the interactive slider chart to the Arc page, see https://binste.github.io/altair-docs/user_guide/marks/arc.html :) Quite excited that it works, I think it's a very handy feature :) What do you think of the approach? I pulled the vega-lite specification from their documentation and load it from a separate file with the Once I know the final approach to take, I'll add it to the remaining pages. |
|
Wow it is indeed exciting to have the sliders working in the Altair docs! It might take me some time to review this PR properly, but my initial comments on the approach is that it makes sense. Did you copy/paste the vega-lite example or download it programmatically? It would be great if we would only need to keep track of the filenames for the examples in the vegalite docs/repo and pull down the latest version of them whenever the docs are built. I agree with you that the new CSS looks better but is messes with how things look in the interactive Altair examples by centering the widgets and styling them in a way that will look different from what people would see when they run Altair on their own machines. Is is possible to apply this style tweak to only marks section? I think we could target the individual pages at least, even if there is no single css tag for the entire section. |
|
A few non-substantive comments: I also like it how you render VL-specs directly to make the docs more interactive. I think it is fine to keep these VL-specs defined within the Altair repository. Maybe the VL repository will soon introduce new things that Altair cannot render yet or we like to emphasize something different. To continue on the last bit, it would be better if these VL specifications are Altair derived. In that case we can add a hyperlink below with "view Altair example" (like the "view in editor" at the VL-repo). The location of these Altair specifications is open for discussion, maybe in the interactivity section on the example page? Or in the doc-page of the parameters? Or somewhere else? |
|
To summarise, based on your feedback I see the following 3 approaches we could take to include the interactive sliders:
I can see the advantages of having these slider plots as Altair code. However, translating the code will take quite some time and I'm not familiar with creating or adapting Sphinx directives. In general, I'd like to get to the release of version 5 as quickly as possible to make all the great new features and the improved documentation available for everyone. I'd therefore suggest to go with option 1 for now as it will be fairly quick for me to implement. This would allow me to switch to tackling the creation of individual pages for each encoding as well which would be great for the release of version 5. I could create an enhancement issue stating that these examples could be converted to Altair code. What do you think? |
|
@mattijn @joelostblom I haven't been following the docs updates so I don't know how much would be involved, but I'm happy to try to help with translating from the Vega-Lite code to Altair code if you think that would be feasible/worthwhile. |
|
That would be great @ChristopherDavisUCI! If you can prepare the Altair code for these mark-doc examples, that would be nice. I tried a bit as well, but I did not succeed in the arc example. I'd some errors that I could not get rid off. |
|
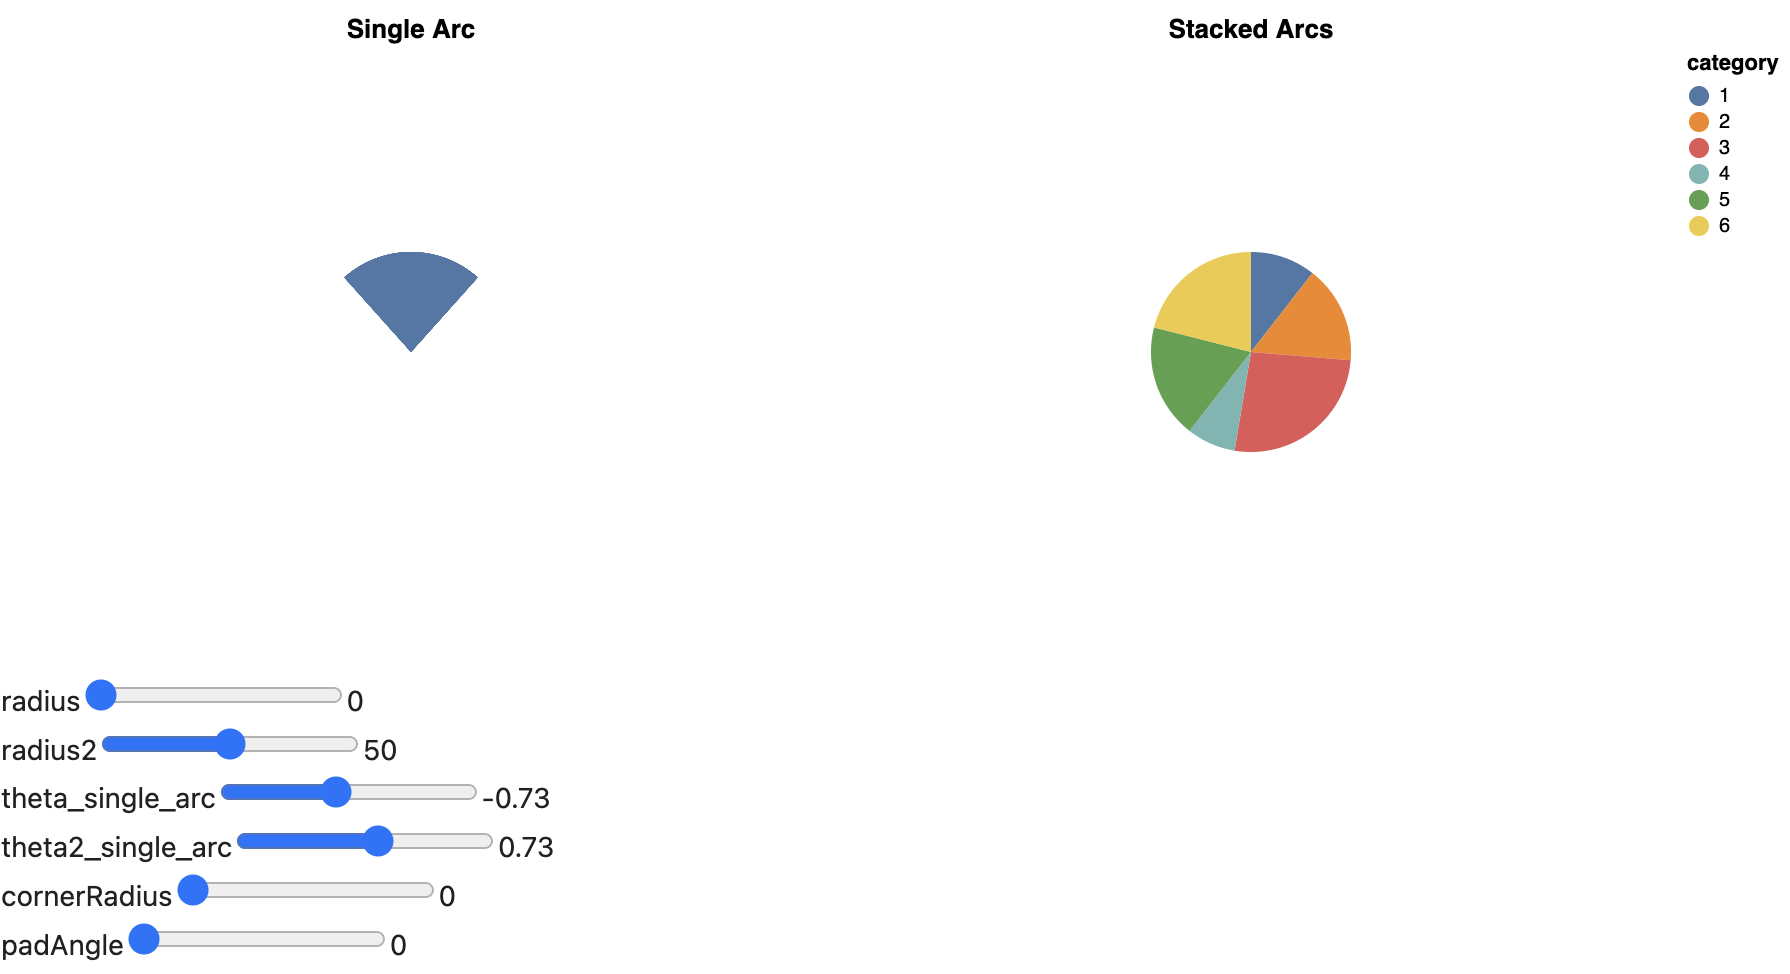
Does this look essentially correct? The layout of the sliders doesn't seem as nice, but I don't know if that is some trick in the documentation or something I should be doing in the Altair code: import numpy as np
import pandas as pd
import altair as alt
rad_slider = alt.binding_range(min=0, max=100, step=1)
rad_var = alt.param(bind=rad_slider, value=0, name="radius")
rad2_slider = alt.binding_range(min=0, max=100, step=1)
rad_var2 = alt.param(bind=rad_slider, value=50, name="radius2")
theta_slider = alt.binding_range(min=-2*np.pi, max=2*np.pi)
theta_var = alt.param(bind=theta_slider, value=-0.73, name="theta_single_arc")
theta_slider2 = alt.binding_range(min=-2*np.pi, max=2*np.pi)
theta2_var = alt.param(bind=theta_slider, value=0.73, name="theta2_single_arc")
corner_slider = alt.binding_range(min=0, max=50, step = 1)
corner_var = alt.param(bind=corner_slider, value=0, name="cornerRadius")
pad_slider = alt.binding_range(min=0, max=np.pi/2)
pad_var = alt.param(bind=pad_slider, value=0, name="padAngle")
source = pd.DataFrame({"category": [1, 2, 3, 4, 5, 6], "value": [4, 6, 10, 3, 7, 8]})
c1 = alt.Chart(source, title="Single Arc").mark_arc(
radius=rad_var,
radius2=rad_var2,
theta = theta_var,
theta2 = theta2_var,
cornerRadius = corner_var,
padAngle = pad_var,
)
c2 = alt.Chart(source, title="Stacked Arcs").mark_arc(
radius=rad_var,
radius2=rad_var2,
cornerRadius = corner_var,
padAngle = pad_var,
).encode(
theta=alt.Theta(field="value", type="quantitative"),
color=alt.Color(field="category", type="nominal"),
)
alt.hconcat(c1,c2).add_params(
rad_var, rad_var2, theta_var, theta2_var, corner_var, pad_var
)
|
|
Looks great! The styling is a trick in the documentation. Where should we place these? In the interaction section of the example gallery? Or a special section with parameters? |
|
Thanks everyone for working on this! Thinking out loud a bit, one hesitation I have regarding translating these to altair instead of going with option 1, is that maintenance will be harder and we will manually have to check when there are updates to the Vega-Lite doc pages to update our examples. If we go with option 1 then updates will be pulled automatically so that we will be notified about them right away (but we can still choose whether to commit them right away or later if the Altair library needs to get updated first). I do agree that there is some advantage to seeing the examples in Altair code, and there are not that many mark pages that have elaborate use of sliders, so it doesn't seem too complex to maintain this. If we use the altair code, I agree that we should use a dropdown similar to these in JupyterBook. Overall i would say I am fine either way and don't feel strongly about this, but thought I would just raise this minor concern. |
|
Hi @joelostblom, I haven't wrapped my head around the docs so maybe this doesn't make sense, but I was picturing just providing like a "related example" rather than an Altair version that produces the exact Vega-Lite spec. |
|
My understanding from the conversation above is that option 3 will replace the VegaLite spec with an Altair version and use the latter to generate the sliders and charts on the mark pages. |
|
I like these examples in the docs and it is inspiring. But then coming too realize you can't reproduce it in Altair is somehow a bummer. Another reason why I think it's good to have Altair derived VL-specifications is because Altair adopts a top-level strategy for parameters instead of nested parameters. I think these Altair specifications are a bit tedious and large to be included as well within these mark documentation. So for me its fine to refer to another page where the Altair specification is written in full. This jupyterbook drop-down style is fine too. |
|
Good points @mattijn , I agree it is a bit of a bummer for more advanced users to not be able to see how the charts can be made in Altair and I didn't think about the top level vs nested difference. And yes, there aren't that many examples overall and the Arc is the most complicated so it sounds like it makes sense if you keep trying to translate them @ChristopherDavisUCI . @binste Do you want to go ahead and add the translated example Chris posted here to the arc page and then Chris can follow up with a PR for the other pages as he completes them? That way you don't have to wait for him to complete this PR and move on to the other parts you mentioned you would like to work on? Or would you prefer to do it some other way? For the dropdown panel, you can use |
|
To add. Based on the comment of @binste. I meant, a combination of 3 and 1:
|
|
Maybe I am missing something here, but if we have the altair spec, why do we need the HTML translation part? Can't we use the And on the marks landing page, we could link to the heading that contains the mark properties? Sorry if I am misunderstanding. |
|
Actually there is already a |
… of vega bindings for the property examples
|
Thank you all for your great help! It's really cool to see the Altair code (toggleable and hidden by default) right next to all the interactive examples :) I added all of them to this PR and updated the hosted documentation at https://binste.github.io/altair-docs/user_guide/marks/arc.html for you to review. As suggested, I changed the css styling of the bindings to only apply to these examples and not the rest of the documentation by modifying the altairplot directive to support custom css class for the chart div. Let me know if there are any other changes you think are necessary before merging this. |
…as parent div had no width set
|
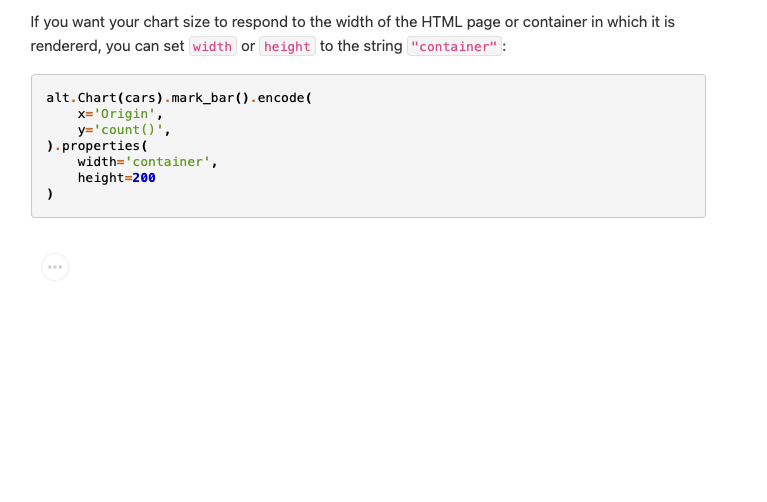
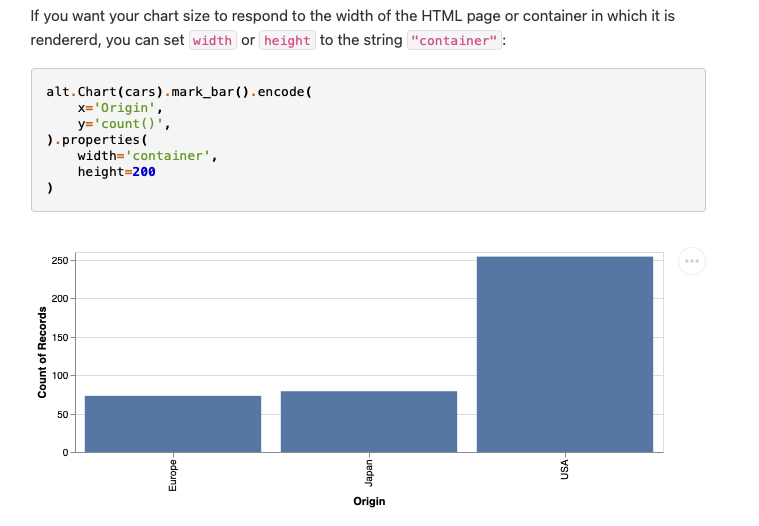
I also just sneeked in a small fix on the customizing visualizations page. I didn't open a separate PR as I needed the new altairplot functionality to add custom css classes introduced in this PR, hope that's ok! Due to the new documentation layout (which is amazing!), this chart no longer showed up
After the fix:
|
|
Looks great @binste! |
 mattijn
left a comment
mattijn
left a comment
There was a problem hiding this comment.
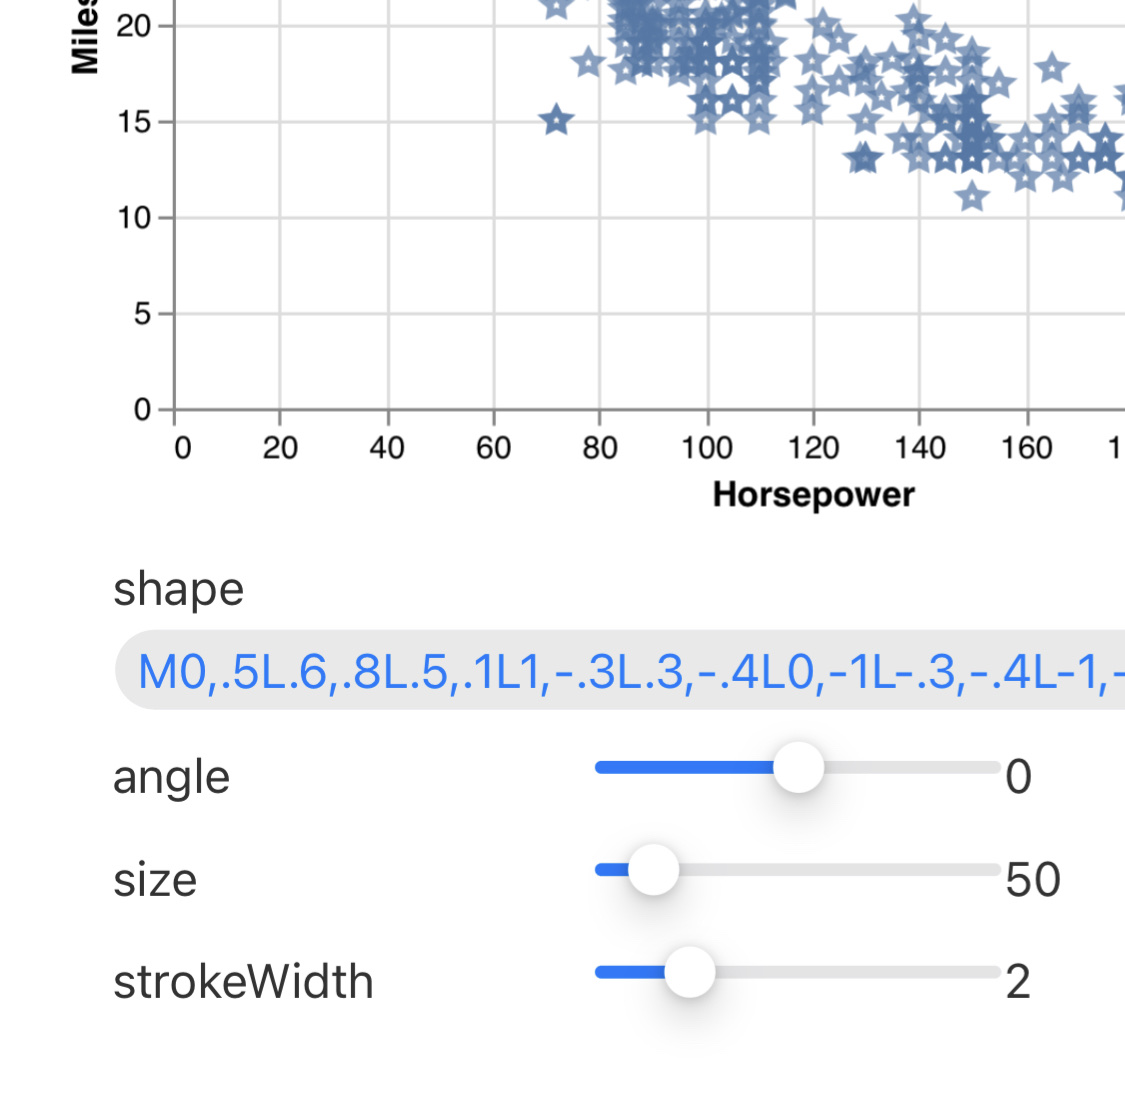
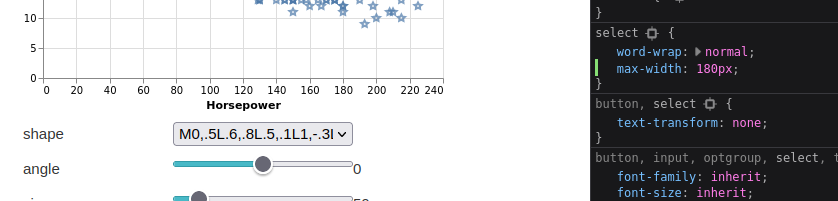
Minor comment: Maybe need to set a x-overflow for here? https://binste.github.io/altair-docs/user_guide/marks/point.html#point-mark-properties
|
Yeah that one doesn't look great. However, not sure how to restrict it best as there is no obvious maximum width for the form containing those bindings. I played around with setting one for the whole form with .properties-example .vega-bindings {
max-width: 400px
}and then setting |
|
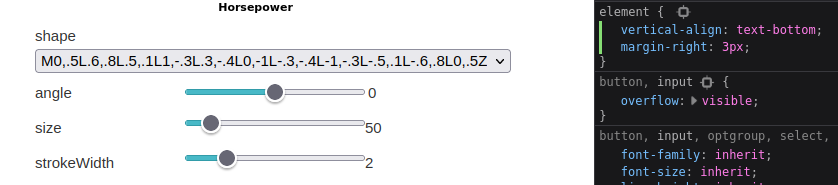
In the vega-lite docs they just use
|
|
Could we also set |
|
Simpler then expected... Thanks for the guidance! I added the css settings. Docs are updated so you can review. |
 joelostblom
left a comment
joelostblom
left a comment
There was a problem hiding this comment.
This update is so awesome! Thanks again @binste, your changes here will improve the docs notably and your contribution is really appreciated! I added some suggestions, there are many comments but most of them are about black messing up the formatting of the plot syntax.
Co-authored-by: Joel Ostblom <joelostblom@users.noreply.github.com>
Co-authored-by: Joel Ostblom <joelostblom@users.noreply.github.com>
Co-authored-by: Joel Ostblom <joelostblom@users.noreply.github.com>
Co-authored-by: Joel Ostblom <joelostblom@users.noreply.github.com>
|
Happy to hear and thanks for the extensive feedback! :) I addressed all your comments. Indeed, I had formatted all the code examples with black to get a consistent style (always double quotes, no whitespaces around Doc is updated https://binste.github.io/altair-docs/user_guide/marks/index.html |
|
Looks great. I noticed the two following things:
|
joelostblom
left a comment
There was a problem hiding this comment.
Looking great! I think once the two issues Mattijn pointed out above are fixed, we're good to merge.
Indeed, I had formatted all the code examples with black to get a consistent style (always double quotes, no whitespaces around = for keyword arguments, ...) and I really like how it looks in general. But I can see the point that the code style which is mostly used across the documentation might be easier to read for the Altair syntax.
I actually used to write altair code similar to that myself because that is how I wrote pandas, but after a while I switched to the way of the docs and later switched over my pandas syntax to that way too as I found it more convenient. Not saying it is necessarily better or worse, so here I mostly mentioned it for consistency.
|
Great to hear! I fixed the two issues in the latest commit. Both plot and table now render as expected. |
joelostblom
left a comment
There was a problem hiding this comment.
LGTM, merging! Thank again!
This PR addresses the points raised by @joelostblom in #2607 and #2578 (the later can be closed after this PR). In addition, I went through all mark pages to fix any bugs or vega-lite specific parts I could find. I think the pages are now in pretty good shape but it would certainly be nice if someone else can take a thorough look as well. CC @mattijn in case you want to take a look as well.
I have not yet included the sections with the interactive sliders from the vega-lite documentation. Still need to figure out how to best accomplish this. I'll try the suggestions from comment 4 in #2578 and add it to this PR later on or then in a new one.
You can view the updated documentation at https://binste.github.io/altair-docs/ with the exception of the charts in the geoshape section as I did not have geopandas installed. As a sidenote, where would be a good place to add a note that this is now necessary to build the documentation? Maybe we should add it in
requirements_dev.txtso it is also included in the docbuild workflow?