Debugging
Sometimes we need a better way to Debug our FWL Scripts i describe 2 easy ways how this can be done.
We have to start XPlane from a command-line
How to is well written here --> https://www.x-plane.com/kb/using-command-line-options/
Example for MacOS :
../X-Plane.app/Contents/MacOS/X-Plane --no_fbosIn this example we use a easy and lightweight Solution from slembcke (Scott Lembcke) · GitHub .
Copy from this Project https://github.com/slembcke/debugger.lua only debugger.lua into FWL Modules Folder.
Make sure your Script Folder is empty or the Debugger starts , after FWL is loaded (Loading Screen XPLANE)
Adapt your own Script like this: (this Text was copied from the project)
local dbg = require("debugger")
-- Consider enabling auto_where to make stepping through
-- code easier to follow.
dbg.auto_where = 2

function foo()
    -- Calling dbg() will enter the debugger on the next executable line,
    -- right before it calls print().
    -- Once in the debugger, you will be able to step around and
    -- inspect things.
    dbg()
    print("Woo!")

    -- Maybe you only want to start the debugger on a certain condition.
    -- If you pass a value to dbg(), it works like an assert statement.
    -- The debugger only triggers if it's nil or false.
    dbg(5 == 5) -- Will be ignored

    print("Fooooo!")
end

foo()

-- You can also wrap a chunk of code in a dbg.call() block.
-- Any error that occurs will cause the debugger to attach.
-- Then you can inspect the cause.
-- (NOTE: dbg.call() expects a function that takes no parameters)
dbg.call(function()
    -- Put some buggy code in here:
    local err1 = "foo" + 5
    local err2 = (nil).bar
end)

-- Lastly, you can override the standard Lua error() and
-- assert() functions if you want:
-- These variations will enter the debugger instead of aborting
-- the program.
-- dbg.call() is generally more useful though.
local assert = dbg.assert
local error = dbg.error
If we encounter now a "Bug" in our Script, we can see it in our Terminal:
debugger.lua: Loaded for LuaJIT 2.0.5
..Resources/plugins/FlyWithLua/Scripts/tutorial.lua:88 in chunk at
..Resources/plugins/FlyWithLua/Scripts/tutorial.lua:0
debugger.lua>
And now ? Type "h" and press Enter --> you can see all possible Shortcuts for Debugging
debugger.lua> h
  <return> => re-run last command
  c(ontinue) => continue execution
  s(tep) => step forward by one line (into functions)
  n(ext) => step forward by one line (skipping over functions)
  f(inish) => step forward until exiting the current function
  u(p) => move up the stack by one frame
  d(own) => move down the stack by one frame
  w(here) [line count] => print source code around the current line
  e(val) [statement] => execute the statement
  p(rint) [expression] => execute the expression and print the result
  t(race) => print the stack trace
  l(ocals) => print the function arguments, locals and upvalues.
  h(elp) => print this message
  q(uit) => halt execution
debugger.lua>
You can write "w" in your Terminal and press again Enter, you see then the starting point after your dbg() Statement
debugger.lua> w
  83        (c =  Continue execution)
  84    ]]
  85    end
  86
  87    dbg()
  88 => print(str1)
  89
  90    func1()
  91    print(str2)
  92
  93    func2()
debugger.lua>
Follow the whole Tutorial.lua from this project to warm up with this CLI Debugger. You can set statements, print variables ... everything what you need to debug your script.
FLW can not tell us whats going on, we see nothing in detail in our XPLANE log nor information in FlyWithLua_Debug.txt ! We only see this on our Screen and the Script Name himself.
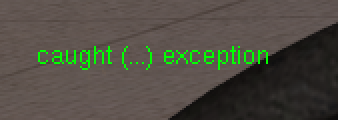 and this
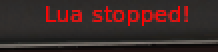
FlyWithLua_Debug.txt
[000948] FlyWithLua Debug Info: The Lua stack contains the following elements: [000949] caught (...) exception
XPLANE log.txt
FlyWithLua Info: Lua engine (re)started. LUA_RUN =19, SDK_VERSION = 301, XPLANE_VERSION = 11410, XPLANE_LANGUAGE = German and XPLANE_HOSTID = 1 FlyWithLua Info: HID access initialized. FlyWithLua Info: FlyWithLua.ini full path /Volumes/SSD2go PKT/X-Plane 11 stable/Resources/plugins/FlyWithLua/Internals/FlyWithLua.ini FlyWithLua Info: Discovered 10 HID devices. FlyWithLua Info: Load ini file. FlyWithLua Info: Searching for Lua script files FlyWithLua Info: Sorting Lua script files FlyWithLua Info: Start loading script file /Volumes/SSD2go PKT/X-Plane 11 stable/Resources/plugins/FlyWithLua/Scripts/xsil_autoupdater.lua FlyWithLua Error: CopyDataRefsToLua() failed, can't execute script file: /Volumes/SSD2go PKT/X-Plane 11 stable/Resources/plugins/FlyWithLua/Scripts/xsil_autoupdater.lua FlyWithLua Error: Unable to load script file /Volumes/SSD2go PKT/X-Plane 11 stable/Resources/plugins/FlyWithLua/Scripts/xsil_autoupdater.lua FlyWithLua Info: Loading time for all scripts is 0.028823 sec. FlyWithLua Debug Info: The Lua stack contains the following elements: caught (...) exception
FlyWithLua Error: Unable to load script file
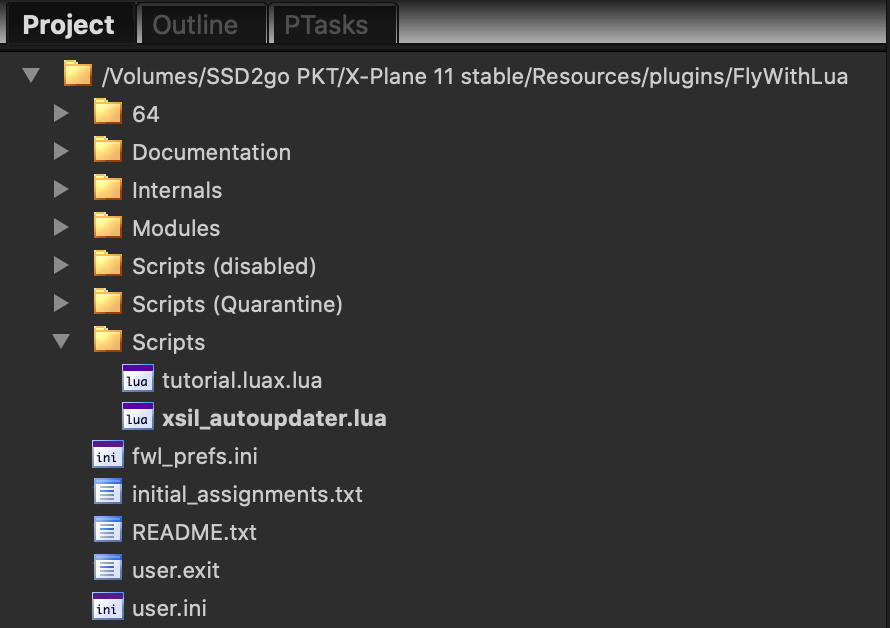
..Resources/plugins/FlyWithLua/Scripts/xsil_autoupdater.luaNow that we know it is located in script --> xsil_autoupdater.lua , we add our Debug Stuff inside the script ! Remember ... we have no idea when the script crashed, we use always in this case the first lines, before we call any code !
--DEBUG START
local dbg = require("debugger")
local assert = dbg.assert
local error = dbg.error
dbg()
--DEBUG END
Reload all LUA script files --> Menü --> Plugin -->FlyWithLua
Have a look in your Terminal now ! Enter "w" --> and we see our break point
debugger.lua> w
  35    local assert = dbg.assert
  36    local error = dbg.error
  37    dbg()
  38    --DEBUG END
  39
  40 => local http_socket = require("socket.http")
  41    local ltn12 = require("ltn12")
  42    local lfs = require("lfs_ffi") -- https://github.com/sonoro1234/luafilesystem
  43    local jjjLib1 = require("jjjLib1")
  44    local graphics = require("graphics")
  45    local toast = require("toast")
debugger.lua>
Enter "n" for:
n(ext) => step forward by one line (skipping over functions)
until we get the line of code where the Script has an issue. HINT --> ( [return] - re-run last command ) Again our Green and Red Message inside X-Plane ... but we see also we jumped out in line 45
debugger.lua> n
..Resources/plugins/FlyWithLua/Scripts/xsil_autoupdater.lua:41 in chunk at ..Resources/plugins/FlyWithLua/Scripts/xsil_autoupdater.lua:0
debugger.lua>
..Resources/plugins/FlyWithLua/Scripts/xsil_autoupdater.lua:42 in chunk at ..Resources/plugins/FlyWithLua/Scripts/xsil_autoupdater.lua:0
debugger.lua>
..Resources/plugins/FlyWithLua/Scripts/xsil_autoupdater.lua:43 in chunk at ..Resources/plugins/FlyWithLua/Scripts/xsil_autoupdater.lua:0
debugger.lua>
..Resources/plugins/FlyWithLua/Scripts/xsil_autoupdater.lua:44 in chunk at ..Resources/plugins/FlyWithLua/Scripts/xsil_autoupdater.lua:0
debugger.lua>
..Resources/plugins/FlyWithLua/Scripts/xsil_autoupdater.lua:45 in chunk at ..Resources/plugins/FlyWithLua/Scripts/xsil_autoupdater.lua:0
debugger.lua>
After we know that our toast lib can`t be loaded we can capsulate this function with a dbg.call
--DEBUG START
local dbg = require("debugger")
local assert = dbg.assert
local error = dbg.error
dbg()
--DEBUG END
local http_socket = require("socket.http")
local ltn12 = require("ltn12")
local lfs = require("lfs_ffi") -- https://github.com/sonoro1234/luafilesystem
local jjjLib1 = require("jjjLib1")
local graphics = require("graphics")
--local toast = require("toast")
dbg.call(function()
-- Put some buggy code in here:
local toast = require("toast")
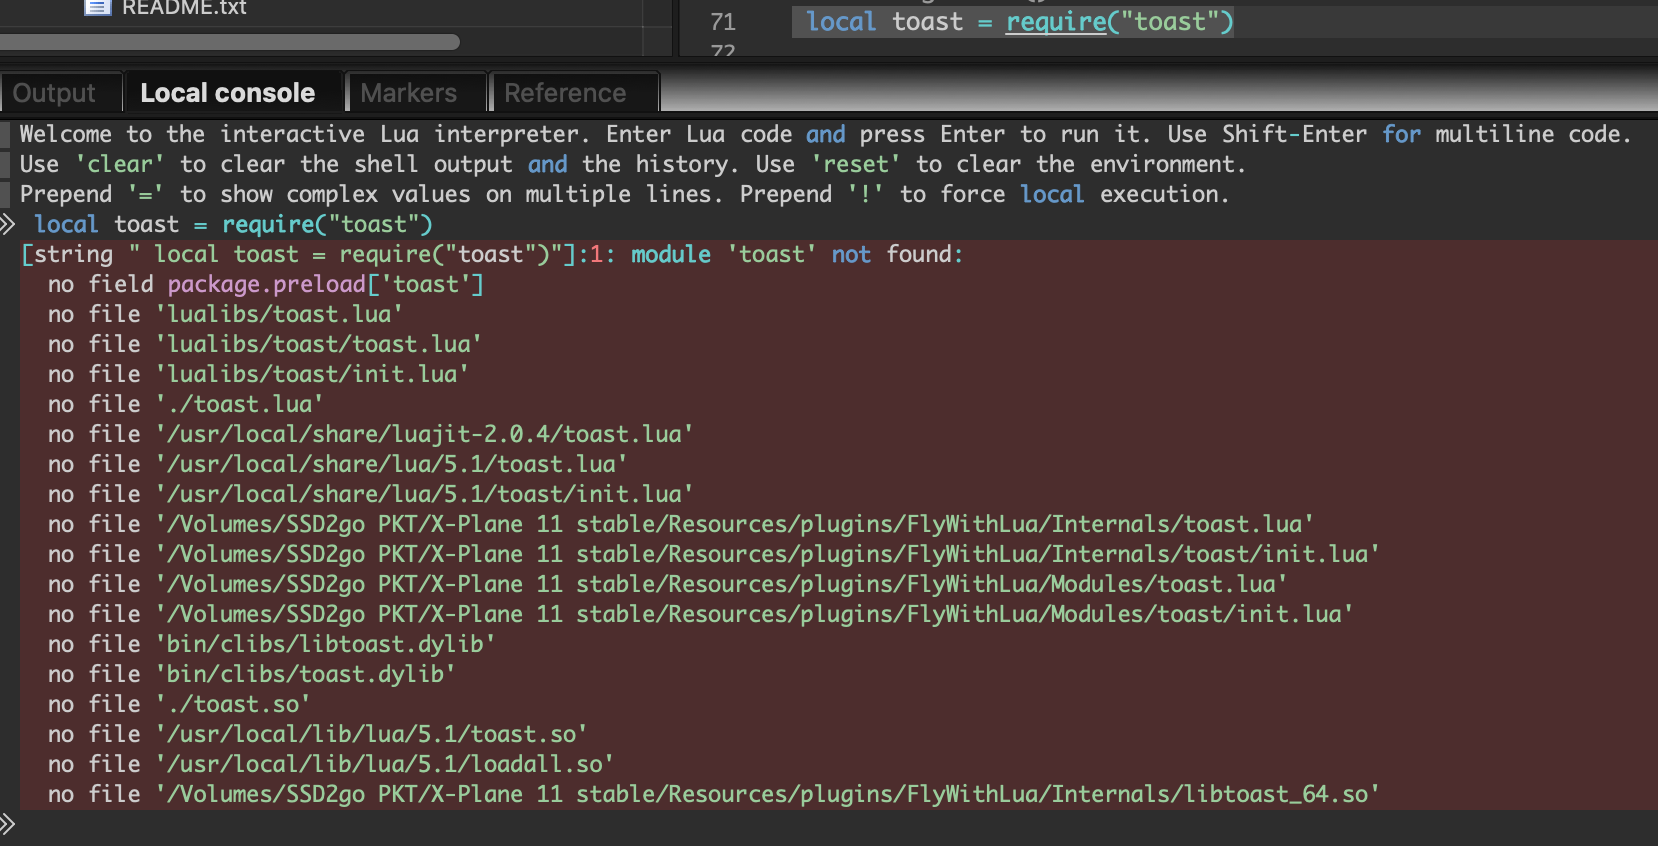
end)We reload our script and starting again with "n(ext)" until we hit something like this
debugger.lua>
Debugger stopped on error in dbg.call(): "..plugins/FlyWithLua/Scripts/xsil_autoupdater.lua:49:
module 'toast' not found:\
\9no field package.preload['toast']\
\9no file './toast.lua'\
\9no file '/usr/local/share/luajit-2.0.5/toast.lua'\
\9no file '/usr/local/share/lua/5.1/toast.lua'\
\9no file '/usr/local/share/lua/5.1/toast/init.lua'\
\9no file '..Resources/plugins/FlyWithLua/Internals/toast.lua'\
\9no file '..Resources/plugins/FlyWithLua/Internals/toast/init.lua'\
\9no file '..Resources/plugins/FlyWithLua/Modules/toast.lua'\
\9no file '..Resources/plugins/FlyWithLua/Modules/toast/init.lua'\
\9no file './toast.so'\
\9no file '/usr/local/lib/lua/5.1/toast.so'\
\9no file '/usr/local/lib/lua/5.1/loadall.so'\
\9no file '..Resources/plugins/FlyWithLua/Internals/toast_64.so'\
\9no file '..Resources/plugins/FlyWithLua/Modules/toast_64.so'"
Reason for this ? In my case forgot to copy my new Module in our FWL Module Folder ;-)
Ok now after this Module was copied ... again the same message ... caught (...) exception ... We don´t change our Debug lines, god thing is our debugger follow the code ! Again press "n" with dbg.call in our script
debugger.lua>
Debugger stopped on error in dbg.call(): "error loading module 'toast' from file '..Resources/plugins/FlyWithLua/Modules/toast.lua':\
\9....plugins/FlyWithLua/Modules/toast.lua:81: unexpected symbol near '='"
After this detail we can inspect our line of Code

This was a pure Typo in this case inside a Module. --> correct was :
if toast[i] ~= nil thenBoth topics were identified within 1 minute ! Without debugger much longer ;-)
There are many graphical tools to search for errors. I focused on ZeroBrane Studio for this part. The reason for this is quickly explained. It exists for every platform, we don't have to provide anything else in our operating system and it's open source !
After the software is installed we can start debugging immediately. We only need to call "MobDebug" in our script . This is also provided by Zerobrane.
ZeroBrane Studio supports remote debugging that allows to debug arbitrary Lua applications. The application may be running on the same or a different computer from the one running the IDE instance (the debugger is using a socket interface to interact with the application).
It can be found as an example on a MacOS at:
/Applications/ZeroBraneStudio.app/Contents/ZeroBraneStudio/lualibs/mobdebugWe have now two options:
- copy the script mobdebug.lua into our modules folder (should happen after every software update)
or
- we show our script/environment where it is
local ZBS = "/Applications/ZeroBraneStudio.app/Contents/ZeroBraneStudio"
package.path = package.path .. ";" .. ZBS .. "/lualibs/mobdebug/?.lua;"
local mobdebug = require("mobdebug")
with the last information in our script we can start the Remote debugging. This is a example start when the Game + Zerobrane is on the same PC.
mobdebug.start()If you start Zerobrane from a other PC in your Network choose this (change ip / domain name to your Environment)
mobdebug.start("192.168.8.101")You can extend Zerobrane Studio with useful plugins. Download from ZeroBranePackage the whole Project and follow the Installation. ARCHIVE AS ZIP
To install a plugin, copy its .lua file to ZBS/packages/ or HOME/.zbstudio/packages/ folder (where ZBS is the path to ZeroBrane Studio location and HOME is the path specified by the HOME environment variable). The first location allows you to have per-instance plugins, while the second allows to have per-user plugins. The second option may also be preferrable for Mac OSX users as the ZBS/packages/ folder may be overwritten during an application upgrade.
Useful ZeroBrane Studio packages:
analyzeall.lua
autodelimitersurroundselection.lua
autoindent.lua
autostartdebug.lua
colourpicker.lua
documentmap.lua
highlightselected.lua
projectsettings.lua
referencepanel.lua
striptrailingwhitespace.lua
syntaxcheckontype.lua
todoall.lua
When you open Zerobrane Studio for the first time we need some settings that need to be made.
Choose a project folder --> as I work locally I choose the FlyWithLua folder inside plugins. Menu --> Project --> Project Directory --> choose
Create Project specific Preferences --> Menu --> Edit --> Preferences --> Settings: Project Project specific means, automatic creation inside our project folder .zbstudio/user.lua
--[[--
  Use this file to specify **User** preferences.
  Review [examples](+/Applications/ZeroBraneStudio.app/Contents/ZeroBraneStudio/cfg/user-sample.lua) or check [online documentation](http://studio.zerobrane.com/documentation.html) for details.
--]]--
--https://studio.zerobrane.com/doc-general-preferences#debugger

-- to automatically open files requested during debugging
editor.autoactivate = true

--enable verbose output
--debugger.verbose=true

--[[--
specify how print results should be redirected in
the application being debugged (v0.39+). Use 'c' for ‘copying’
(appears in the application output and the Output panel),
'r' for ‘redirecting’ (only appears in the Output panel),
or 'd' for ‘default’ (only appears in the application output).
This is mostly useful for remote debugging to specify how the
output should be redirected.
--]]--
debugger.redirect="c"

-- to force execution to continue immediately after starting debugging;
-- set to `false` to disable (the interpreter will stop on the first line
-- or when debugging starts); some interpreters may use `true` or
-- `false` by default, but can be still reconfigured with this setting.
debugger.runonstart = true

-- FlyWithLua.ini version 2.7.6 build 2018-10-24
-- Where to search for modules.

-- use this to evaluate your project folder ,
-- select the print function / right Mousebutton --> Evaluate in Console
--print(ide.filetree.projdir)
--print(ide:GetProject())

local ZBSProjDir = "/Volumes/SSD2go PKT/X-Plane 11 stable/Resources/plugins/FlyWithLua"
INTERNALS_DIRECTORY = ZBSProjDir .. "/Internals/"
MODULES_DIRECTORY = ZBSProjDir .. "/Modules/"

package.path = table.concat({
    package.path,
    INTERNALS_DIRECTORY .. "?.lua",
    INTERNALS_DIRECTORY .. "?/init.lua",
    MODULES_DIRECTORY .. "?.lua",
    MODULES_DIRECTORY .. "?/init.lua",
}, ";")
package.cpath = table.concat({
    package.cpath,
    INTERNALS_DIRECTORY .. "?.ext",
    MODULES_DIRECTORY .. "?.ext",
}, ";")

-- Produce a correct name pattern for binary modules for OS
-- and architecture.
-- This resolves clash between OS X and Linux binary modules
-- by requiring "lib" prefix for Linux ones.
local library_pattern = "?_64."

if SYSTEM == "IBM" then
    library_pattern = library_pattern .. "dll"
elseif SYSTEM == "APL" then
    library_pattern = library_pattern .. "so"
else
    library_pattern = "lib" .. library_pattern .. "so"
end

package.cpath = package.cpath:gsub("?.ext", library_pattern)

--ZBS Plugin syntaxcheckontype.lua
syntaxcheckontype = {marker =
  {ch = wxstc.wxSTC_MARK_CHARACTER+('>'):byte(),
   fg = {0, 0, 0}, bg = {192, 192, 255}}
}
Always Save your changes ! Restart Zerobrane and debugging can start.
we have the same case as in our CLI Debug example, that means first of all we have to prepare our script. Open Zerobrane and edit your script.
--DEBUG START
local ZBS = "/Applications/ZeroBraneStudio.app/Contents/ZeroBraneStudio"
package.path = package.path .. ";" .. ZBS .. "/lualibs/mobdebug/?.lua;"
local mobdebug = require("mobdebug")
mobdebug.start()
--DEBUG END
Second part is to Set a Breakpoint , quit easy with a Mouse click after the Line Number

Reload all Scripts in FlyWithLua and you will see our Debuger has stopped for us

We can now navigate in our code
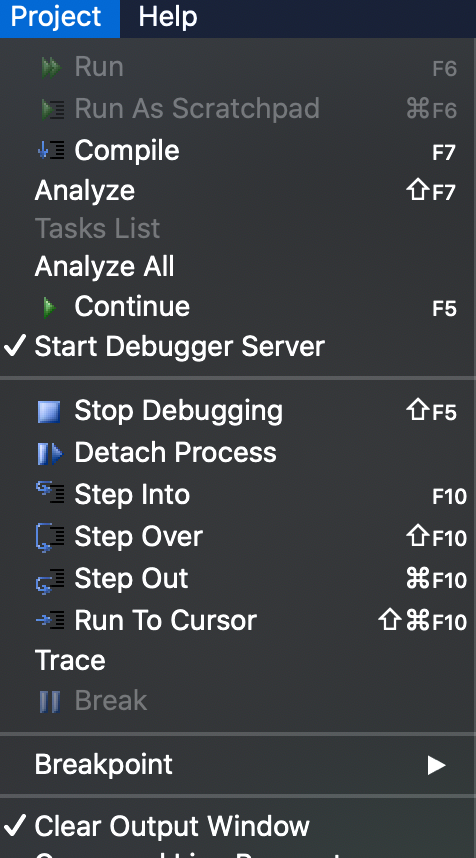
The Start is always the same with a unknow failure --> Step Over until we see something like this

Couldn't activate file '/Volumes/SSD2go PKT/X-Plane 11 stable/Resources/plugins/FlyWithLua/flywithlua_debug()' for debugging; continuing without it.
This is our Information for something goes wrong , but we have seen our Line of code ! We can now Inspect this line, we mark the require Statement and click on our rigth Mouse Button --> Evaluate in Console
After we copy now the Module in our Modules Folder --> same again --> restart debug session Same Line with problems --> Evaluate in Console
local toast = require("toast")
error loading module 'toast' from file '/Volumes/SSD2go PKT/X-Plane 11 stable/Resources/plugins/FlyWithLua/Modules/toast.lua':
    ...11 stable/Resources/plugins/FlyWithLua/Modules/toast.lua:81: unexpected symbol near '='
    [C]: at 0x010fdbbbe0
    [C]: in function 'require'
We jump now to our Toast script and change our line 81
-- before
if toast[i] ~== nil then
-- after
if toast[i] ~= nil then
And as always we can also catch with a xpcall and start a debugger session for example (function copied from debugger.lua and adapted)
-- Works like pcall(), but invokes the debugger on an error.
function dbg_call(f, ...)
return xpcall(f, function(err)
require("mobdebug").start()
print( "ERROR: ", err )
return err
end, ...)
end
dbg_call(function()
-- Put some buggy code in here:
local toast = require("toast")
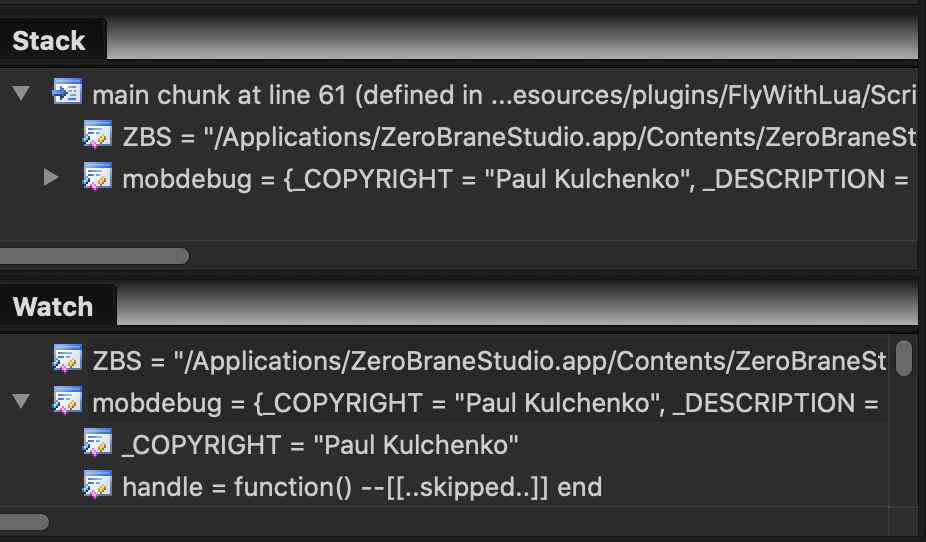
end)Use the Stack and Watch Window for your analysis !