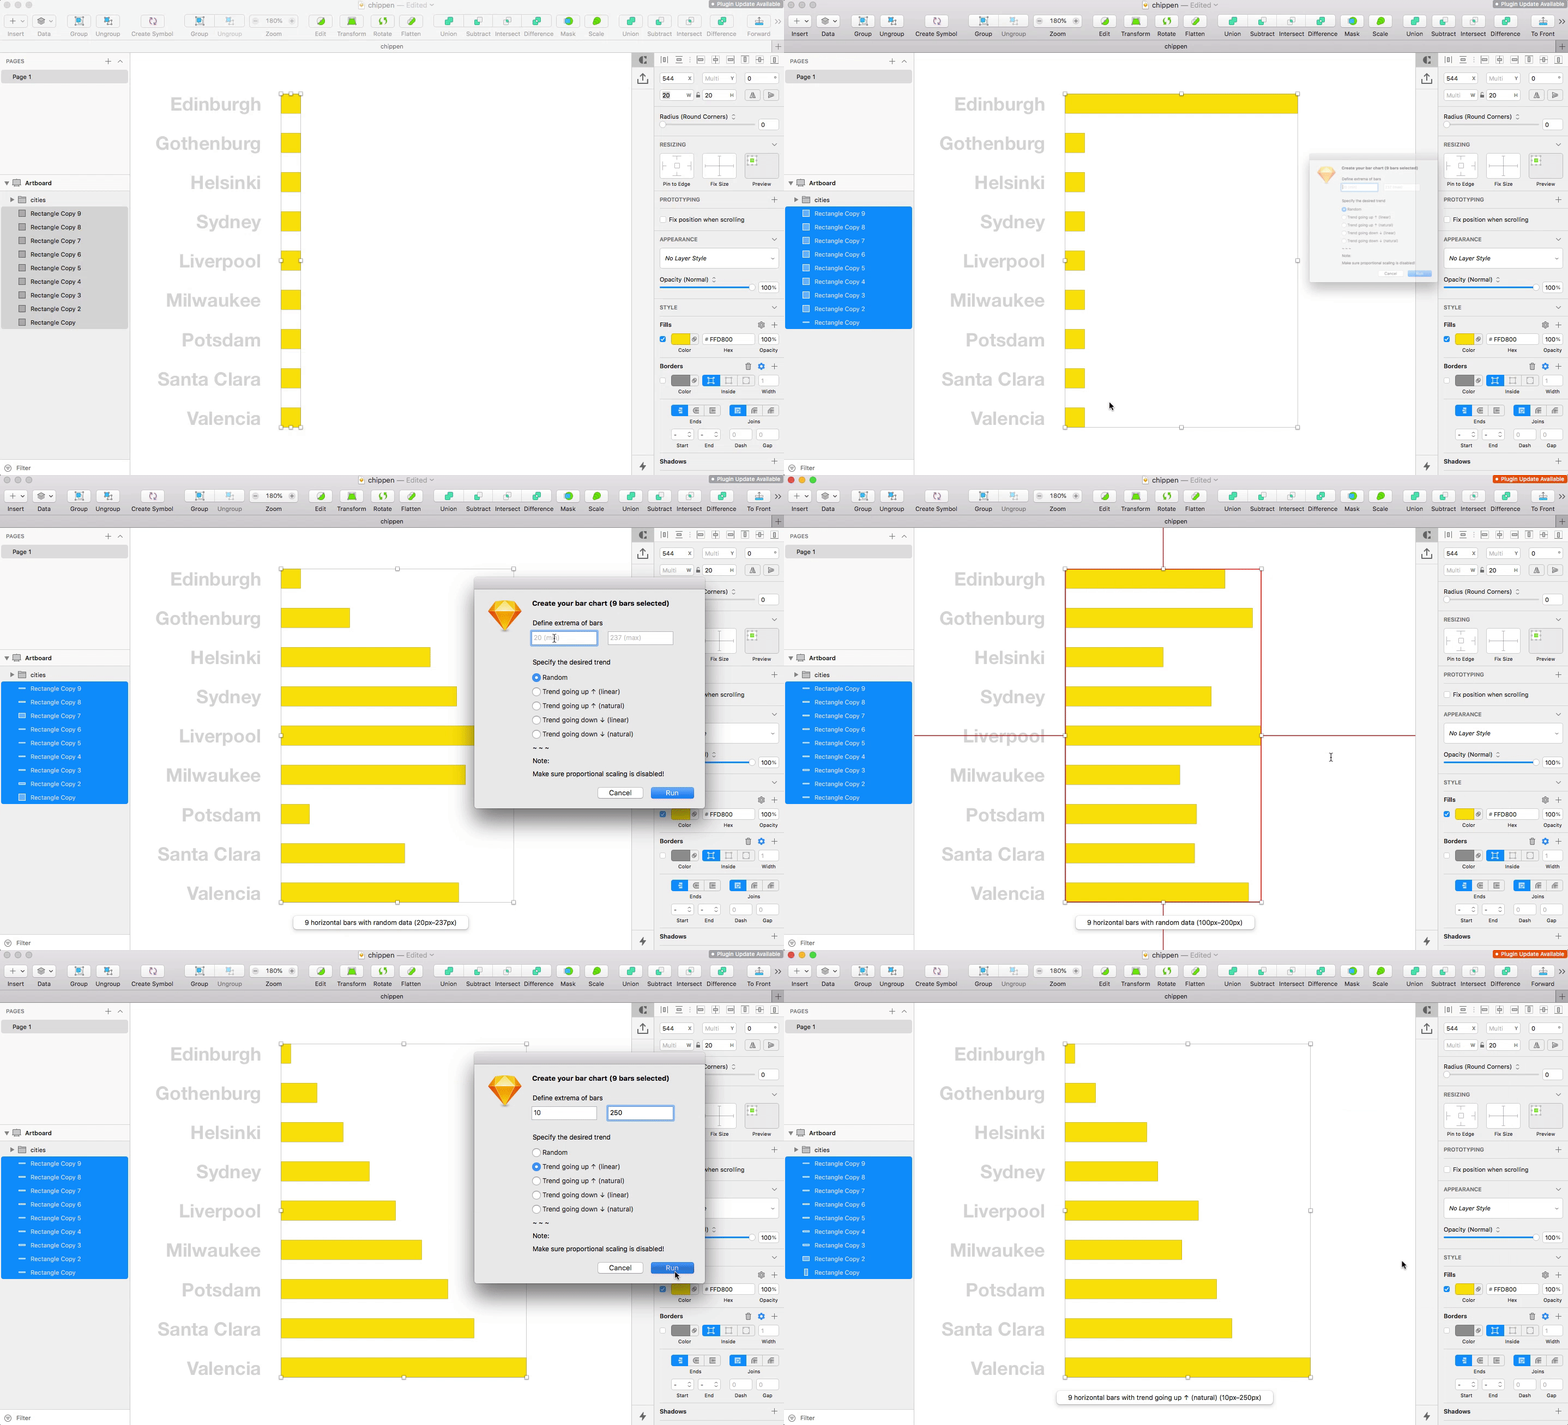
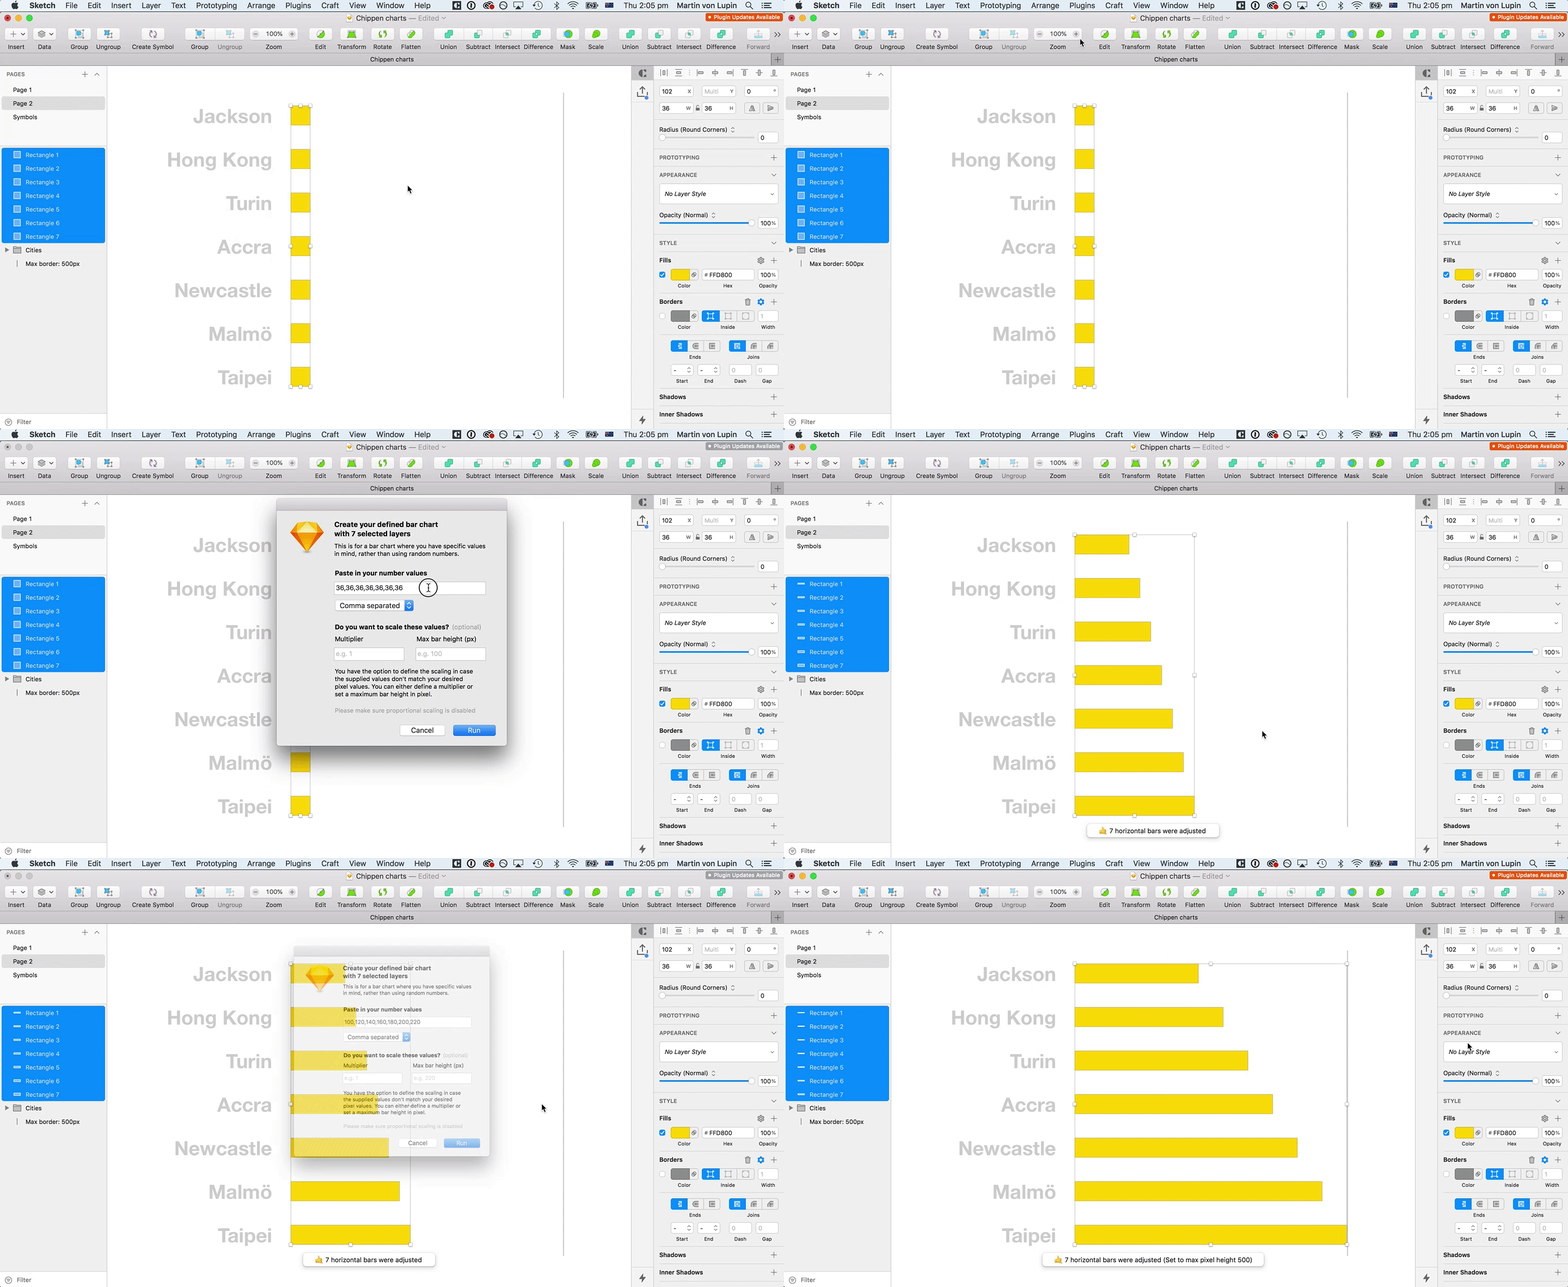
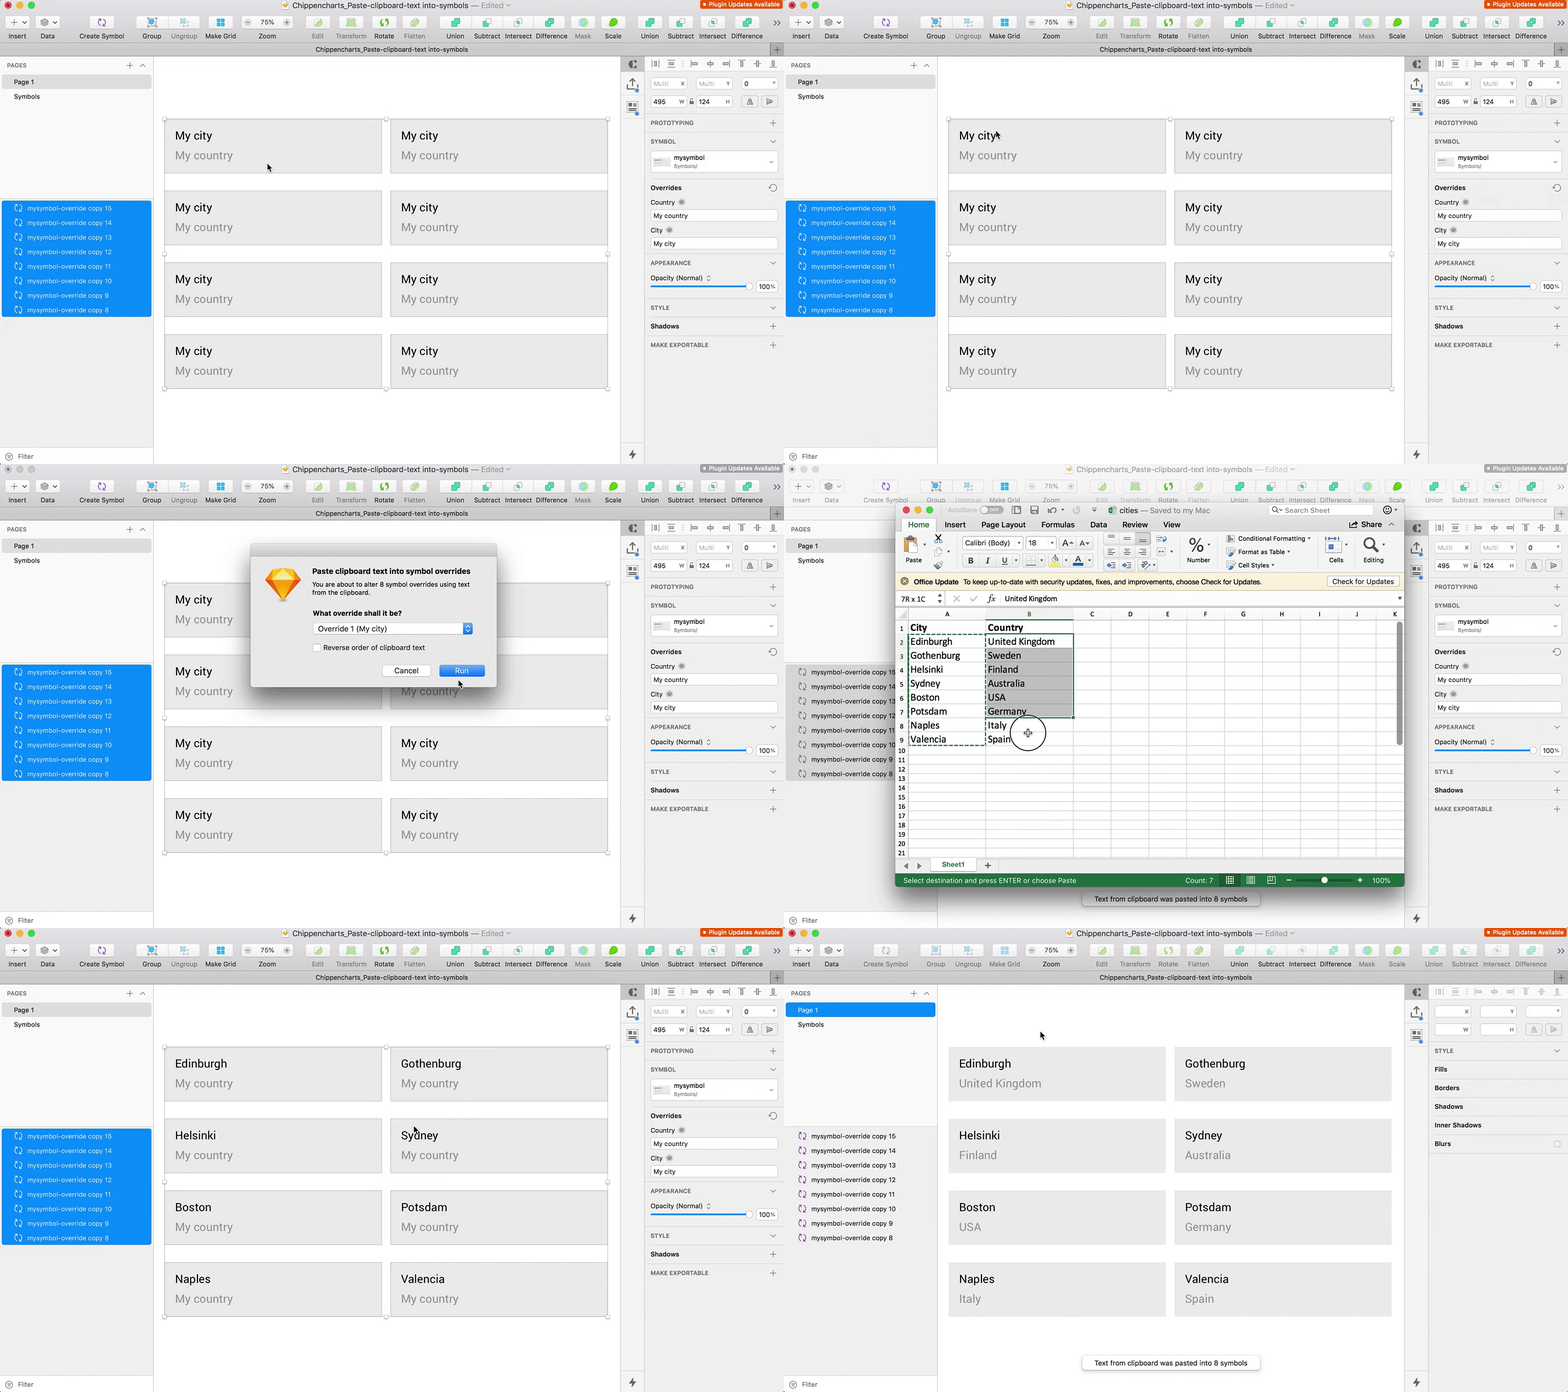
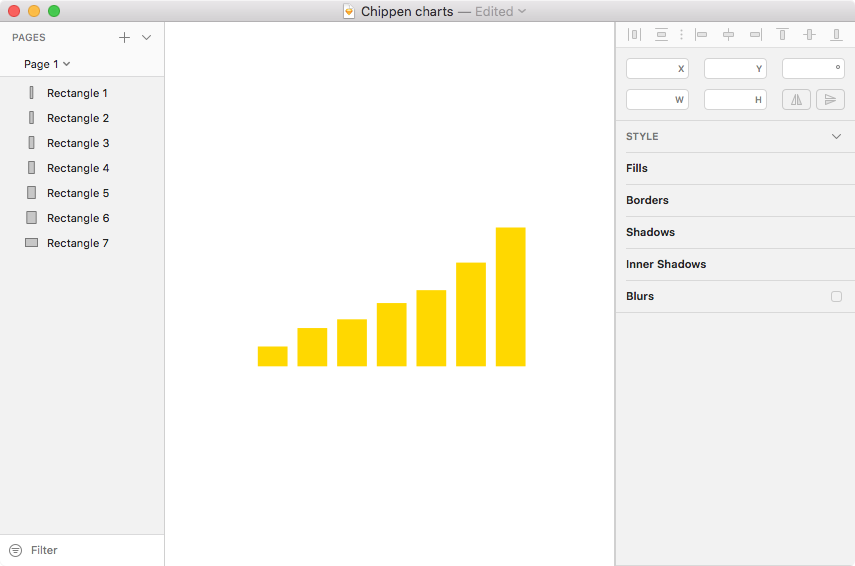
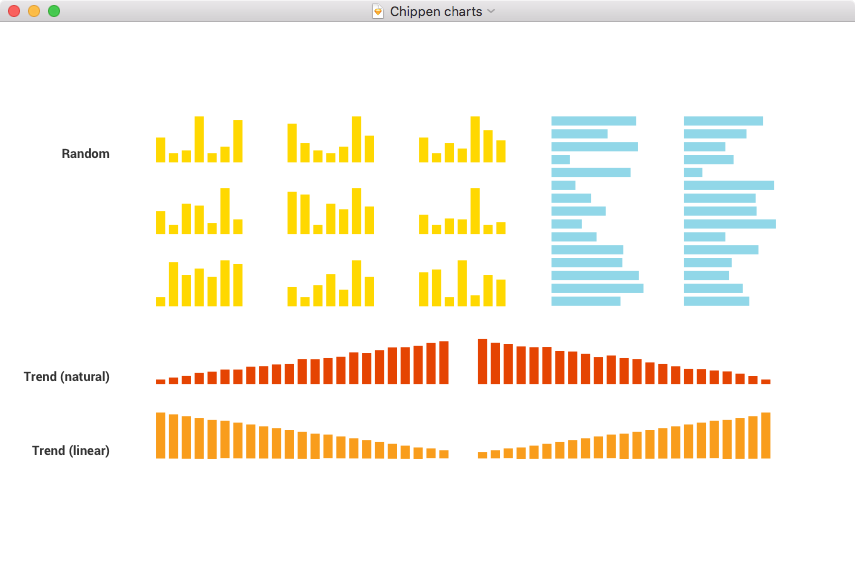
This is a Sketch plugin for creating charts with random or user defined data for use in mockups. Change the size of selected rectangles. Chose between random and linear. Works for both horizontal and vertical bar charts. Furthermore, the latest feature allows you to paste text from the clipboard straight into symbol overrides. How good is that, heh?
Made with love by Small Multiples in Chippendale, Sydney.
List of current features
- Bar chart with random values
- Bar chart with actual data
- Paste clipboard text into symbols
- Apply random fill to selection (new)
- Click the
Clone or downloadbutton in the top right and chooseDownload Zip - Save the ZIP file to your harddrive
- Open the downloaded file and double click the sketch file
chippen-charts.sketchplugin - The plugin is installed and you can use it via the menu
Plugins>Chippen charts
If you don't have data yet but still want to design a bar chart for your mockup, you can use the option to apply random values. You can also apply not-so-random values when choosing trend up or trend down.
If you have data that you want to apply to your chart this option is for you. You can even copy / paste from Excel columns or rows. How cool is that, right? In case your number values don't exactly match your desired pixel values, you have the option to apply a multiplier or set a maximum height. By default values don't get scaled.
Get your clipboard loaded with amazing text content, fire up the plugin, and let the magic of the plugin paste everything into your symbol override of choice. It's as simple as that.
You might wonder why you wouldn't wanna use the Sketch Data feature for that. The thing is, the Sketch Data feature does not preserve the order of elements, which this plugin does.
Apply random colours to selected layers or choose to apply colours based on the order layers in order to create a gradient. All that needs to be done is choosing two hex colours and the number of colours you want to be generated.
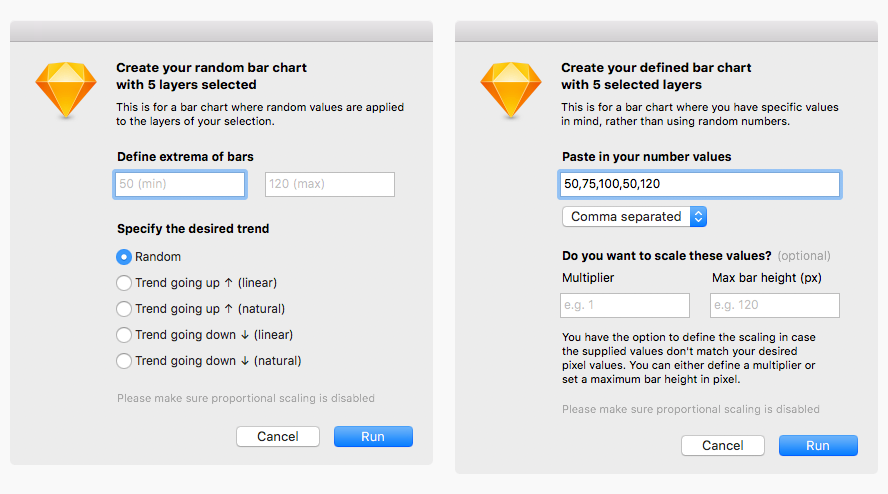
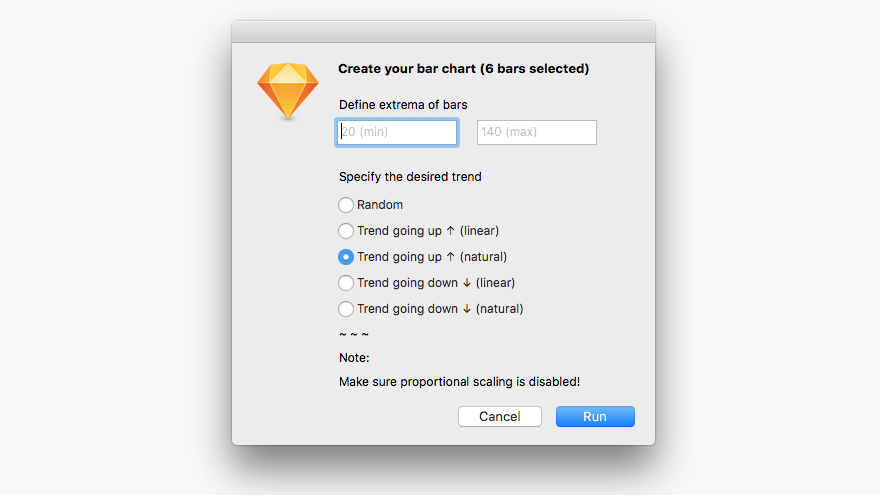
Those dialog boxes give you a good summary of what the plugin is capable of. Just have a look at the various input options.
- Create desired amount of rectangles
- Layers must be in the correct order
- Make sure layers are either bottom or left aligned
- Run the plugin and adjust settings in dialog window if necessary
- The size of you bars will be adjusted
Chippen Chart detects wheter you are about to create a vertical or horizontal bar chart using the x and y-position of your selected layers. If there is no common x or y-value it will by default apply the logic for vertical bars.
Chippen chart detects minimum and maximum pixel height of selected layers and apply those to the new bar chart. You can also adjust your desired extrema in the dialog window. If all selected layers share the same height the plugin will apply a default value for either min or max.
You can choose between 5 trend types. All of them will use the min and max value you define. Random will apply completely random integer numbers. Linear_ will interpolate values between min and max. Natural will do the same while adding a notion of randomness.
- Random
- Trend going up ↑ (linear)
- Trend going up ↑ (natural)
- Trend going down ↓ (linear)
- Trend going down ↓ (natural)
Besindes random numbers you can choose between linear trends and natural trends. Natural trends are like linear ones, but they have a little bit of randomeness aplpied to them.
- Random fill: add option to use layer order
- New feature: Random fill
- Bar charts: Force vertical or horizontal bar chart type
- Updates to popup
- Bugfix for wrong adjustment of bars when data point has value zero
- Add data value to layer name in the format "Layer name {:value:}"
- Optimise workflow with negative values for both, random and user-defined charts
- Bug fix for "Defined bar chart from selected layers" where bars wouldn't reposition correctly when first value is negative.
- Overall improvements in dealing with negative values.
- Bug fix for "Defined bar chart from selected layers" where the scale values from the input fields would not be used properly to calculate heights of bars
- Introducing new feature: Paste clipboard text into symbol overrides
- Introducing new feature: Create bar charts using user defined values
- Enhancements to dialog design
- Fixing update issues
Unintended results will appear when the proportional resizing is set between a layer's width and height. Proportional resizing must be disabled 🔓
Let us know. [email protected] | @smallmultiples

