Skip to content
New issue

Have a question about this project? Sign up for a free GitHub account to open an issue and contact its maintainers and the community.

By clicking “Sign up for GitHub”, you agree to our terms of service and privacy statement. We’ll occasionally send you account related emails.

Already on GitHub? Sign in to your account

derive(Debug) on huge enum causes massive memory spike during liveness checking #50450

Open
retep998 opened this issue May 4, 2018 · 2 comments
Labels
C-enhancement Category: An issue proposing an enhancement or a PR with one. I-compilemem Issue: Problems and improvements with respect to memory usage during compilation. T-compiler Relevant to the compiler team, which will review and decide on the PR/issue.

Comments

@retep998
Copy link
Member

retep998 commented May 4, 2018

Discovered on twitter: https://twitter.com/malwareunicorn/status/992438462652403713

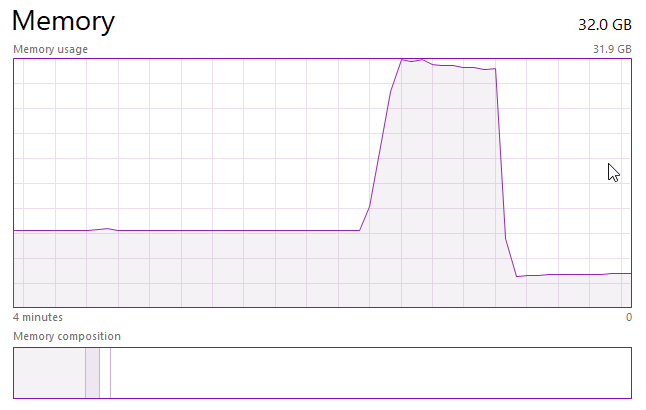
#[derive(Debug)] on an enum with 10,000 variants causes a 7GB spike. #[derive(Debug)] on an enum with 20,000 variants causes a massive 28GB spike.

20,000 variant code to reproduce: https://gist.github.com/retep998/fdddd37aea38c5d2bfacbf63773e2417

Time passes from 20,000 variant build which doesn't show the massive spike (in fact it shows the opposite because the massive spike pushed most of rustc's memory usage into the page file):

  time: 0.025; rss: 24MB        parsing
  time: 0.000; rss: 24MB        recursion limit
  time: 0.000; rss: 24MB        crate injection
  time: 0.000; rss: 24MB        plugin loading
  time: 0.000; rss: 24MB        plugin registration
    time: 0.287; rss: 82MB      expand crate
    time: 0.000; rss: 82MB      check unused macros
  time: 0.289; rss: 82MB        expansion
  time: 0.000; rss: 82MB        maybe building test harness
  time: 0.009; rss: 82MB        maybe creating a macro crate
  time: 0.026; rss: 82MB        creating allocators
  time: 0.028; rss: 82MB        AST validation
  time: 0.222; rss: 98MB        name resolution
  time: 0.022; rss: 98MB        complete gated feature checking
  time: 0.104; rss: 131MB       lowering ast -> hir
  time: 0.059; rss: 131MB       early lint checks
  time: 0.149; rss: 134MB       indexing hir
  time: 0.000; rss: 102MB       load query result cache
  time: 0.000; rss: 102MB       looking for entry point
  time: 0.000; rss: 102MB       looking for plugin registrar
  time: 0.009; rss: 102MB       loop checking
  time: 0.009; rss: 104MB       attribute checking
  time: 0.009; rss: 104MB       stability checking
  time: 0.098; rss: 121MB       type collecting
  time: 0.000; rss: 121MB       outlives testing
  time: 0.000; rss: 121MB       impl wf inference
  time: 0.024; rss: 139MB       coherence checking
  time: 0.000; rss: 139MB       variance testing
  time: 0.076; rss: 157MB       wf checking
  time: 0.144; rss: 157MB       item-types checking
  time: 60.147; rss: 211MB      item-bodies checking
  time: 0.506; rss: 231MB       rvalue promotion
  time: 0.170; rss: 232MB       privacy checking
  time: 0.016; rss: 232MB       intrinsic checking
  time: 96.740; rss: 234MB      match checking
  time: 54.939; rss: 52MB       liveness checking
  time: 54.936; rss: 246MB      borrow checking
  time: 0.001; rss: 246MB       MIR borrow checking
  time: 0.000; rss: 246MB       MIR effect checking
  time: 0.069; rss: 250MB       death checking
  time: 0.012; rss: 250MB       unused lib feature checking
  time: 0.245; rss: 261MB       lint checking
  time: 0.000; rss: 261MB       dumping chalk-like clauses
  time: 0.004; rss: 261MB       resolving dependency formats
    time: 0.011; rss: 262MB     write metadata
    time: 0.276; rss: 281MB     translation item collection
    time: 0.002; rss: 281MB     codegen unit partitioning
    time: 0.002; rss: 284MB     write allocator module
    time: 0.011; rss: 287MB     translate to LLVM IR
    time: 0.001; rss: 287MB     assert dep graph
    time: 0.000; rss: 287MB     serialize dep graph
  time: 0.323; rss: 287MB       translation
    time: 0.005; rss: 273MB     llvm function passes [hugeenum2]
    time: 0.004; rss: 273MB     llvm function passes [hugeenum3]
    time: 0.005; rss: 273MB     llvm function passes [hugeenum0]
    time: 0.005; rss: 273MB     llvm function passes [hugeenum4]
    time: 0.004; rss: 273MB     llvm function passes [hugeenum1]
    time: 0.003; rss: 254MB     llvm module passes [hugeenum0]
    time: 0.003; rss: 253MB     llvm module passes [hugeenum2]
    time: 0.003; rss: 253MB     llvm module passes [hugeenum3]
    time: 0.003; rss: 253MB     llvm module passes [hugeenum1]
    time: 0.003; rss: 253MB     llvm module passes [hugeenum4]
    time: 0.039; rss: 226MB     codegen passes [hugeenum0]
    time: 0.040; rss: 221MB     codegen passes [hugeenum2]
    time: 0.043; rss: 207MB     codegen passes [hugeenum3]
    time: 0.043; rss: 208MB     codegen passes [hugeenum4]
    time: 0.048; rss: 202MB     codegen passes [hugeenum1]
  time: 0.059; rss: 203MB       LLVM passes
  time: 0.000; rss: 46MB        serialize work products
    time: 0.322; rss: 46MB      running linker
  time: 0.371; rss: 46MB        linking

The massive spike:

@retep998 retep998 added I-compilemem Issue: Problems and improvements with respect to memory usage during compilation. T-compiler Relevant to the compiler team, which will review and decide on the PR/issue. labels May 4, 2018
@eddyb
Copy link
Member

eddyb commented May 4, 2018

cc @nikomatsakis Liveness checking only does warnings, I wonder if MIR NLL borrowck has enough information (because it also computes some form of liveness) to emit those same warnings.

@XAMPPRocky XAMPPRocky added the C-enhancement Category: An issue proposing an enhancement or a PR with one. label Oct 2, 2018
@tmiasko
Copy link
Contributor

tmiasko commented Feb 2, 2021

Triage:

  • The lint was disabled for derives in 24d410a. One can still use the test case together with -Zunpretty=expanded after removing #[automatically_derived] from the implementations.
  • There is a separate issue for running liveness analysis on MIR rewrite liveness analysis to be based on MIR #51003.
  • In the meantime the memory usage of the lint was reduced to the point where MIR data-flow analysis are now responsible for the peak memory usage, so running the lint on MIR is unlikely to help reducing the memory usage further.

bors added a commit to rust-lang-ci/rust that referenced this issue Jan 16, 2024
…<try>

Merge into larger interval set

This reduces the work done while merging rows. In at least one case (rust-lang#50450), we have thousands of union([range], [20,000 ranges]), which previously inserted each of the 20,000 ranges one by one. Now we only insert one range into the right hand set after copying the set over.

This cuts the runtime of the test case in rust-lang#50450 from ~26 seconds to ~6 seconds locally, though it doesn't change the memory usage peak (~9.5GB).
bors added a commit to rust-lang-ci/rust that referenced this issue Jan 27, 2024
…cjgillot

Merge into larger interval set

This reduces the work done while merging rows. In at least one case (rust-lang#50450), we have thousands of union([range], [20,000 ranges]), which previously inserted each of the 20,000 ranges one by one. Now we only insert one range into the right hand set after copying the set over.

This cuts the runtime of the test case in rust-lang#50450 from ~26 seconds to ~6 seconds locally, though it doesn't change the memory usage peak (~9.5GB).
Sign up for free to join this conversation on GitHub. Already have an account? Sign in to comment
Labels
C-enhancement Category: An issue proposing an enhancement or a PR with one. I-compilemem Issue: Problems and improvements with respect to memory usage during compilation. T-compiler Relevant to the compiler team, which will review and decide on the PR/issue.
Projects
None yet
Development

No branches or pull requests

4 participants