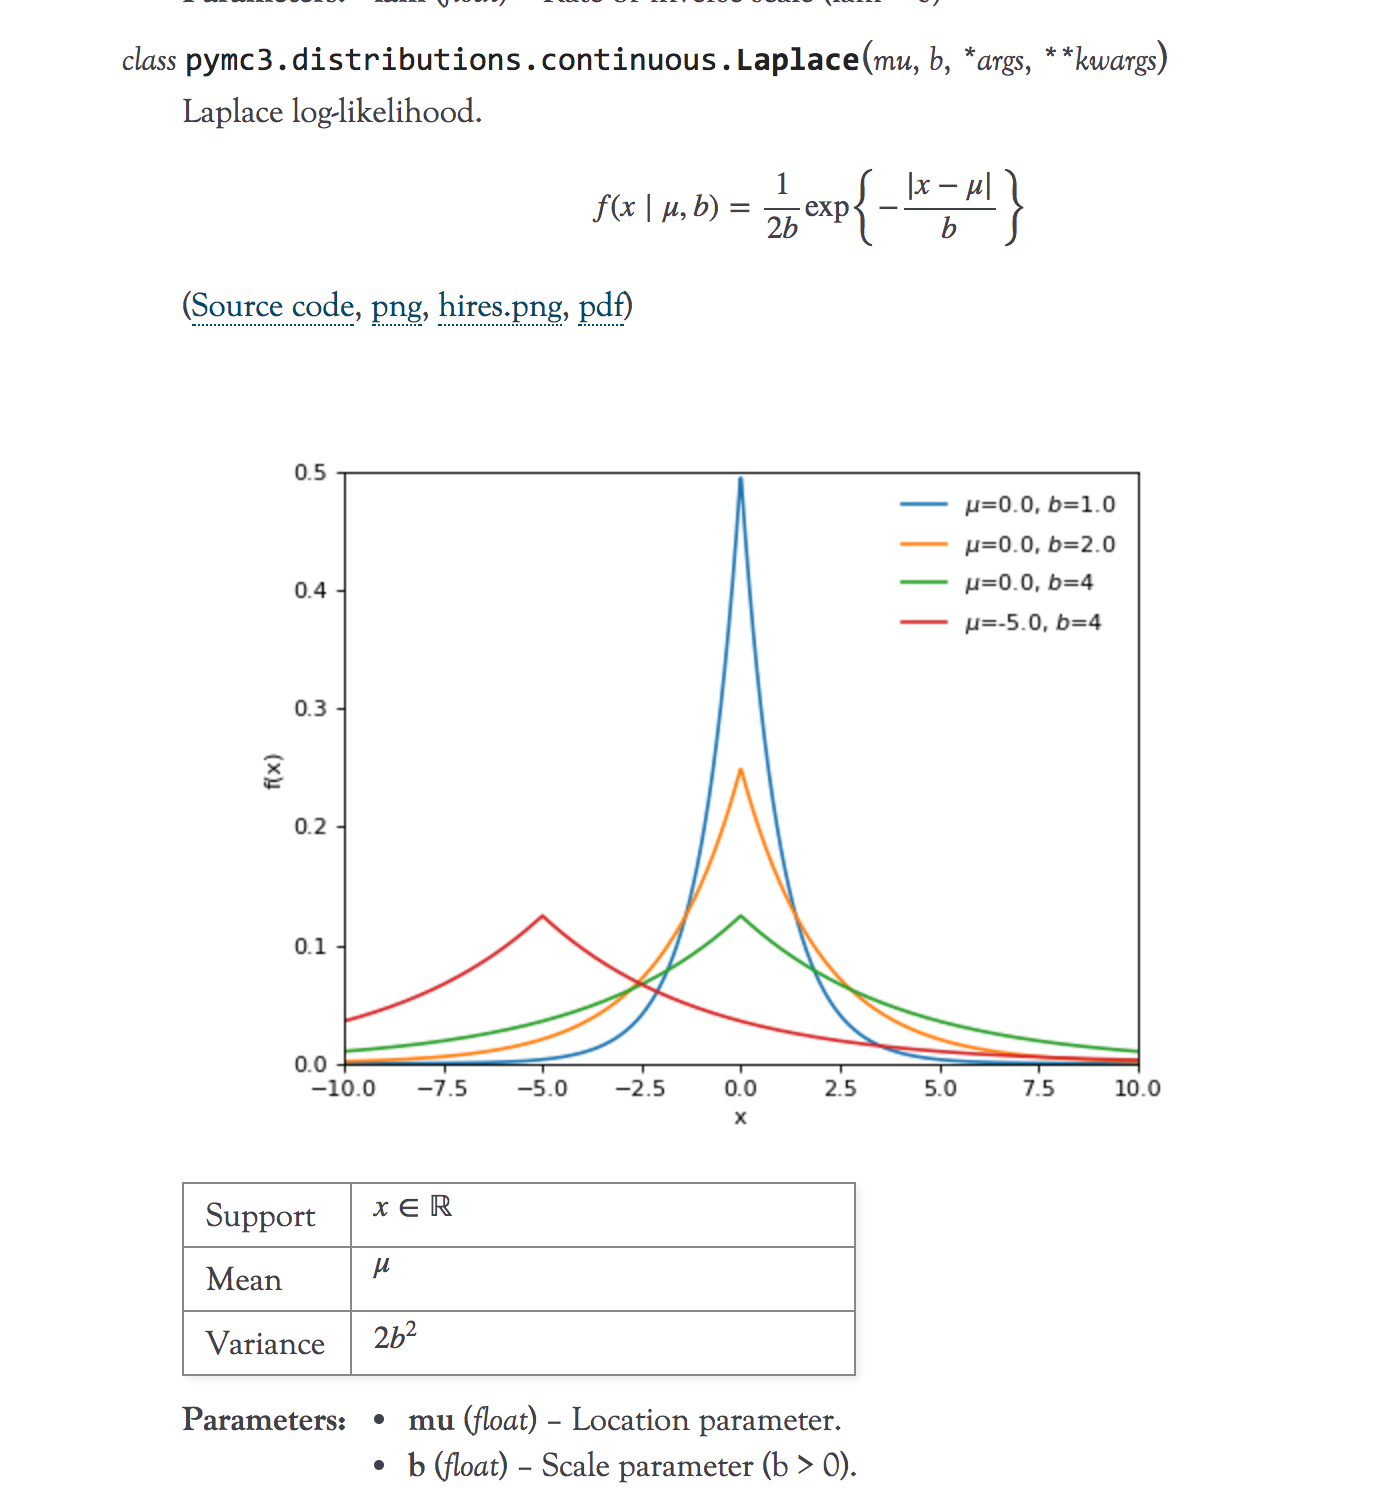
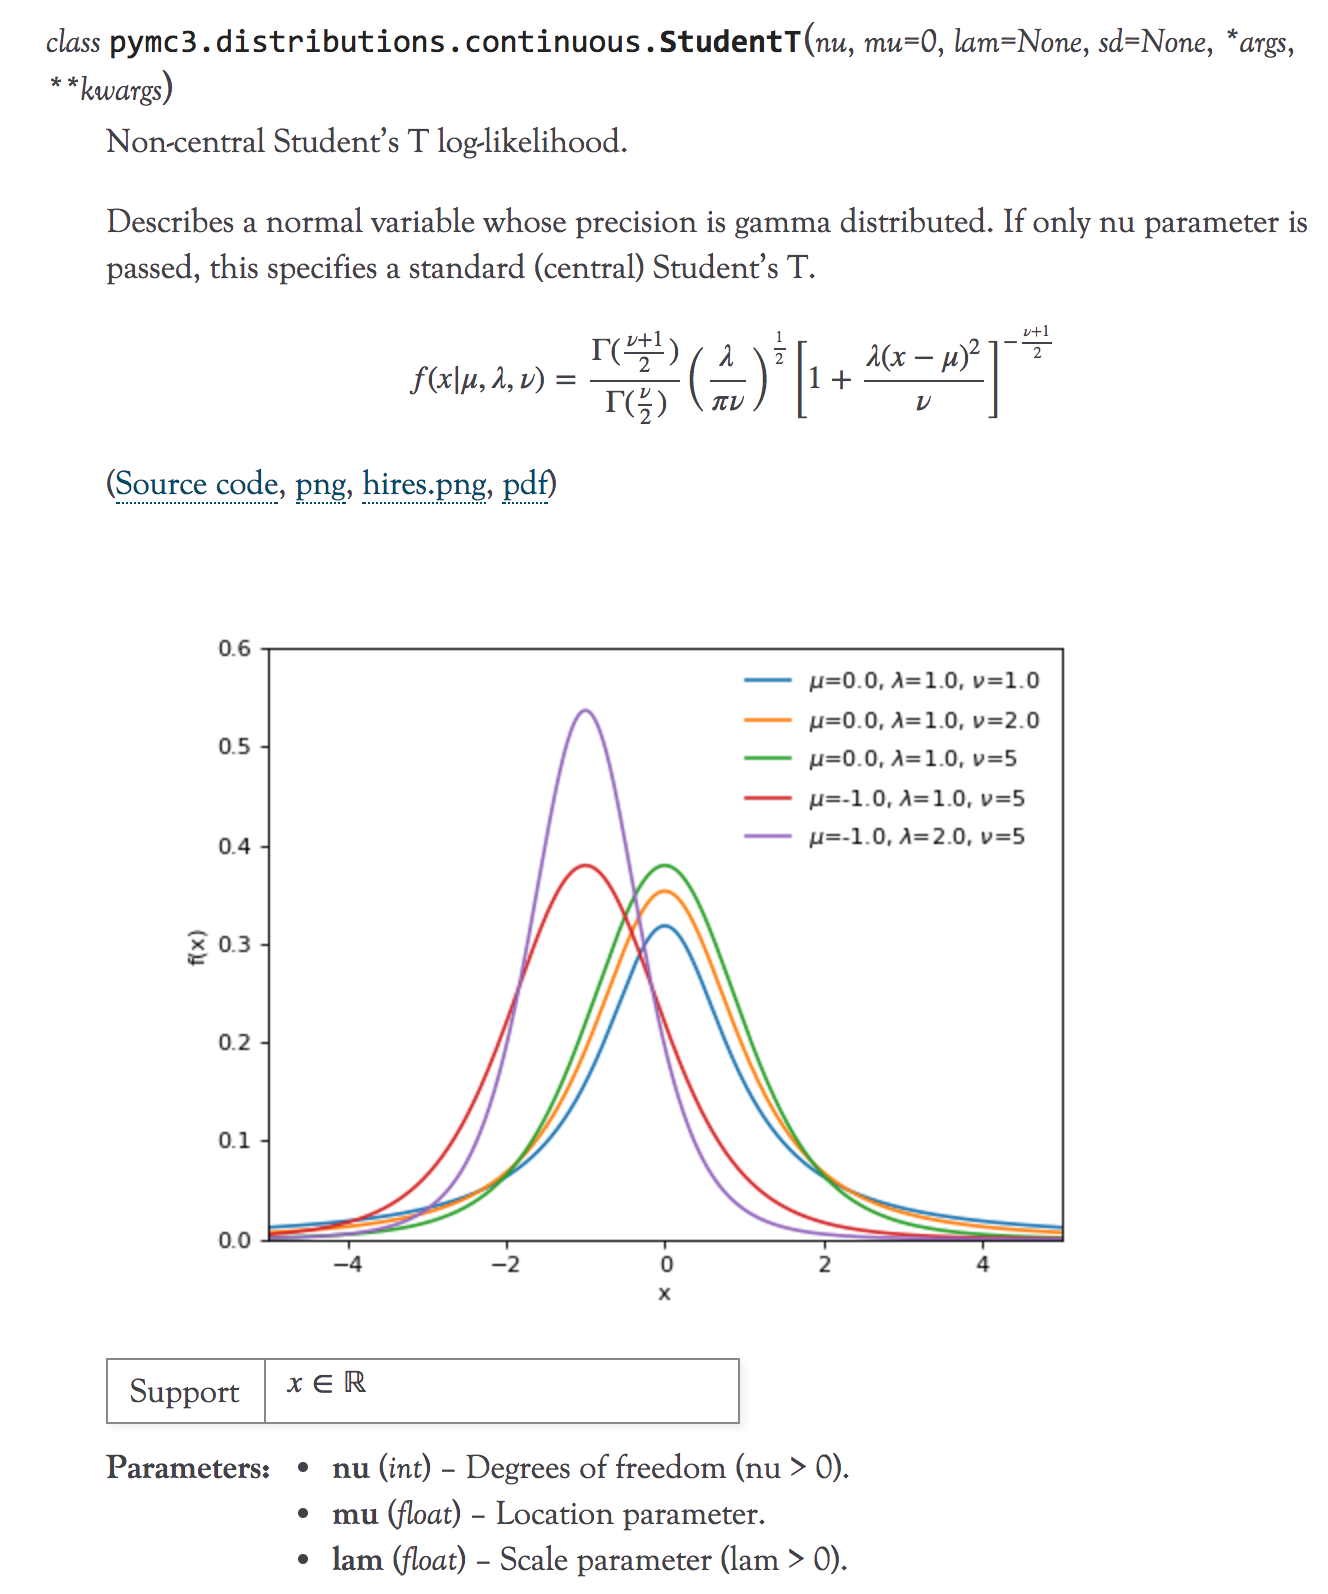
Plots of continuous distributions#2463
Merged
twiecki merged 4 commits intopymc-devs:masterfrom Aug 1, 2017
Merged
Conversation
Member
|
This is a nice idea - but a rst page in the doc might be better than in the docstring? |
Member
|
That's very cool. I think it makes sense to have this in the docs. |
twiecki
reviewed
Aug 1, 2017
pymc3/distributions/continuous.py
Outdated
| a, b = 0.0, 2.0 | ||
| y = np.zeros(1000) | ||
| y[(x<b) & (x>a)] = 1.0/(b-a) | ||
| plt.plot(x, y, label='lower=1, upper=2') |
Member
There was a problem hiding this comment.
if we moved to fig, ax = plt.subplots(); ax.plot()... we could save a few lines with ax.set(ylim=..., xlabel=...)
Member
|
do you have it run locally and if so can you post a screen-shot of what the rendered result looks like? |
Contributor
Author
|
Here you have a couple of screenshots. I guess the results depends on the version of matplotlib used for the docs, that I guess they are done automatically with Travis, right?
|
Member
|
I love it! |
Member
|
This is awesome! |
Member
|
This is better than most textbooks. Thanks for the contribution. |
This file contains hidden or bidirectional Unicode text that may be interpreted or compiled differently than what appears below. To review, open the file in an editor that reveals hidden Unicode characters.
Learn more about bidirectional Unicode characters
Sign up for free
to join this conversation on GitHub.
Already have an account?
Sign in to comment
5 participants
Add this suggestion to a batch that can be applied as a single commit.This suggestion is invalid because no changes were made to the code.Suggestions cannot be applied while the pull request is closed.Suggestions cannot be applied while viewing a subset of changes.Only one suggestion per line can be applied in a batch.Add this suggestion to a batch that can be applied as a single commit.Applying suggestions on deleted lines is not supported.You must change the existing code in this line in order to create a valid suggestion.Outdated suggestions cannot be applied.This suggestion has been applied or marked resolved.Suggestions cannot be applied from pending reviews.Suggestions cannot be applied on multi-line comments.Suggestions cannot be applied while the pull request is queued to merge.Suggestion cannot be applied right now. Please check back later.
This is a simple PR to add plots of continuous distributions in the documentation. This is something that I miss sometimes and I end up going to the Wikipedia for that. I think it's good to have it in the documentation.