This examples demonstrates how to create stories that allow for interaction between different widgets that have differnt that data sources on different platforms (e.g., use Tableau data to drive content in PowerPoint presentations).
In this specific example, we will be using linear regression analysis in a python script to create a widget shows a matplotlib chart, also use the resulting data to create a widget and update a widget that automates a presentation file (e.g. a PowerPoint document).
You can get started by cloning this repository from the command line:
git clone https://github.com/presalytics/Example--InteroperableStory.gitThen create a python virtual environment and install the required packages via pip:
python3 -m venv venv
. venv/bin/activate # venv\Scripts\activate.bat on Windows
pip install presalytics sklearn
Now, you environment is set up for the walk through below. If youre curious how this example works, you should read the sections on example.py and widget.py. If you want to get going quickly, jump ahead to running the commands to build the story in the command line.
This example uses the dummy analysis in the code below:
import presalytics
import matplotlib.pyplot as plt
from sklearn import datasets, linear_model
import numpy as np

# Use sklearn to generate a test dataset
x, y_prime, coef = datasets.make_regression(n_samples=30,
                                            n_features=1,
                                            n_informative=1,
                                            noise=500*np.random.rand(),
                                            coef=True,
                                            random_state=0)

# Add some more randomness to the generated dataset
y = (-1 if np.random.rand() < 0.5 else 1) * np.random.rand() * y_prime

# Run a linear regression on the dataset
lr = linear_model.LinearRegression(fit_intercept=False)
lr.fit(x, y, sample_weight=np.ones(len(x)))

#Build a trendline
x_arr = np.arange(x.min(), x.max())[:, np.newaxis]
y_predict = lr.predict(x_arr)

# Plot the Dataset
# Use `plt.subplots()` to ensure takes a `canvas` attribute
fig, ax = plt.subplots()
ax.scatter(x, y, color='red', marker='.')
ax.plot(x_arr, y_predict, color='black', linestyle='--')
ax.set_title('Example Analysis')
ax.set_xlabel('X-Axis')
ax.set_ylabel('Y-Axis')

# Calculate some metrics
r_squared = lr.score(x, y)
beta = lr.coef_[0]
This analysis is intended to be generic can be replaced by other analysis you do in a python script or Jupyter notebook.
The final line in analysis.py is the following:
example_plot = presalytics.MatplotlibResponsiveFigure(fig, "Regression Example")This line this the critical piece that allows this figure automatically interact with the Presaltyics API. Every the
Story Outline is updated, this instance of MatplotlibResponsiveFigure will update the parameters of the outline and push those data to the API. From the api, this analysis can be viewed and shared with others.
Please note the for the the
figvariable to work with theMatplotlibResponsiveFigureclass, it needs to haveCanvasattribute. Using theplt.subplots()command does this automatically.
The file widget.py in the example takes the metrics that were built in the analysis, and builds some contextual information that will be feed into an adjacent widget. This a common use case data sciencist and business analysts
need to summarize their analyses for a less technical audience. The Presaltyics Ooxml Automation services allows
users build templates in productivity software (e.g., PowerPoint, Google Slides). With this approach, analysts don't have to waste their time with html, and business users can build template for the analysts to populate. Let's take a look at what's happening in widget.py, across three sections of the script:
-
Generating Contextual Information About the Analysis
The first section of the imports the metrics from the
analysismodule, creates some variables that help user understand the signifance. These qualitative datapoints will be loading into widget instance in later steps. For example, the fit_quality variable provides a qualitative interpretatin for the correlation coeficient fromt the linear regression analysis.
# Build qualitative data from metrics to load into template widget
import presalytics
from analysis import (
    r_squared,
    beta,
)

fit_quality_lookup = (
    (.95, "wow!"),
    (.8, "pretty good"),
    (.7, "good-ish"),
    (.5, "so-so"),
    (.2, "meh"),
    (0, "bad")
)
fit_quality = next(x[1] for x in fit_quality_lookup if r_squared >= x[0])
trend = "positive" if beta > 0 else "negitive"
if trend == "negitive":
    header_color = "FF0000"  # Red Hex color
else:
header_color = "00FF00" # Green Hex Color-
Creating Dynamic Parameters for a Widget
The second section of
widget.pyconditions data so that it can be loaded into a widget in widget insance in the proceeding. Some that
# Set that parameters for a `prealtyics.MultiXmlTransform` XmlTransform
params = {"transforms_list": [
    {
        'name': 'TextReplace',
        'function_params': {
            'trend': trend,
            'beta': str(round(beta, 2)),
            'r_squared': str(round(r_squared * 100, 2)) + "%",
            'fit_quality': fit_quality
        },
    },
    {
        'name': 'ChangeShapeColor',
        'function_params': {
            'hex_color': header_color,
            'object_name': "header"  # From the 'Selection Pane' of PowerPoint
        }
    }
]}
# Collect data from the Presaltyics API so the OoxmlEditorWidget can dynamically update
story_id = presalytics.StoryOutline.import_yaml("story.yaml").story_id
client = presalytics.Client()
story = client.story.story_id_get(story_id, include_relationships=True)
document_ooxml_id = story.ooxml_documents[0].ooxml_automation_id
document_tree = client.ooxml_automation.documents_childobjects_get_id(document_ooxml_id)

takeaway_box_id = next(o.entity_id for o in document_tree if o.entity_name == "TakeawayBox")
The last few lines of this script look collect information from the Presaltyics API. Some items in this script refer to objects that API that will be build a after we create them on the command line. In short, these lines pull the story_id from the the outline
in the workspace to create a Client instance. The client then traverses the document tree of an uploaded template.pptx file
to get the id of the "TakeawayBox" object. The presalytics middleware can the takeaway_box_id to construct urls and make API calls against the Ooxml Automation service.
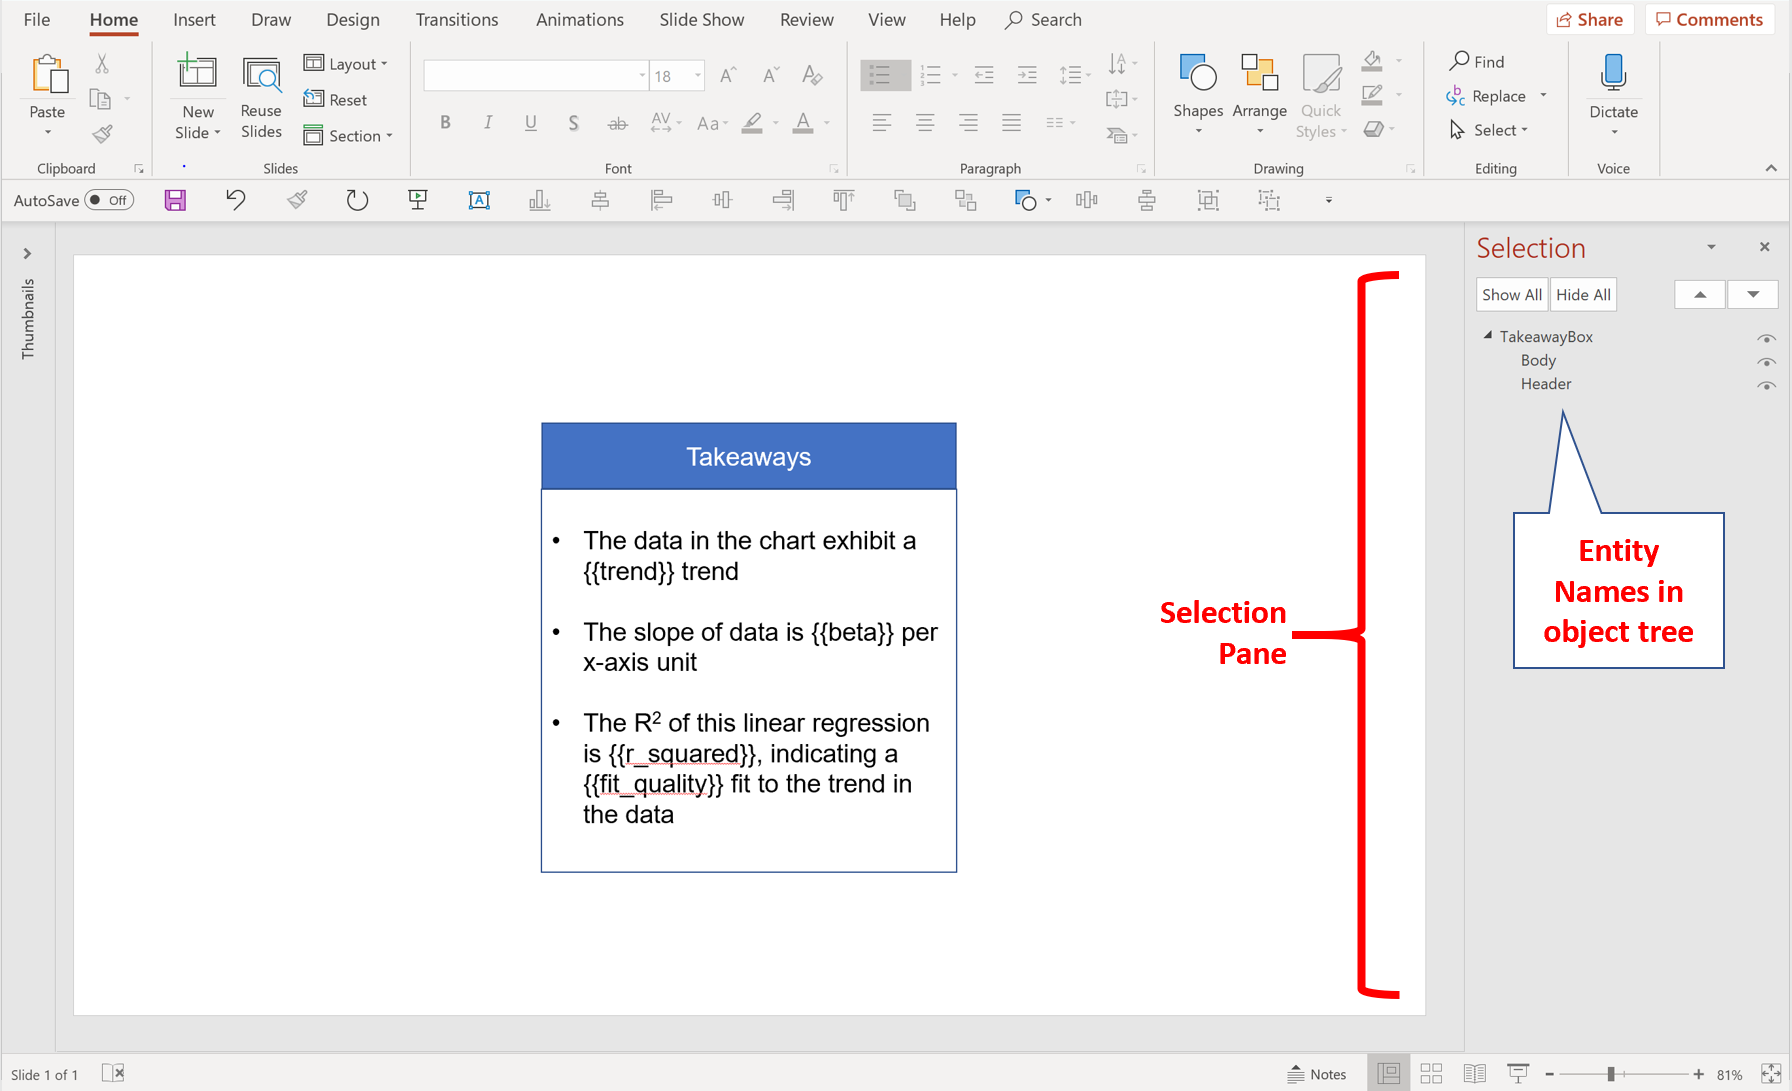
Understanding how to traverse the document tree is important. When looking at
template.pptxin PowerPoint, the entity names of objects in the object tree are shown in the selection pane. You can open the selection pane by click the "Select" button on the "Home" tab in the ribbon. An image showing how to identify names intemplate.pptx's object tree is shown below:
If you don't have access to PowerPoint, you can use the python interpreter to navigate the object tree using the presalytics API. The example code below will print out your object tree in the python interactive terminal:
      >>> import presalytics
      >>> story_id = presalytics.StoryOutline.import_yaml('story.yaml')
      >>> client = presalytics.Client()
      >>> story = client.story.story_id_get(story_id, include_relationships=True)
      >>> ooxml_document_id = story.ooxml_documents[0].ooxml_automation_id
      >>> object_tree = client.ooxml_automation.documents_childobjects_get_id(ooxml_document_id)
      >>> [print(entity) for entity in object_tree]
A similar function is avaiable in LibreOffice under View > Navigator. But, Google Slides, unfortunately, makes it really difficult to get this information. The Ooxml Automation service is much simpler to use.
-
Creating the Widget Instance
The final line of creates an instance of an OoxmlEditorWidget. Similar to the final line in
analysis.py, the widget wraps middleware around the script and automates the Story's interaction with the Presaltyics API.
template_widget = presalytics.OoxmlEditorWidget(
    "Takeaways Box",
    story_id,
    takeaway_box_id,
    presalytics.OoxmlEndpointMap.group(),
    presalytics.MultiXmlTransform,
    transform_params=params
)Running a few commands from the bash terminal (or windows command line) can he
- Create a
config.pyfile:
presalytics config {YOUR_USERNAME} -s RESERVED_NAMES=widget.py This command will create a new file, name
config.pyin your current working directory. Using theRESERVED_NAMESinstructs the the Presalytics library not to evaluatewidget.pyfor the time being. For more information on configuration options, please see the configuration documentation.
- Create a Story in the Presalytics API
presalytics create "Regression Example" --widgetThis command will generate story from widget defined in
analysis.py. After this command compltes successfully, you should see a file calledstory.yamlin your current working directory that contains the Story Outline data for this Story.
- Add the Template to the new Story
presalytics ooxml template.pptx addThis command uploads
template.pptxto the Presalyics API and add reference to document on the Story object in the Story service.
- Update configuration to include
widget.py
presaltyics config {YOUR_USERNAME} --overwriteThis command removes the
RESERVED_NAMESsetting fromconfig.py.
- Add a the Widget To the Story Outline
presalytics modify -n "Takeaways Box" addThis command adds the widget from
widget.pyto the first page of the Story Outline instory.yaml
- Patch the page to display both charts and add a page title
presalytics modify --patch "{'op':'replace','path':'/pages/0/kind','value':'TwoUpWithTitle'}" patch
presalytics modify --patch "{'op':'add','path':'/pages/0/additionalProperties','value': {'title': 'Example Interoperable Story'}}" patch
These commands change the page template so that the two widgets will display side-by-side on your screen when viewing the story.
- Save and View Your Story
The command below pushes the updated story to the Presaltyics API service, and shows the result on presaltyics.io in a new browser tab:
presalytics --view push --updateYou're all set!
The command line interface to the presalytics API is simple and powerful way to interact with the presaltyics serivce. With this workspace, you can now automate updates to your analysis with a task scheduler like Cron for Linux systems, Windows Task Scheduler, or a task-runner like (Celery)[http://www.celeryproject.org/]. These services can be used in conjuction with the Presaltyics API either client-side or server-side.
This example walks users through how to build s Story using the presalytic and the command line interface. This basic example demonstrates the tools commonly used for building stories, adding widgets containing different analyses, and updating Story Outlines from the command line.
If you have any questions about this example or would like help with your use case, please shoot us an email at [email protected].