perf: reduce cacheline ping pong in workers availability#23287
perf: reduce cacheline ping pong in workers availability#23287pepyakin wants to merge 2 commits into
Conversation
|
|
derek bench otlp=false blocks=big |
|
cc @pepyakin ✅ Benchmark complete! View job Benchmark Results
59 big blocks Wait Time BreakdownPersistence Wait
Trie Cache Update Wait
Execution Cache Update Wait
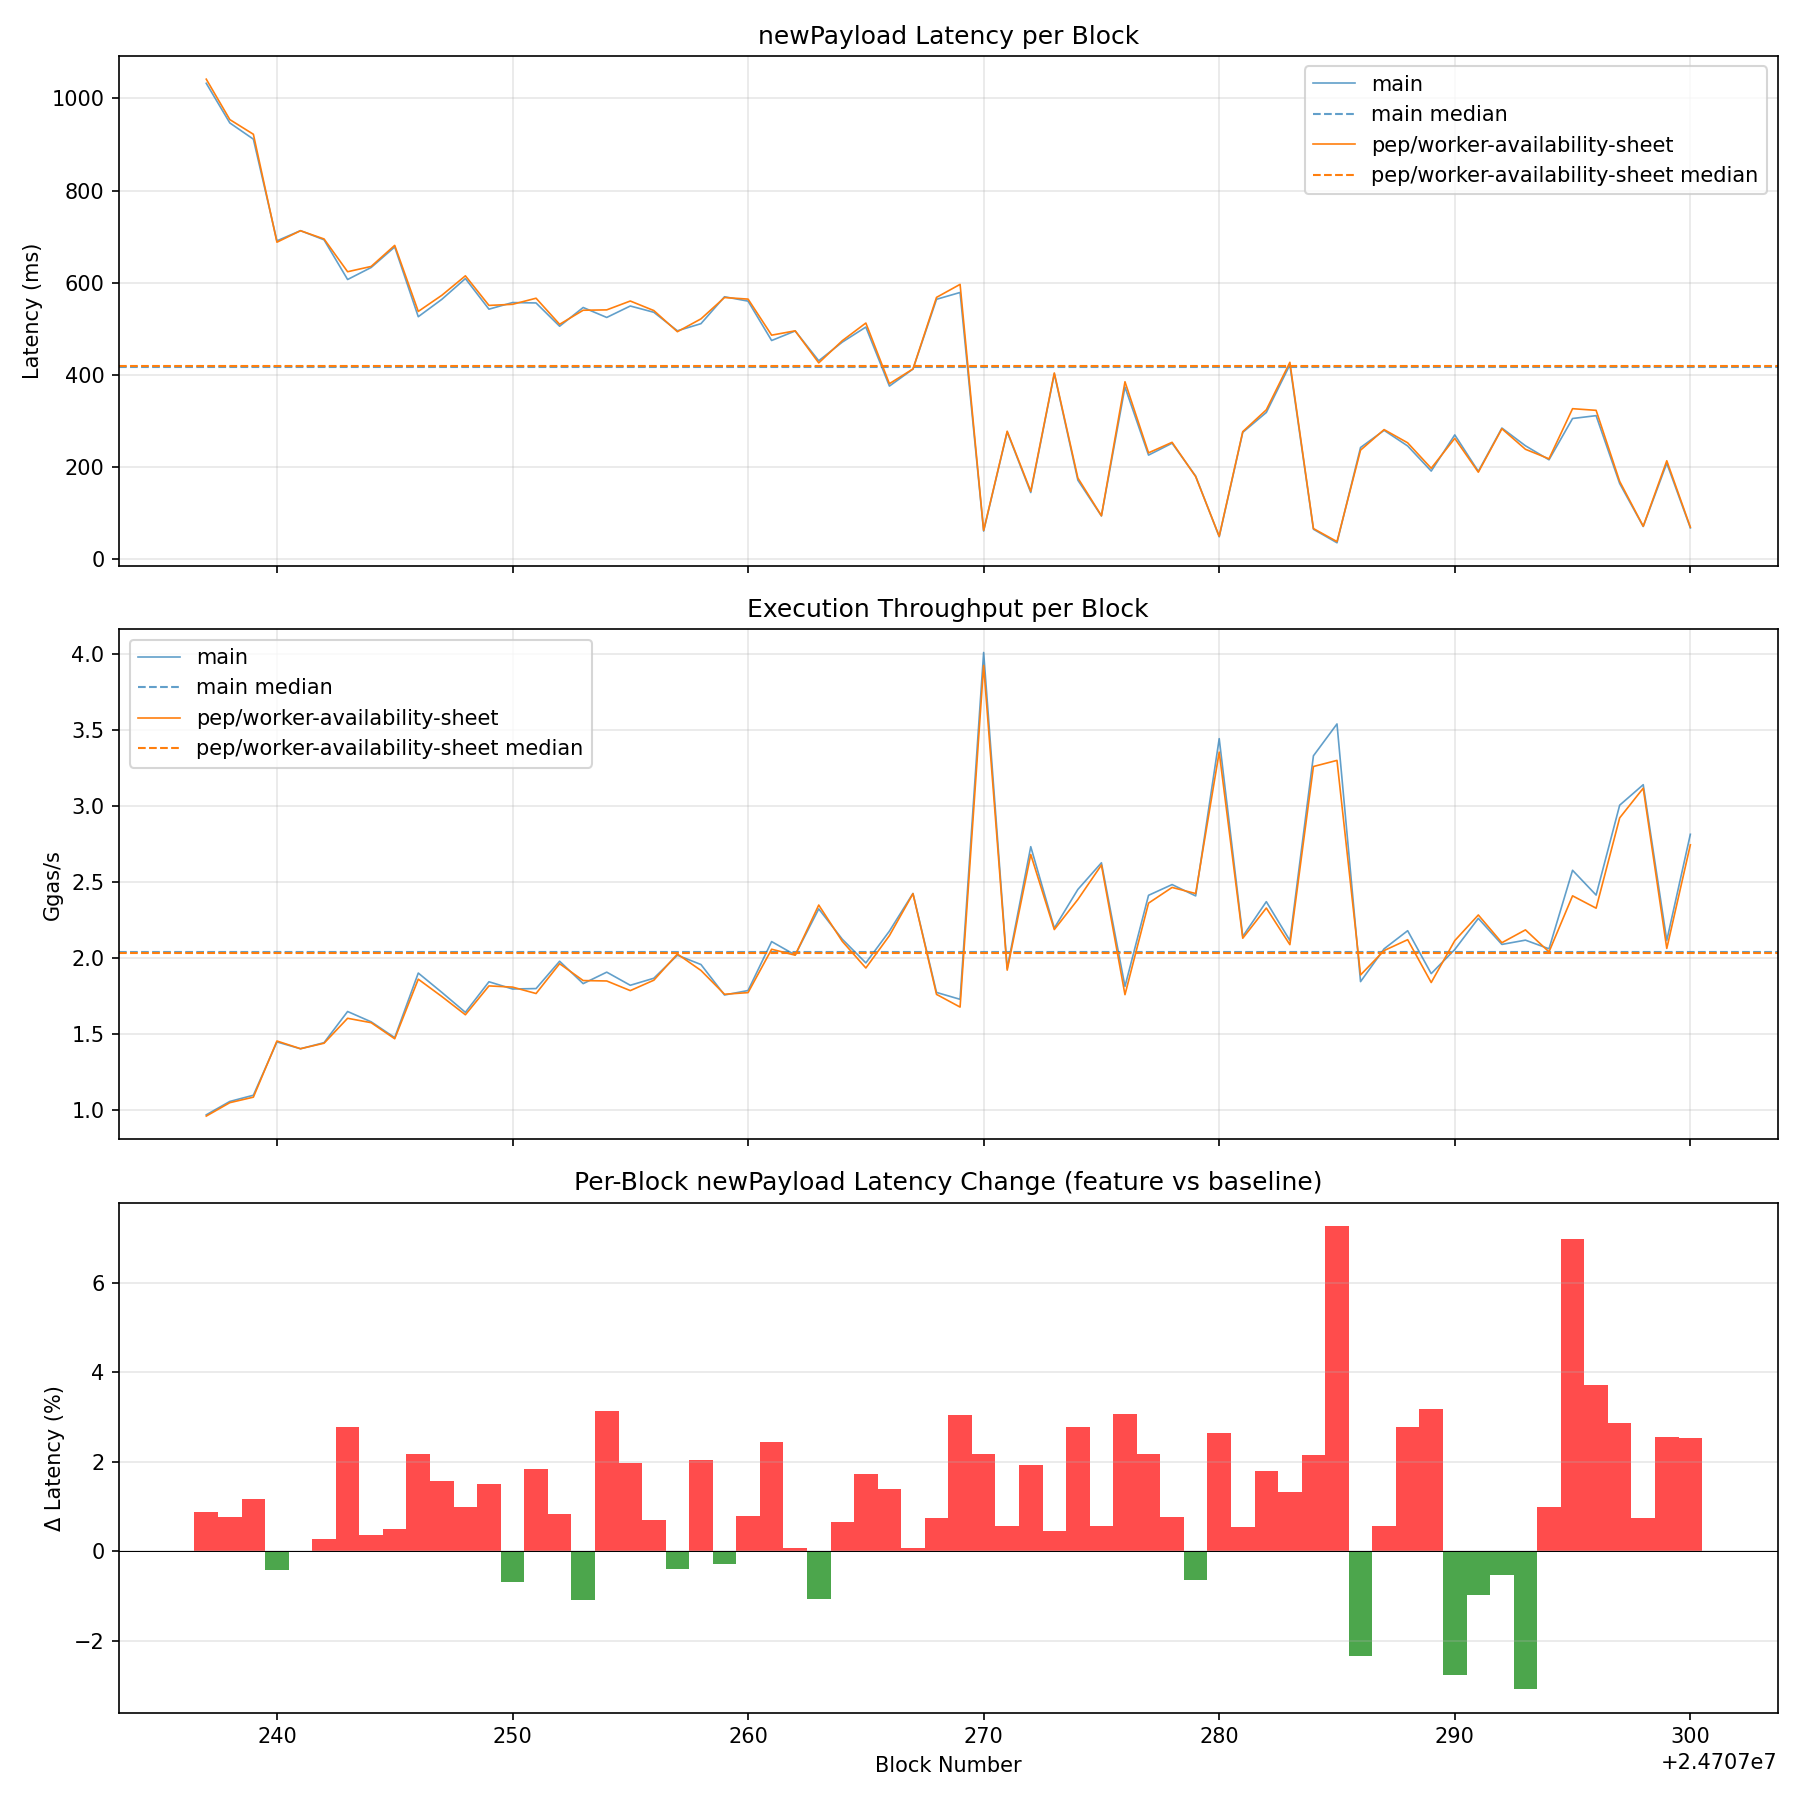
ChartsLatency, Throughput & Diff
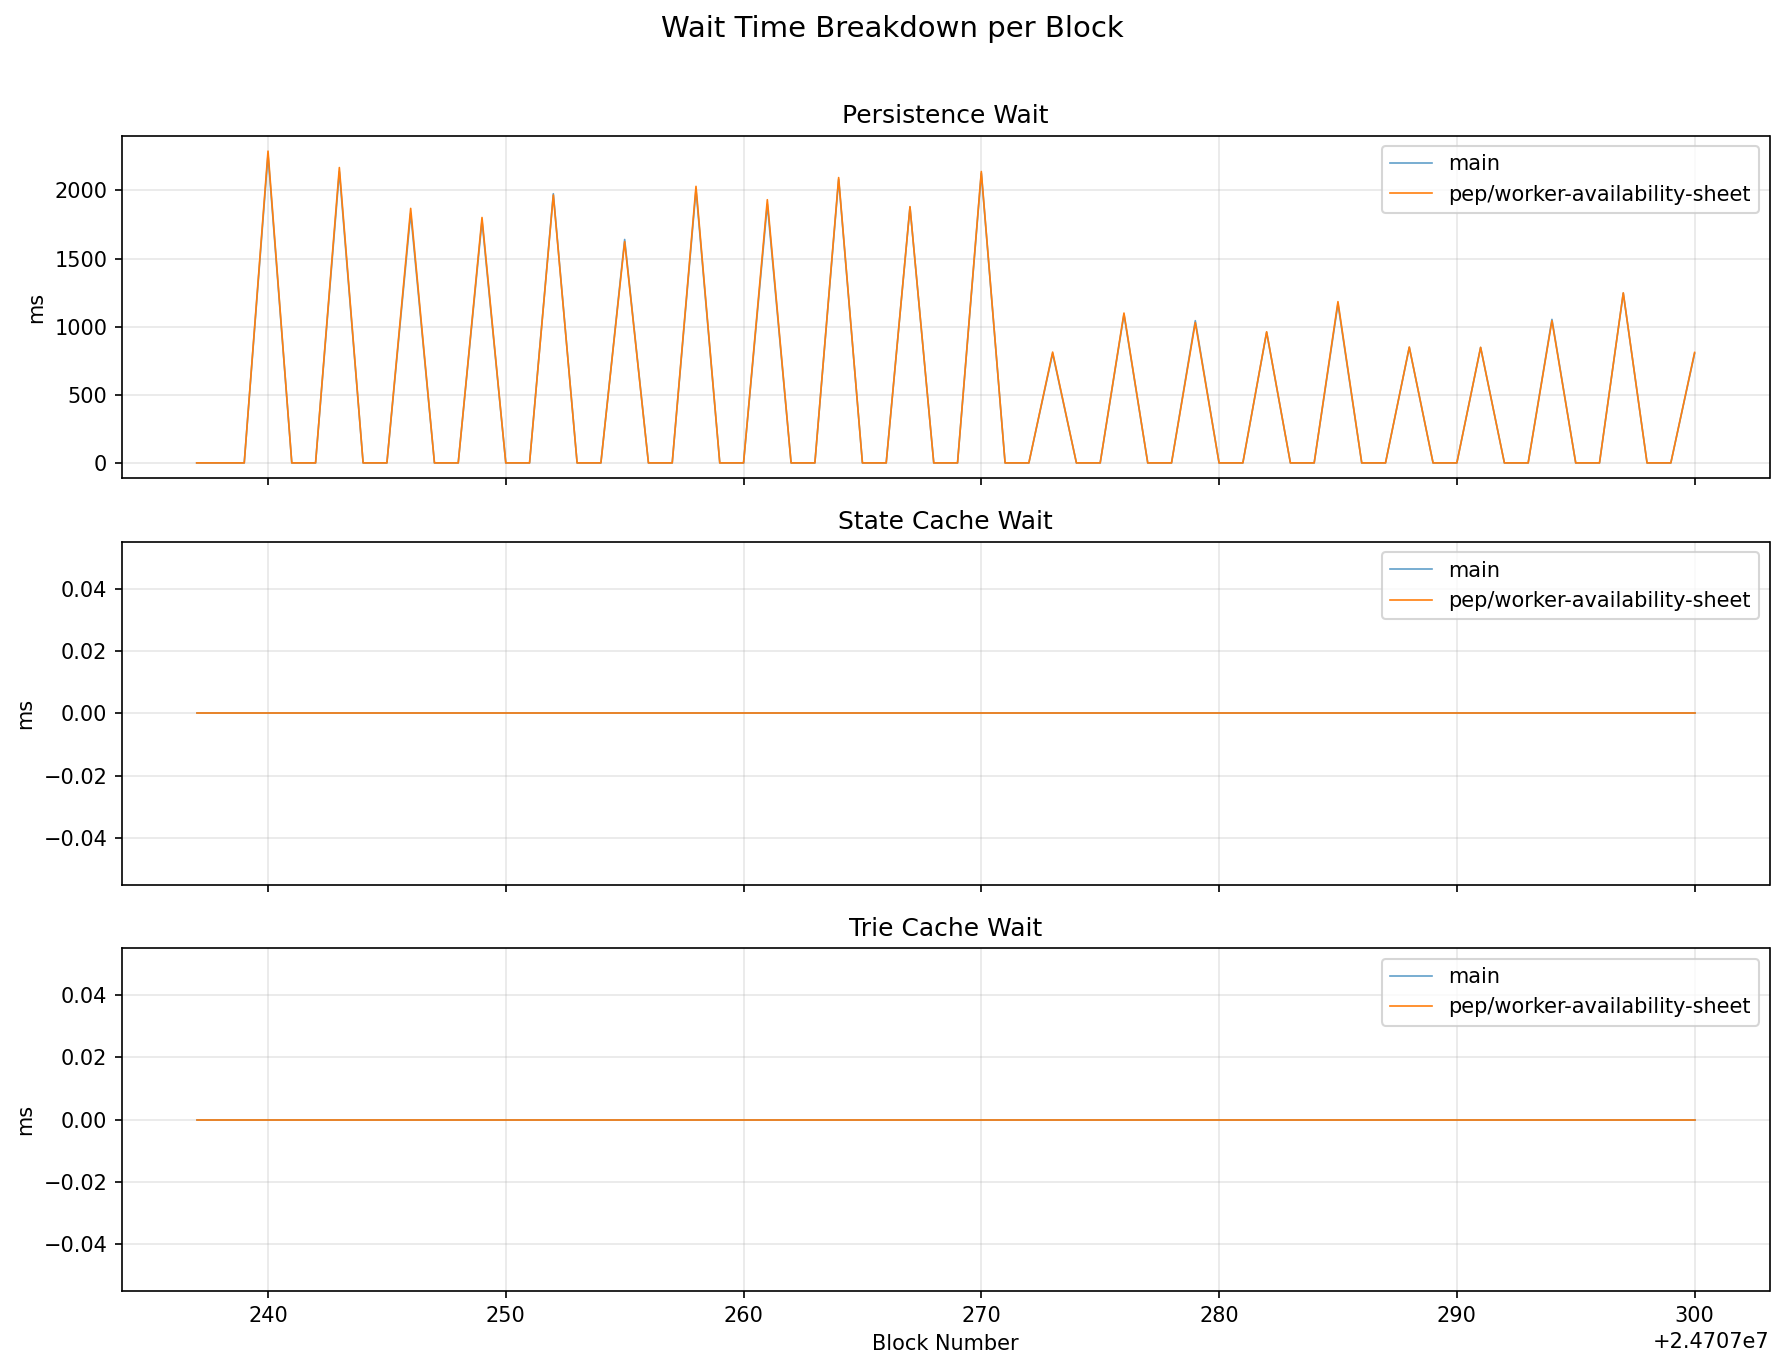
Wait Time Breakdown
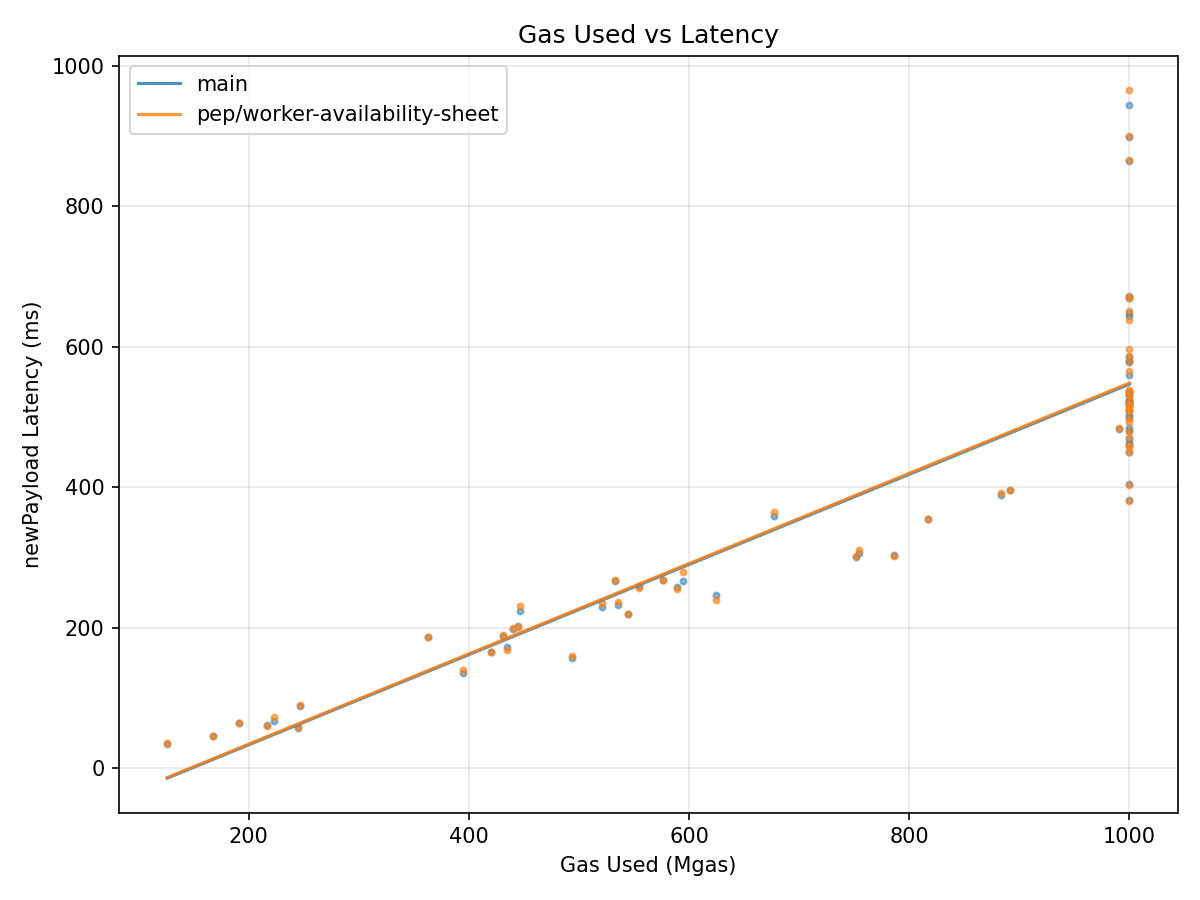
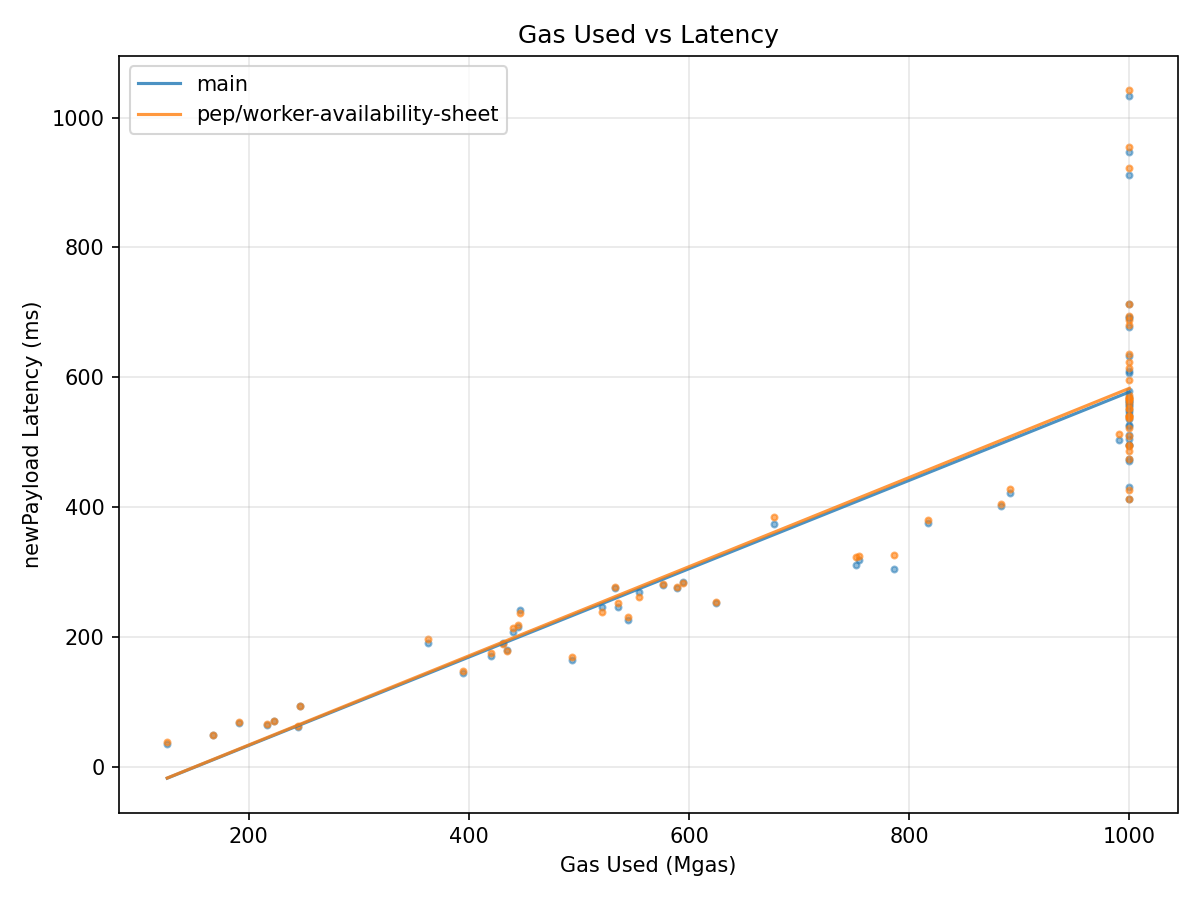
Gas vs Latency
Grafana Dashboard |

|
derek bench otlp=false blocks=big |
|
cc @pepyakin ✅ Benchmark complete! View job Benchmark Results
59 big blocks Wait Time BreakdownPersistence Wait
Trie Cache Update Wait
Execution Cache Update Wait
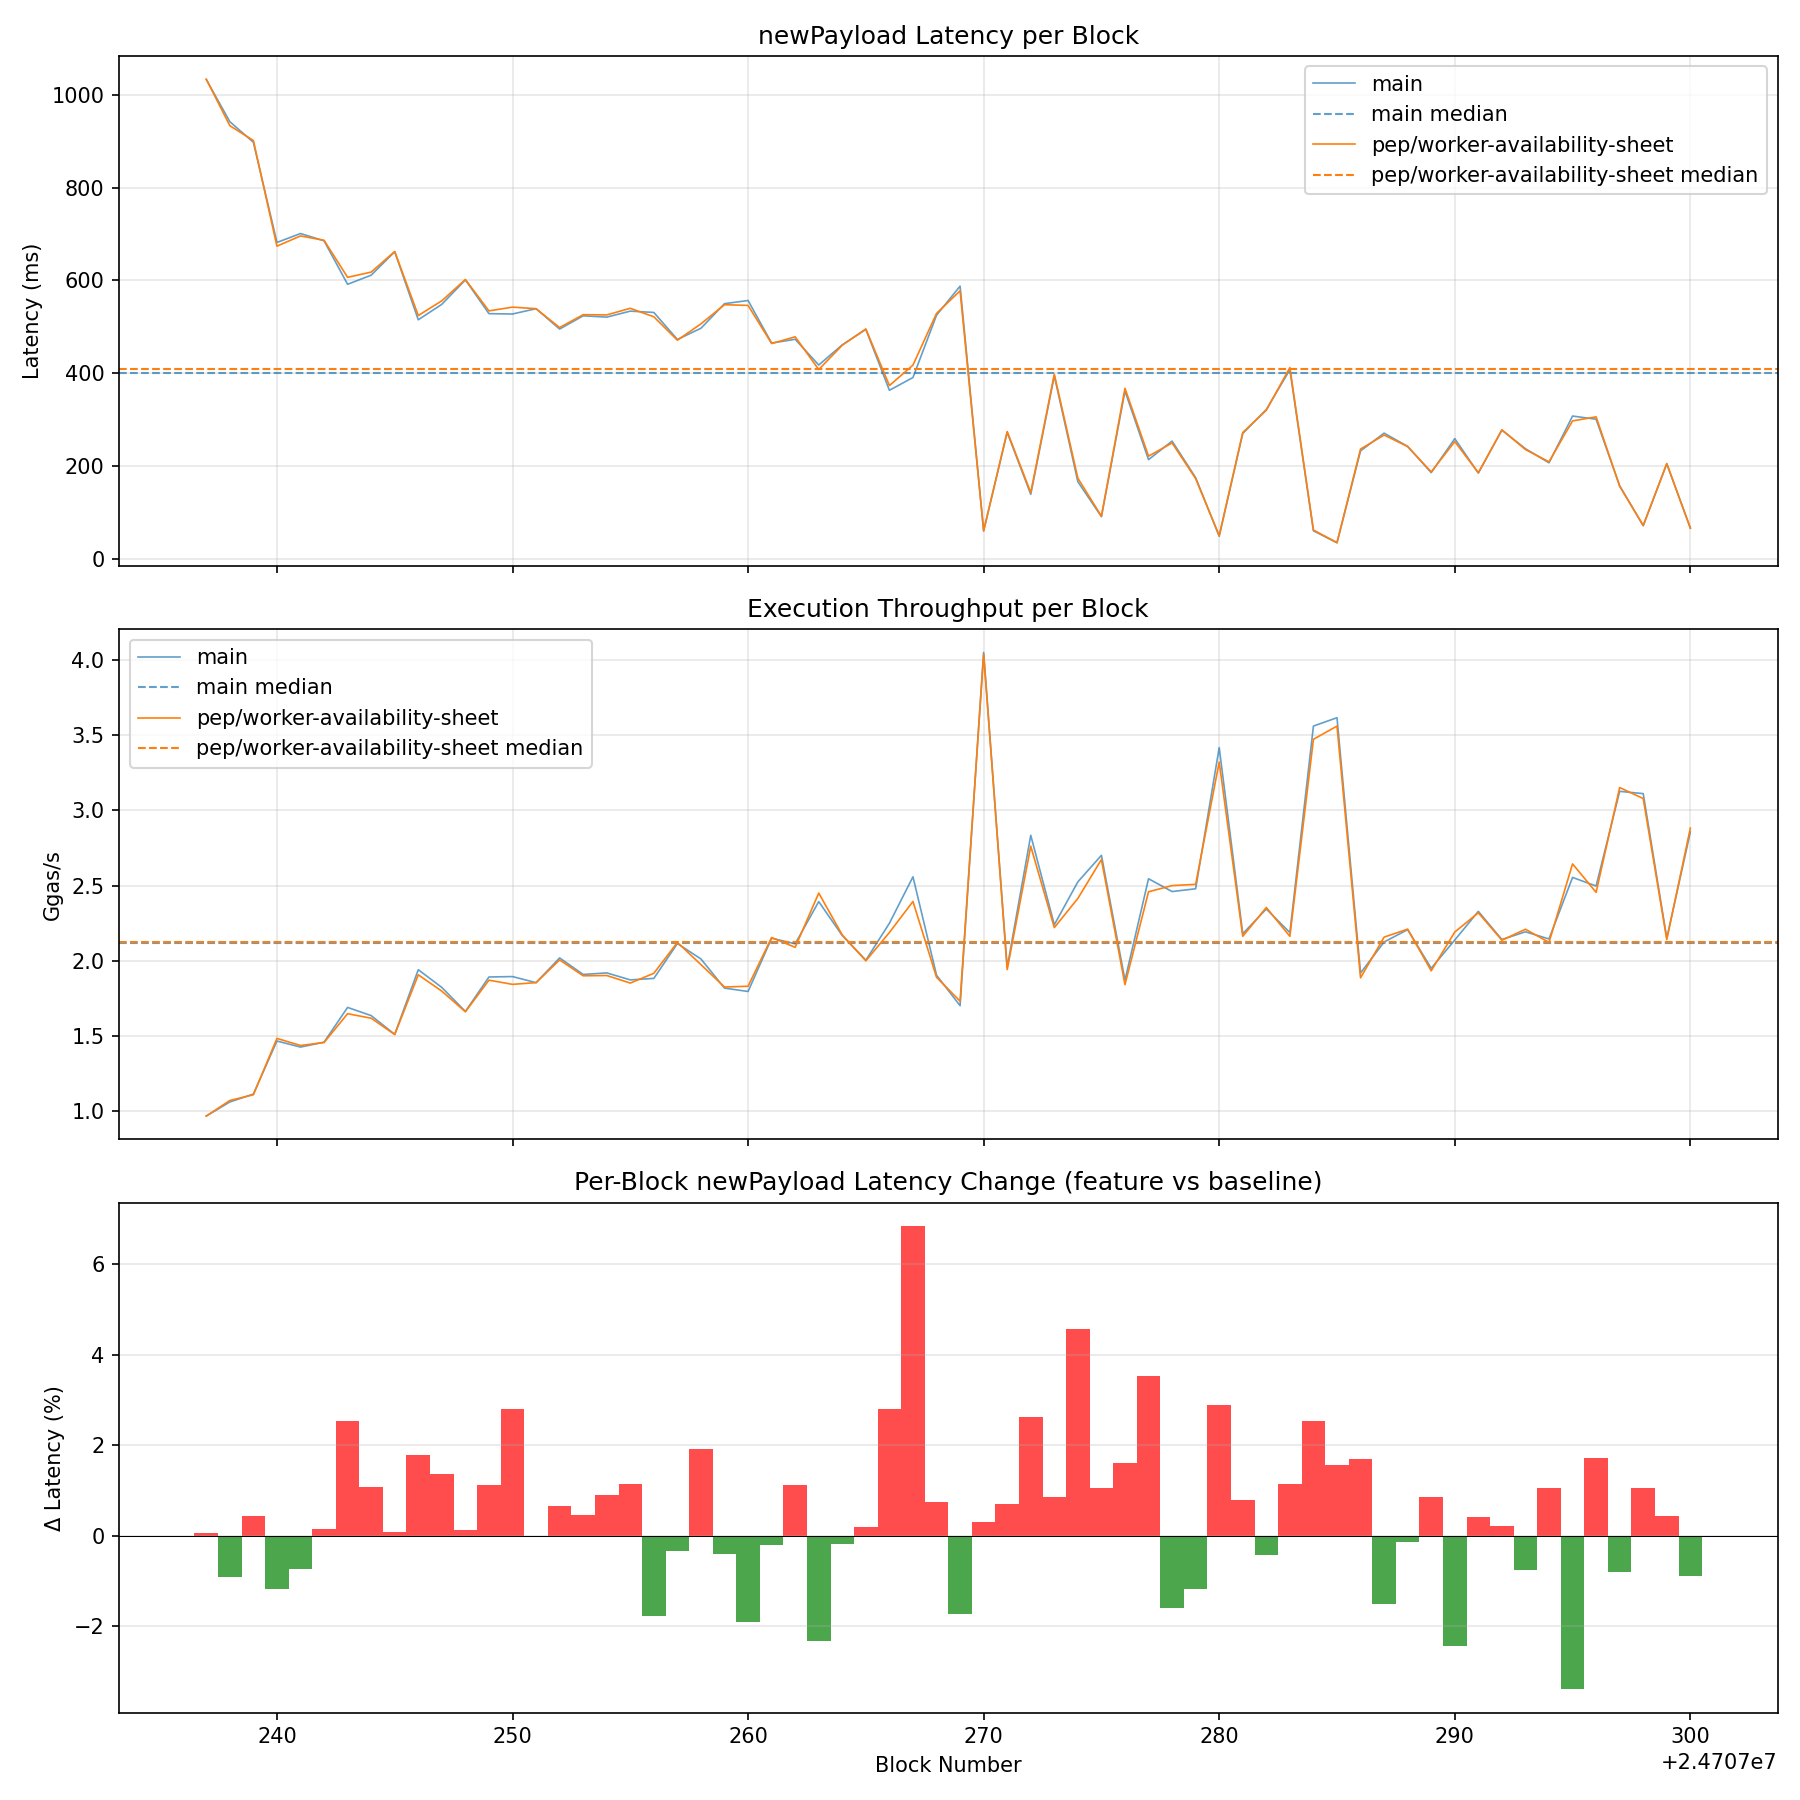
ChartsLatency, Throughput & Diff
Wait Time Breakdown
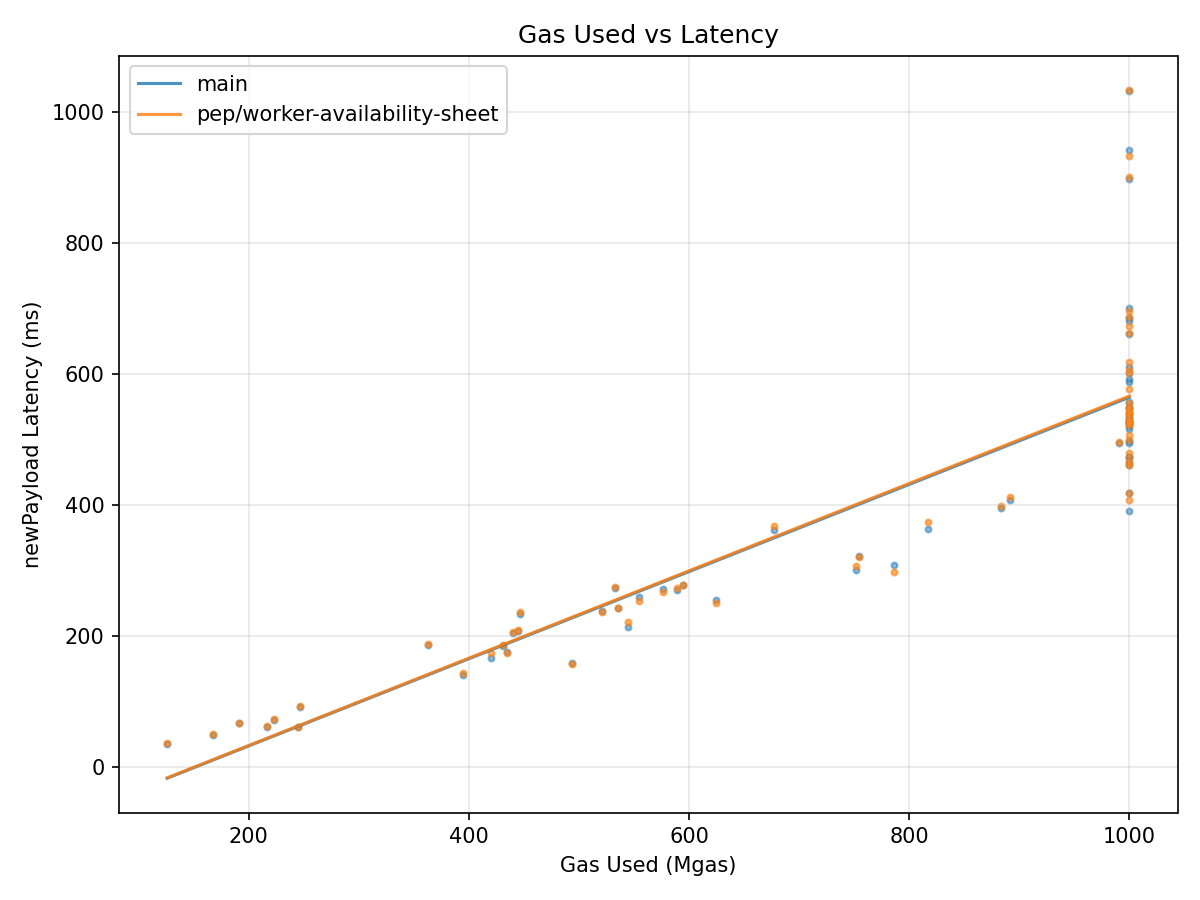
Gas vs Latency
Grafana Dashboard |

| self.proof_worker_handle.available_account_workers(), | ||
| self.proof_worker_handle.available_storage_workers(), | ||
| self.proof_worker_handle.has_multiple_idle_account_workers(), | ||
| self.proof_worker_handle.has_multiple_idle_storage_workers(), |
There was a problem hiding this comment.
these are both called eagerly but may be discarded inside of the function, can also be optimized to compute lazily if you think that could help
a363ddc to
8157dbb
Compare
|
derek bench otlp=false blocks=big |
|
cc @pepyakin ✅ Benchmark complete! View job Benchmark Results
64 big blocks Wait Time BreakdownPersistence Wait
Trie Cache Update Wait
Execution Cache Update Wait
ChartsLatency, Throughput & Diff
Wait Time Breakdown
Gas vs Latency
Grafana Dashboard |

|
derek bench otlp=false blocks=big |
|
cc @pepyakin ✅ Benchmark complete! View job Benchmark Results
64 big blocks Wait Time BreakdownPersistence Wait
Trie Cache Update Wait
Execution Cache Update Wait
ChartsLatency, Throughput & Diff
Wait Time Breakdown
Gas vs Latency
Grafana Dashboard |

|
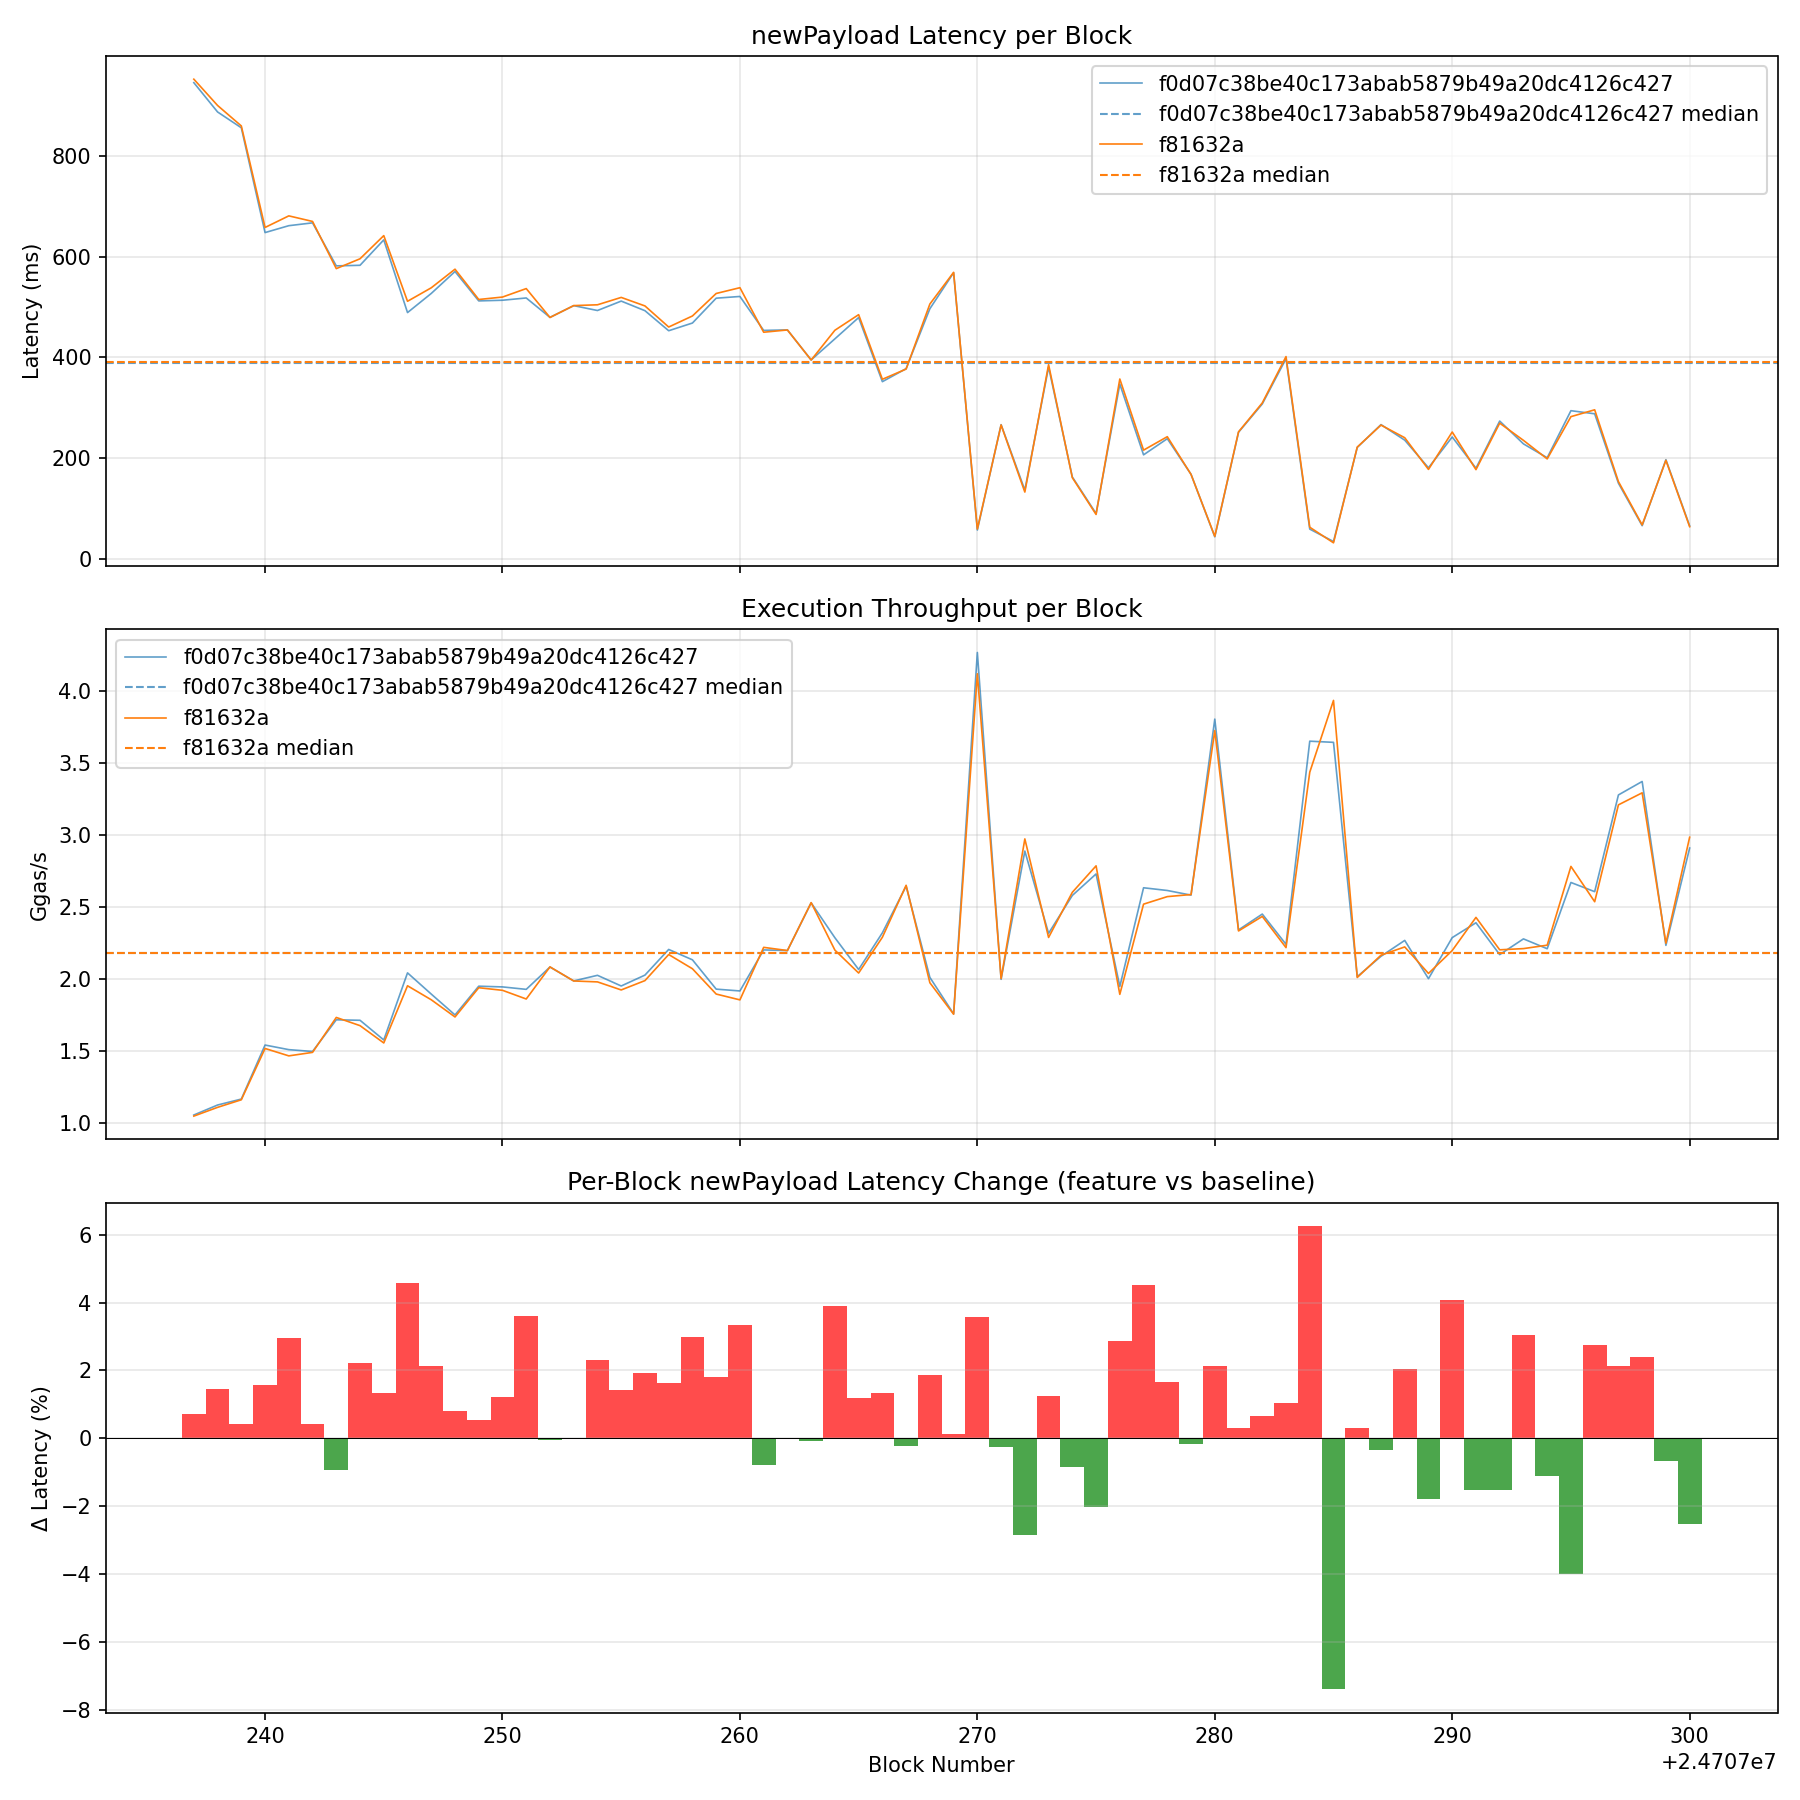
derek bench otlp=false blocks=big baseline=f0d07c38be40c173abab5879b49a20dc4126c427 feature=f81632a |
|
cc @pepyakin ✅ Benchmark complete! View job Benchmark Results
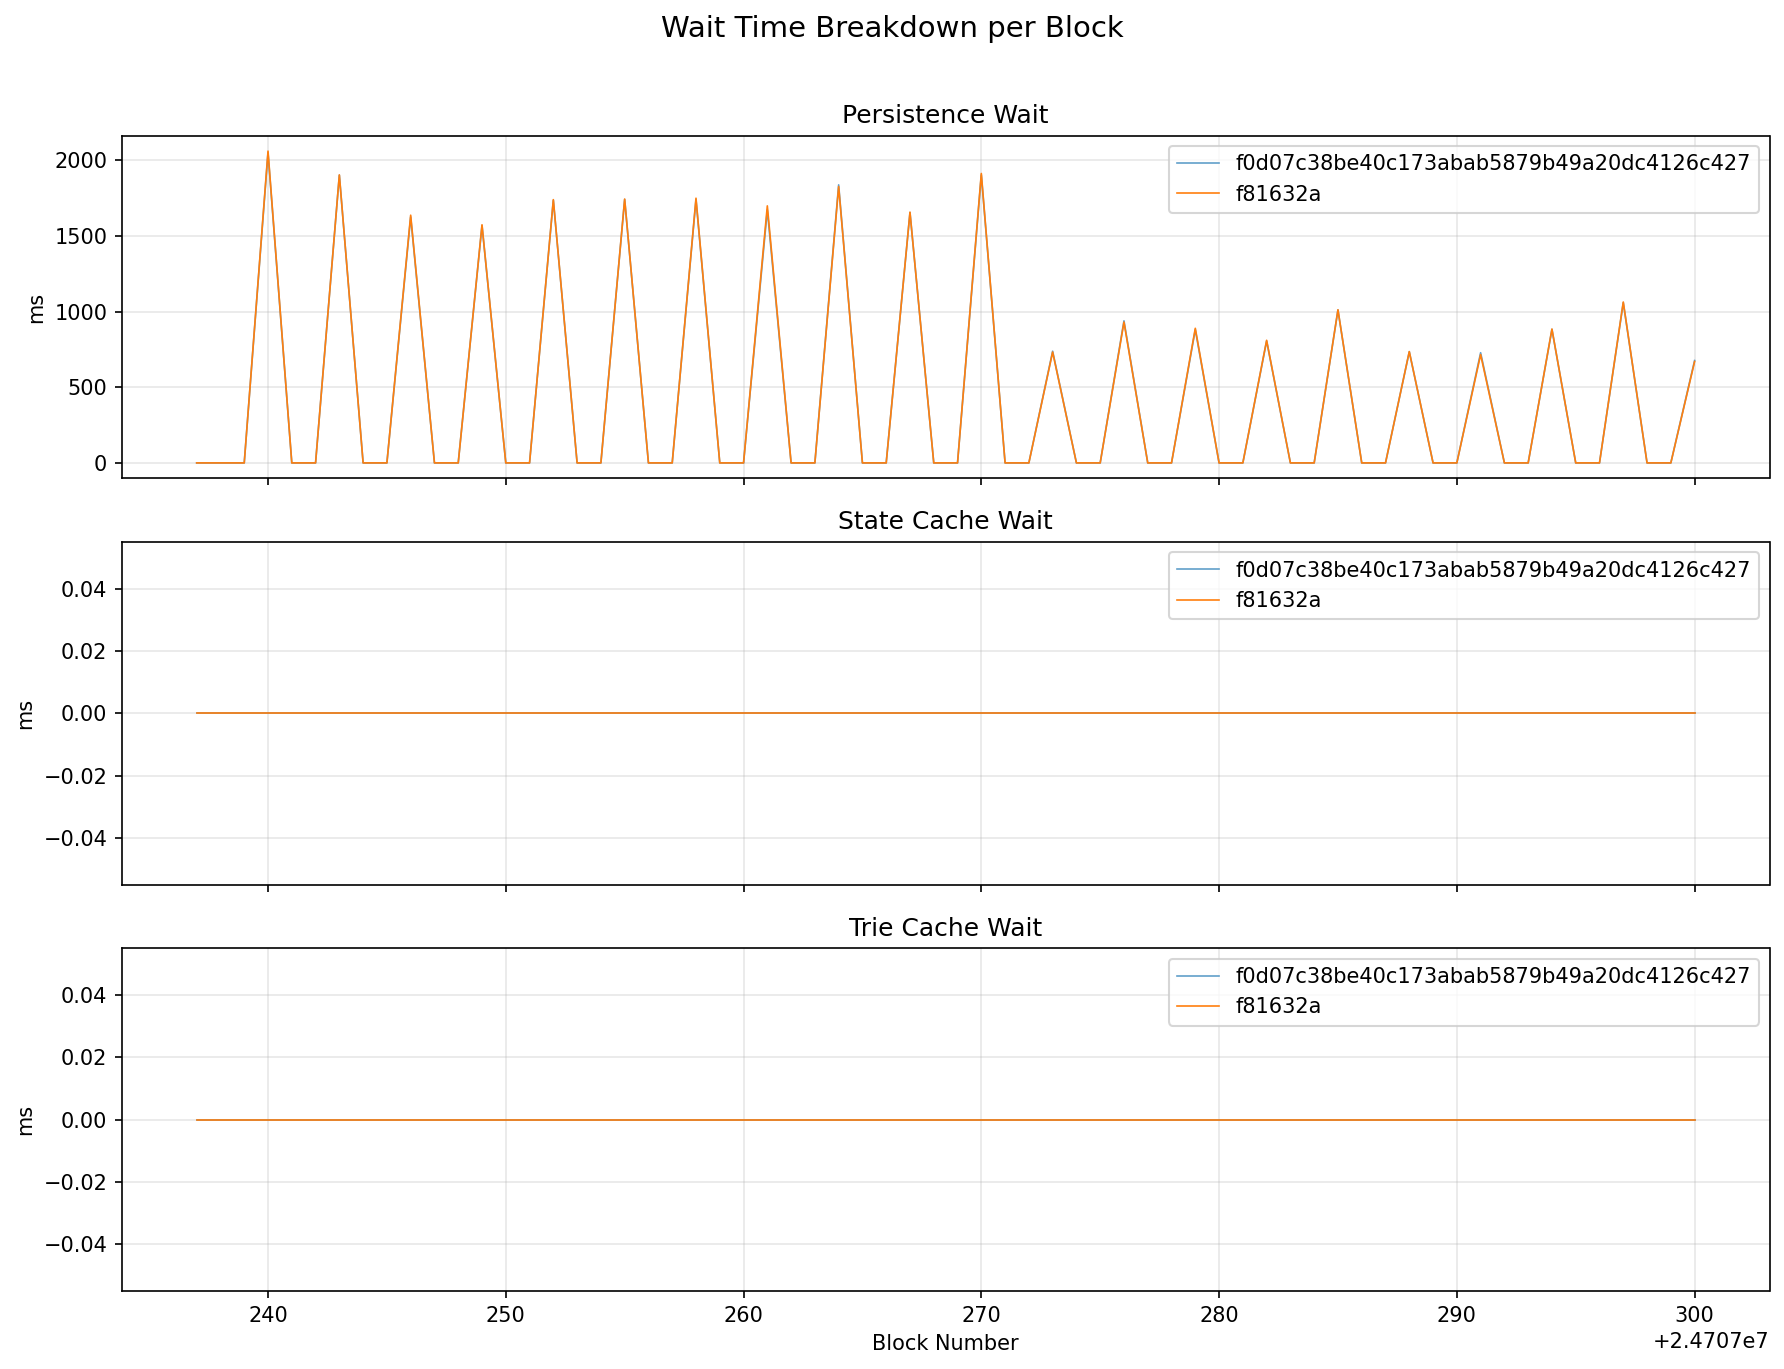
64 big blocks Wait Time BreakdownPersistence Wait
Trie Cache Update Wait
Execution Cache Update Wait
ChartsLatency, Throughput & Diff
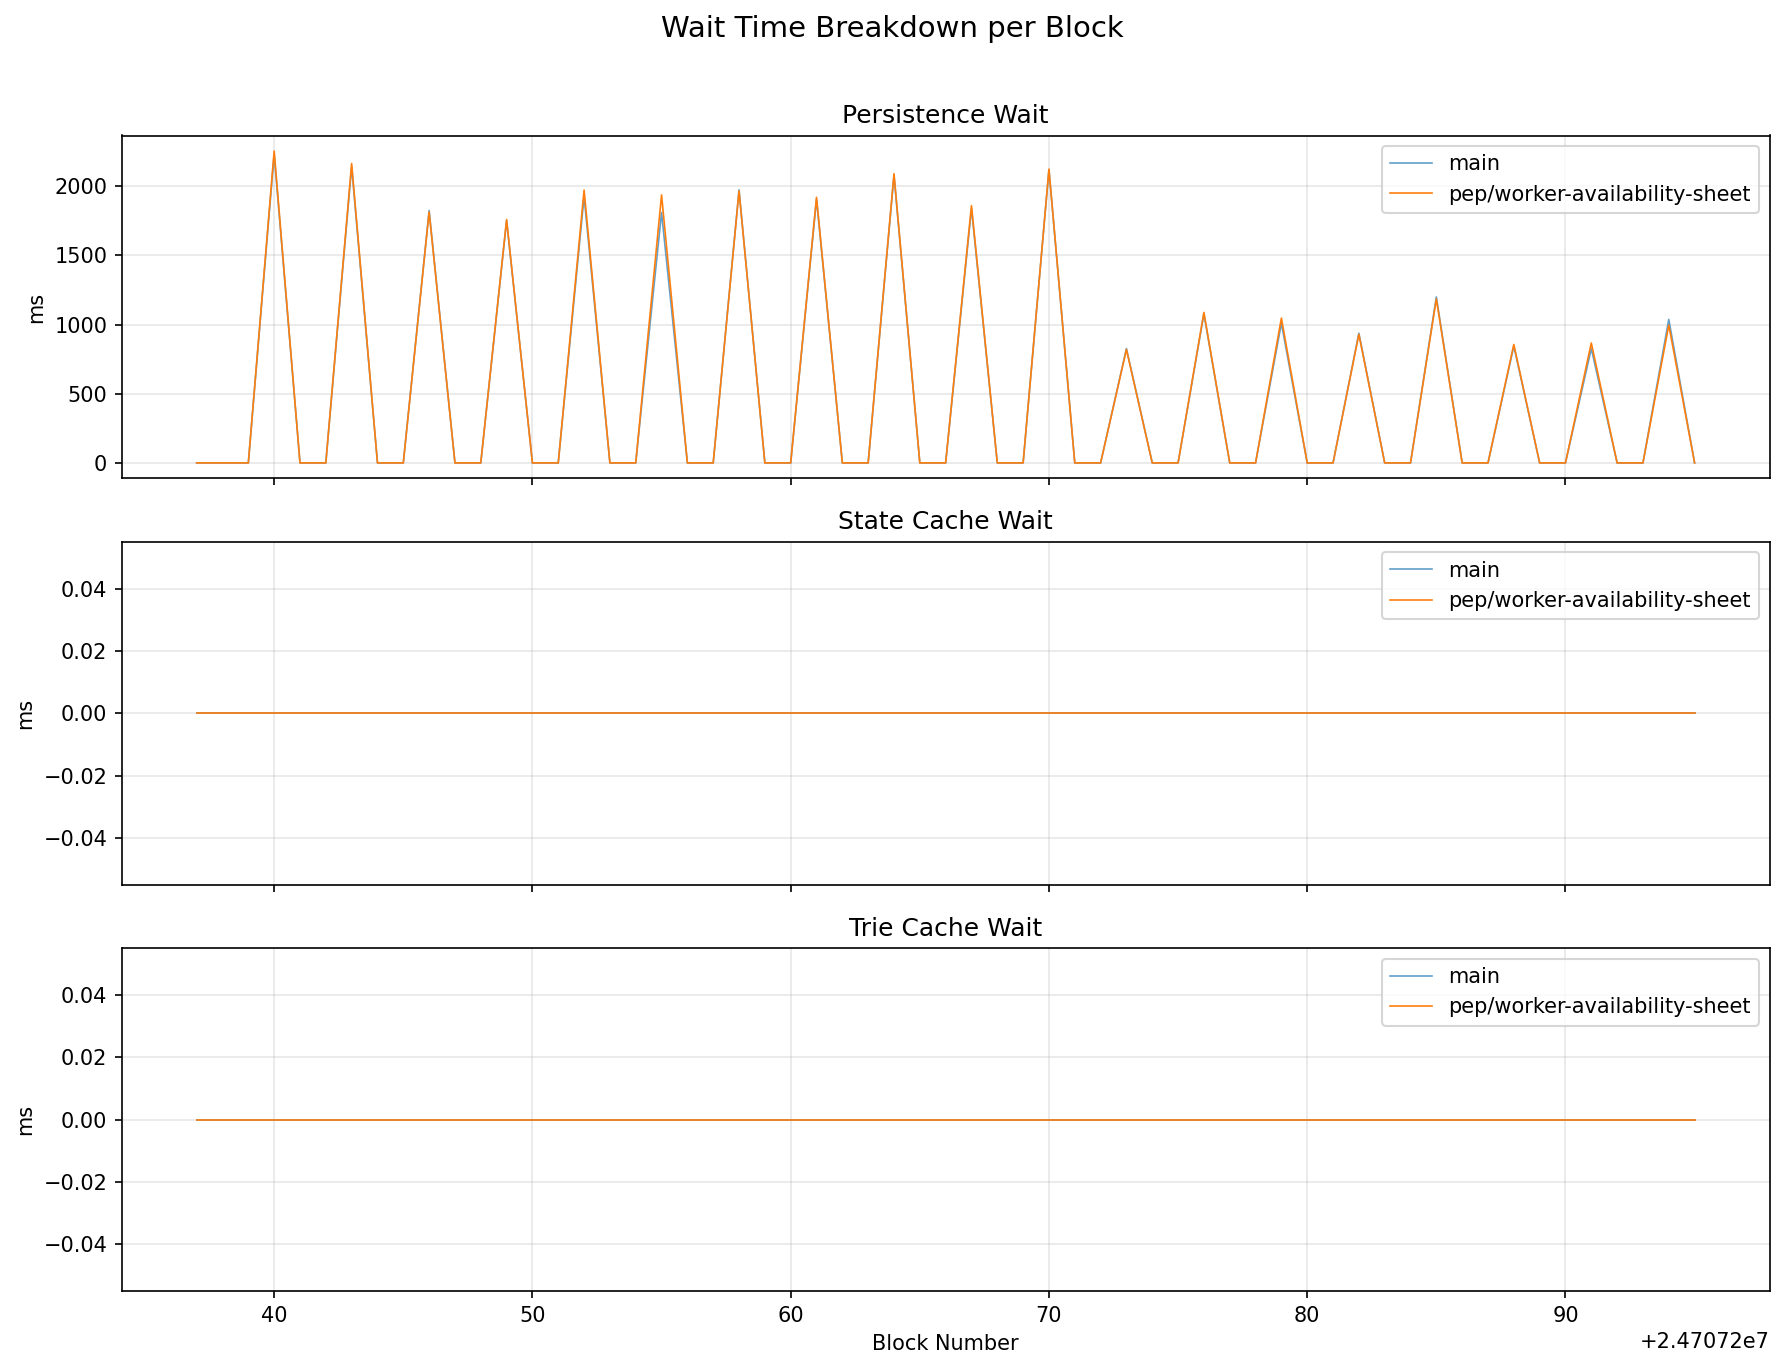
Wait Time Breakdown
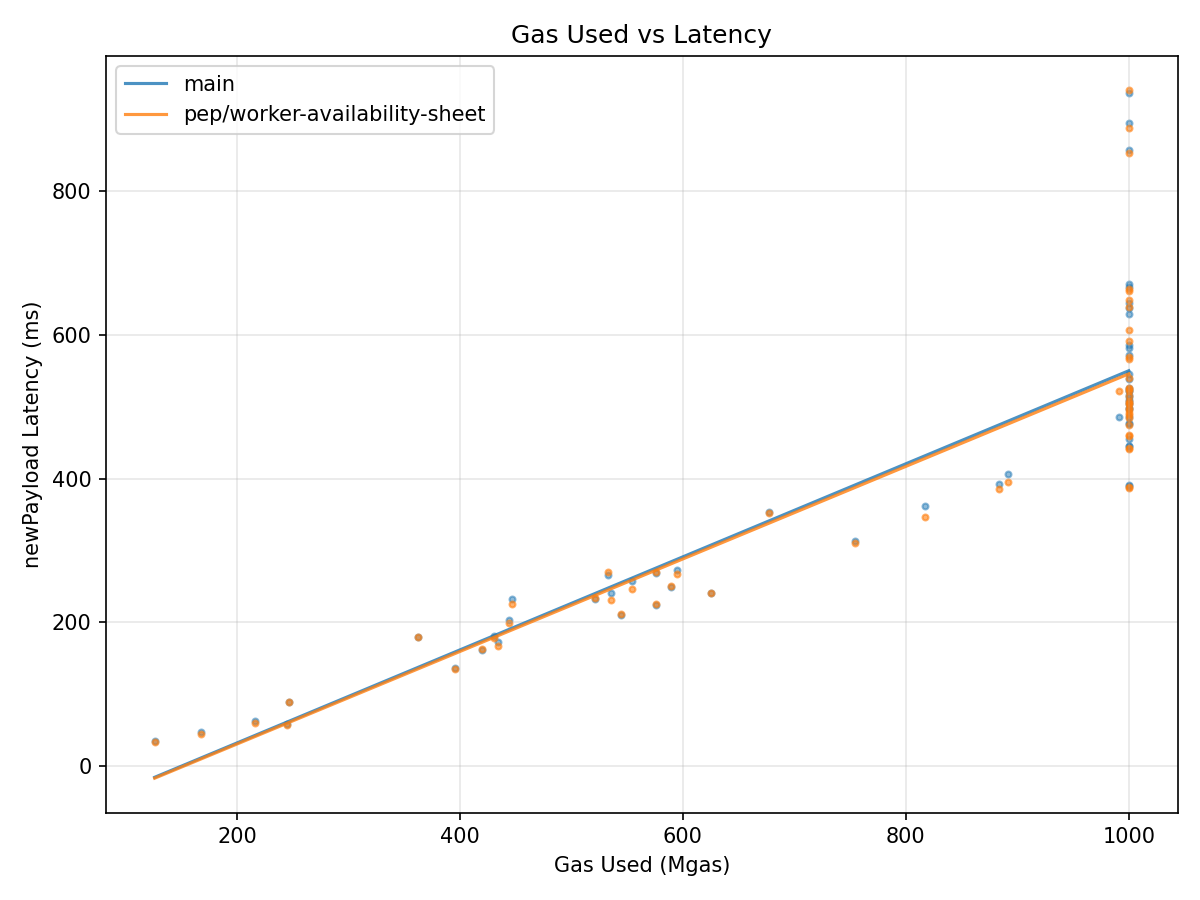
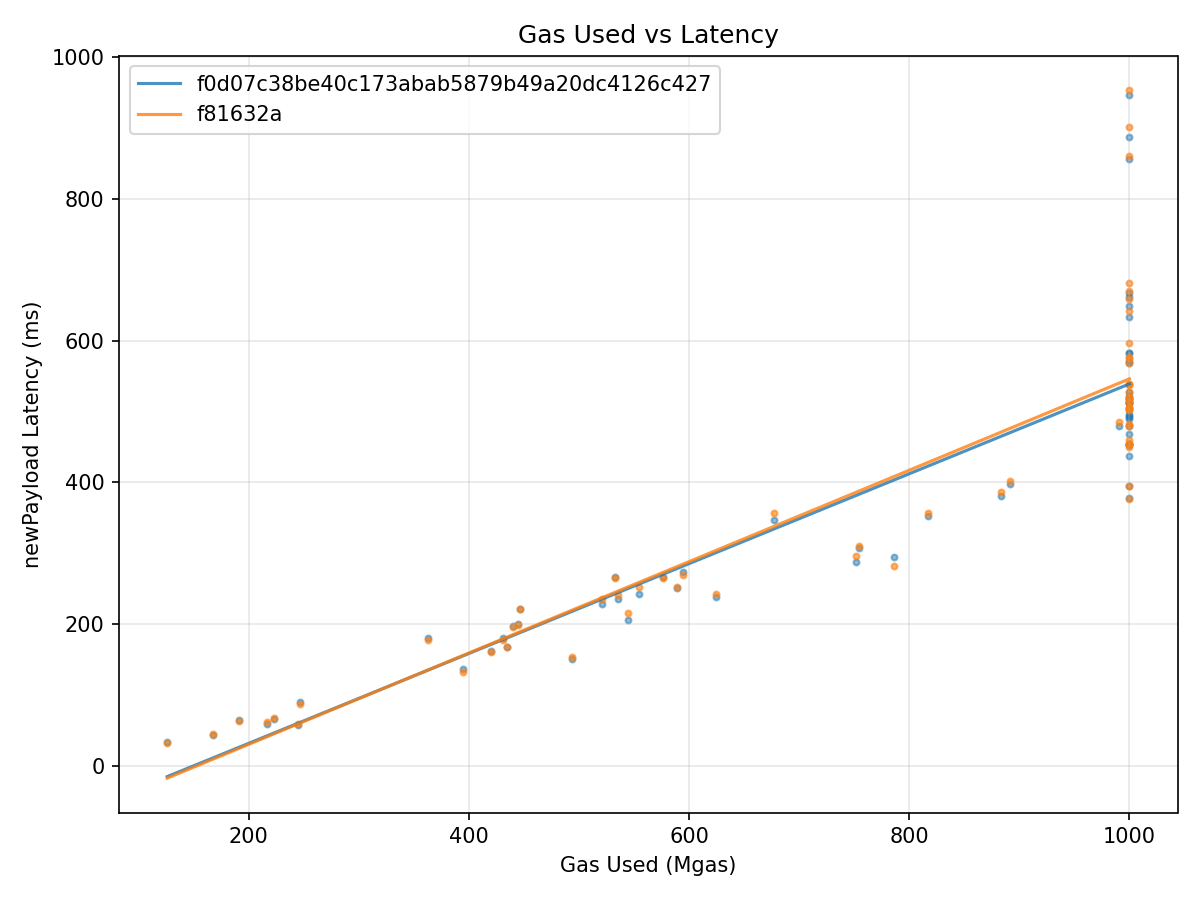
Gas vs Latency
Grafana Dashboard |
|
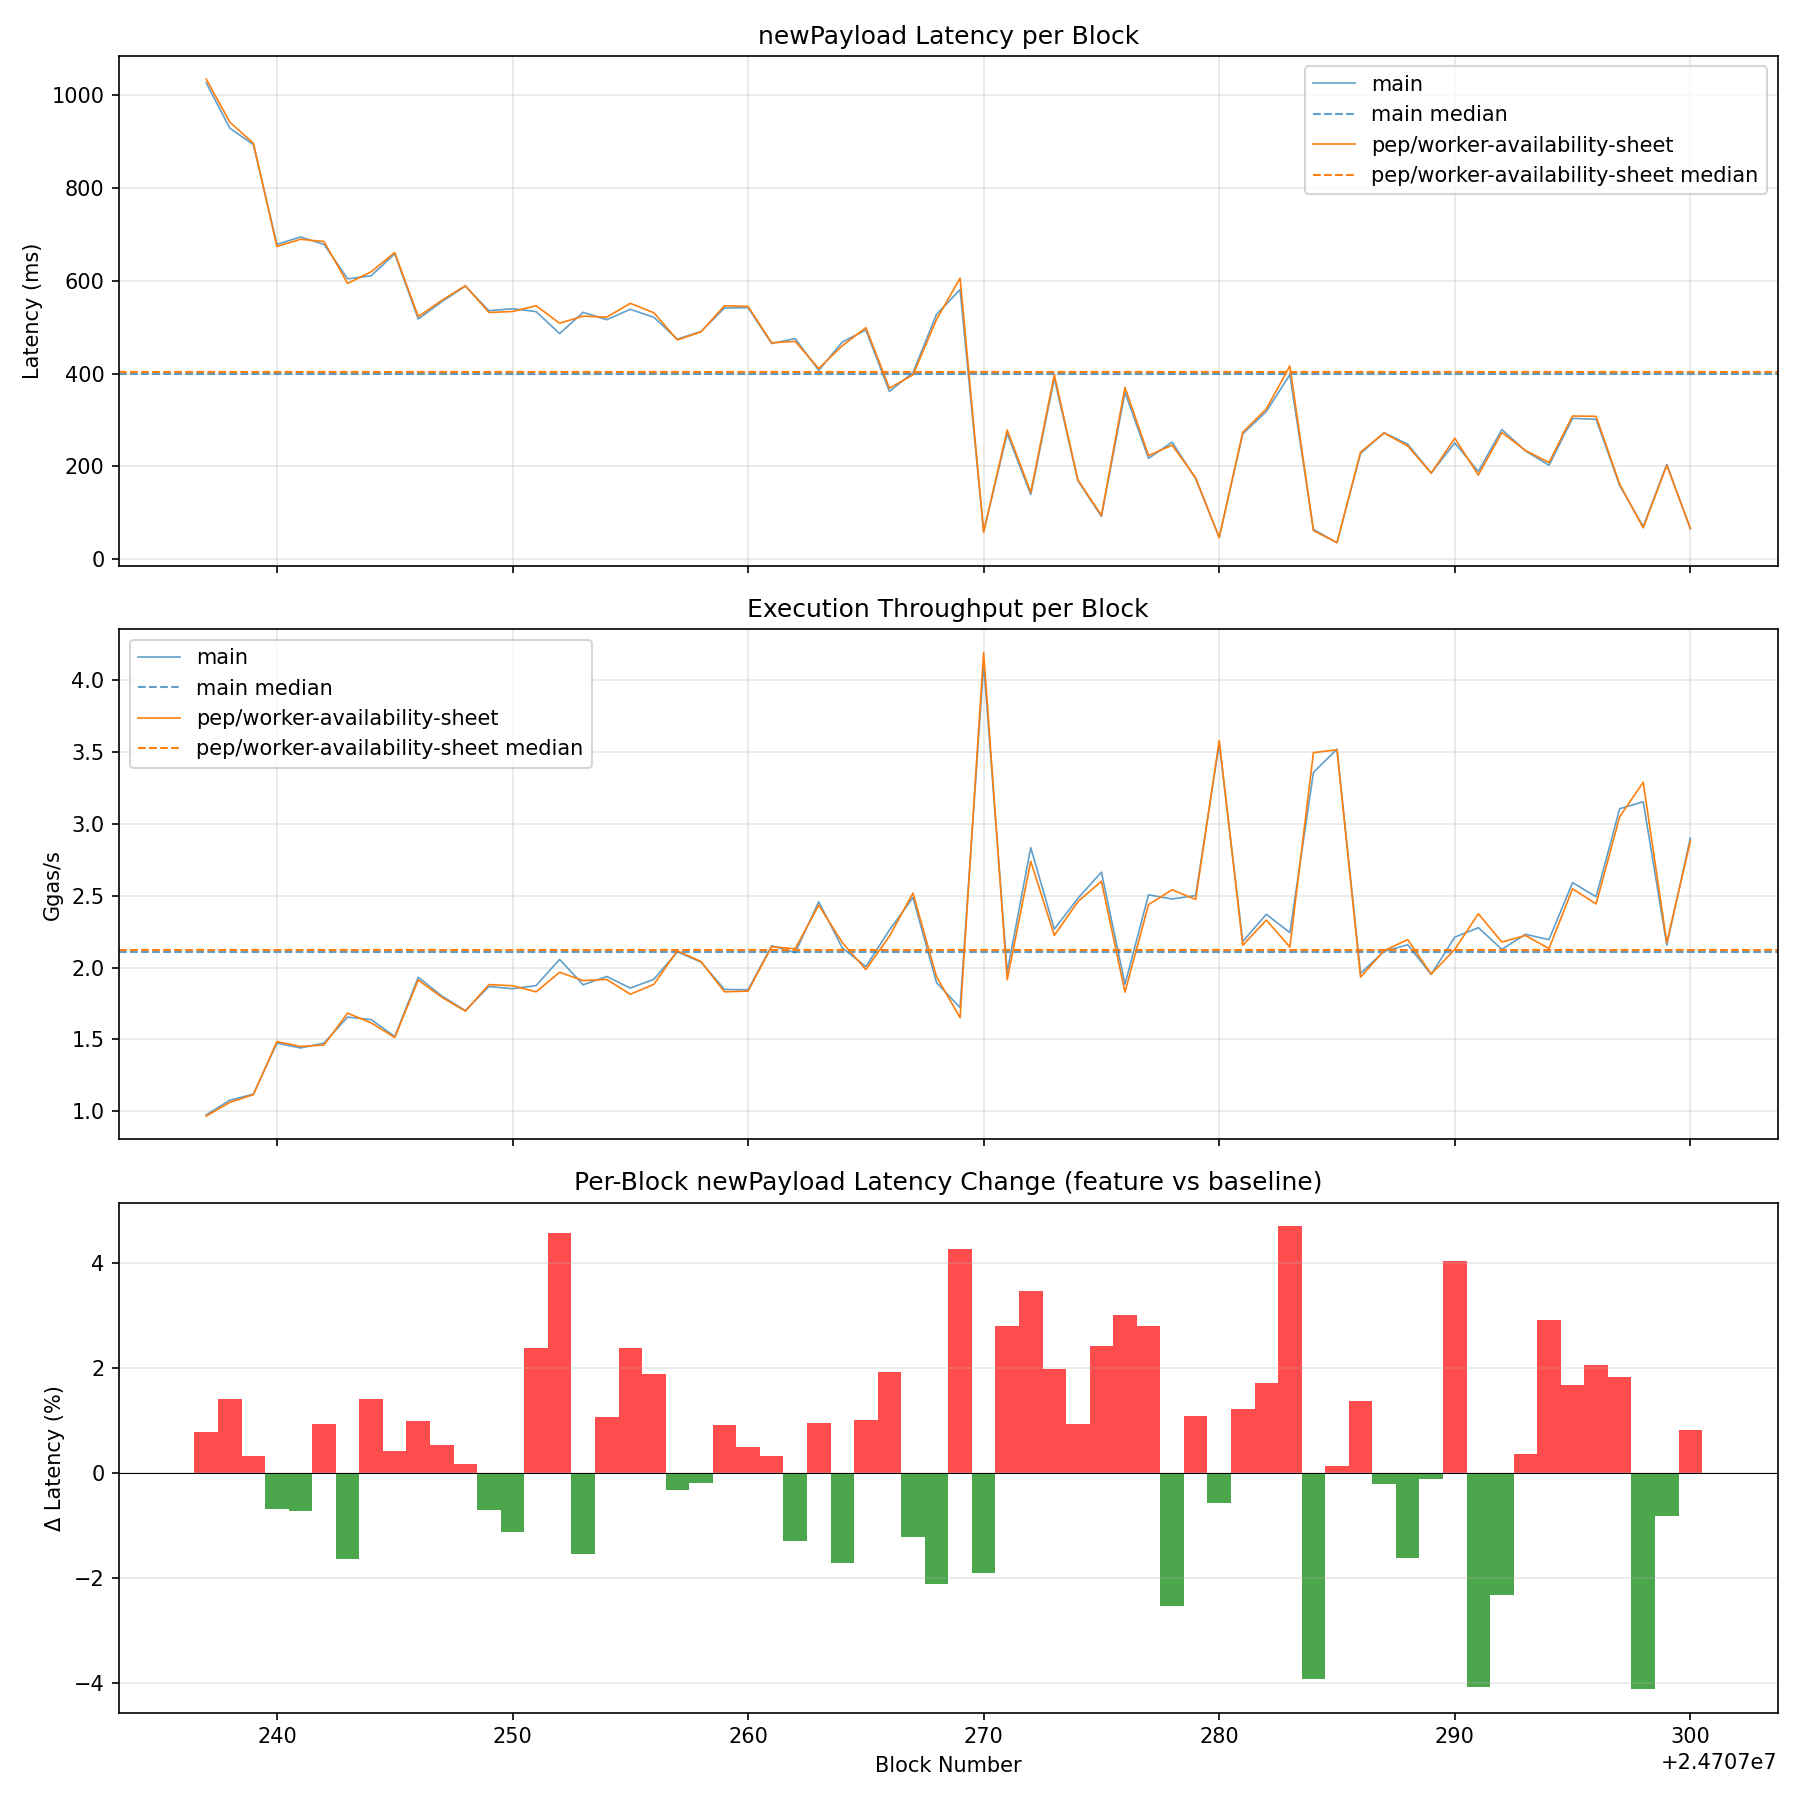
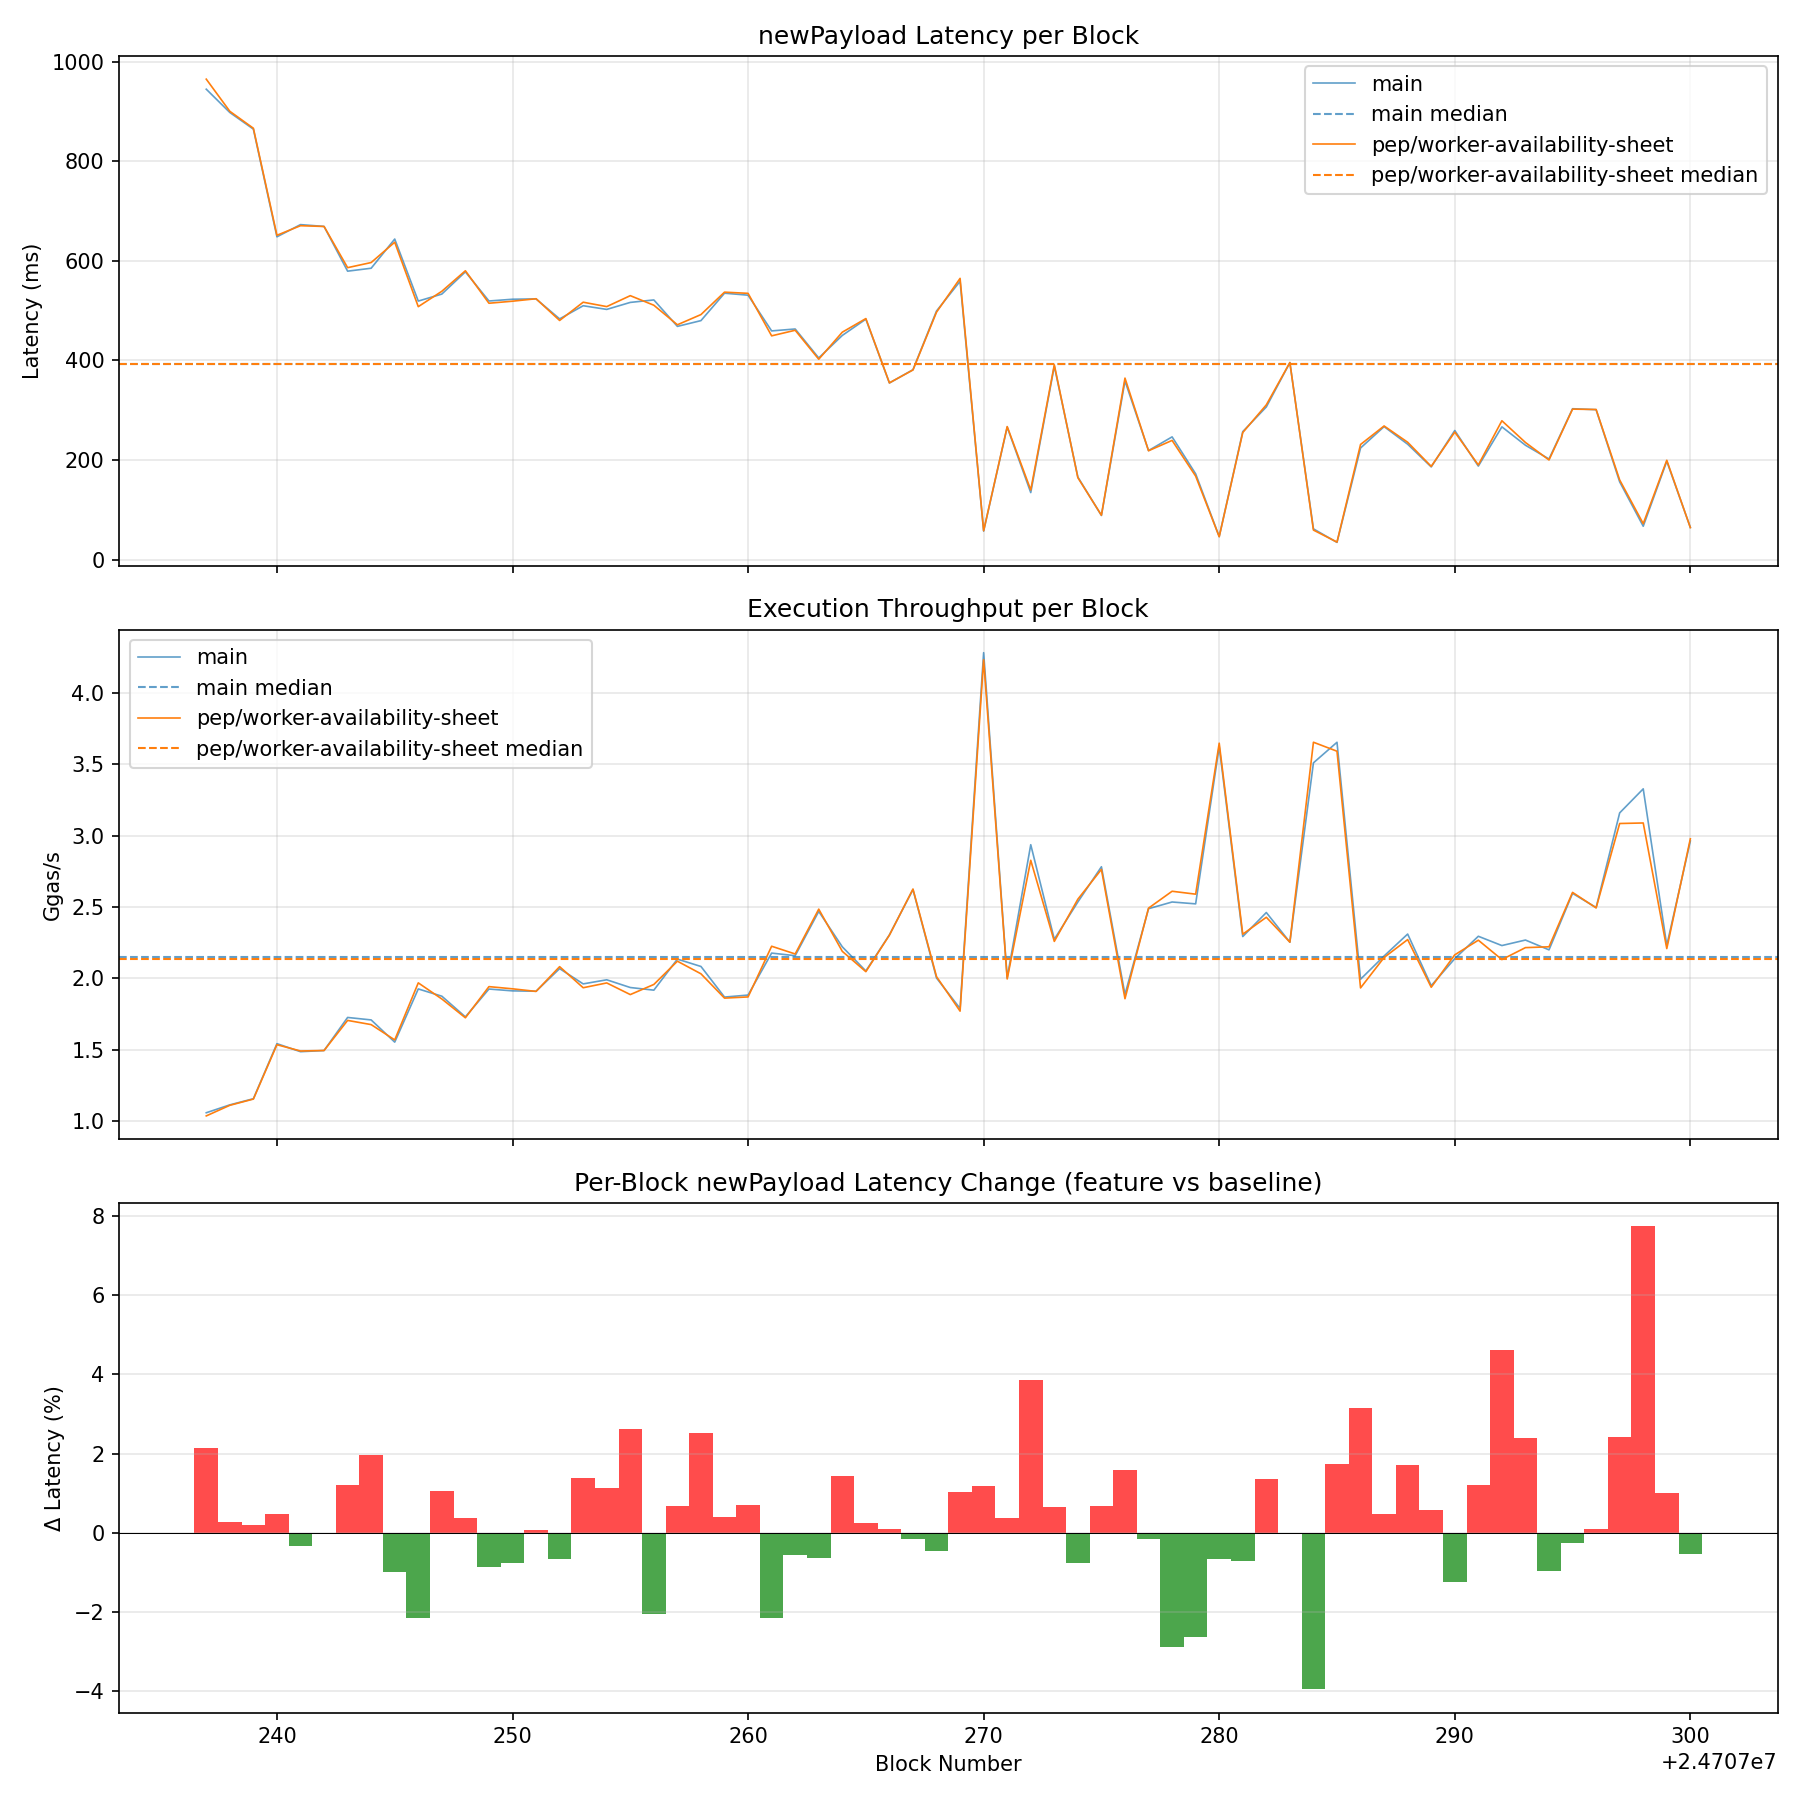
↑ to make it clear. I rebased and added a new commit. The 1st and 2nd recent runs are with the Dani's suggestion included, the 3rd is only the original change. As you can see it's showing an opposite result. Now, let's see what would happen if we re-run the original, pre-rebase, change. |
|
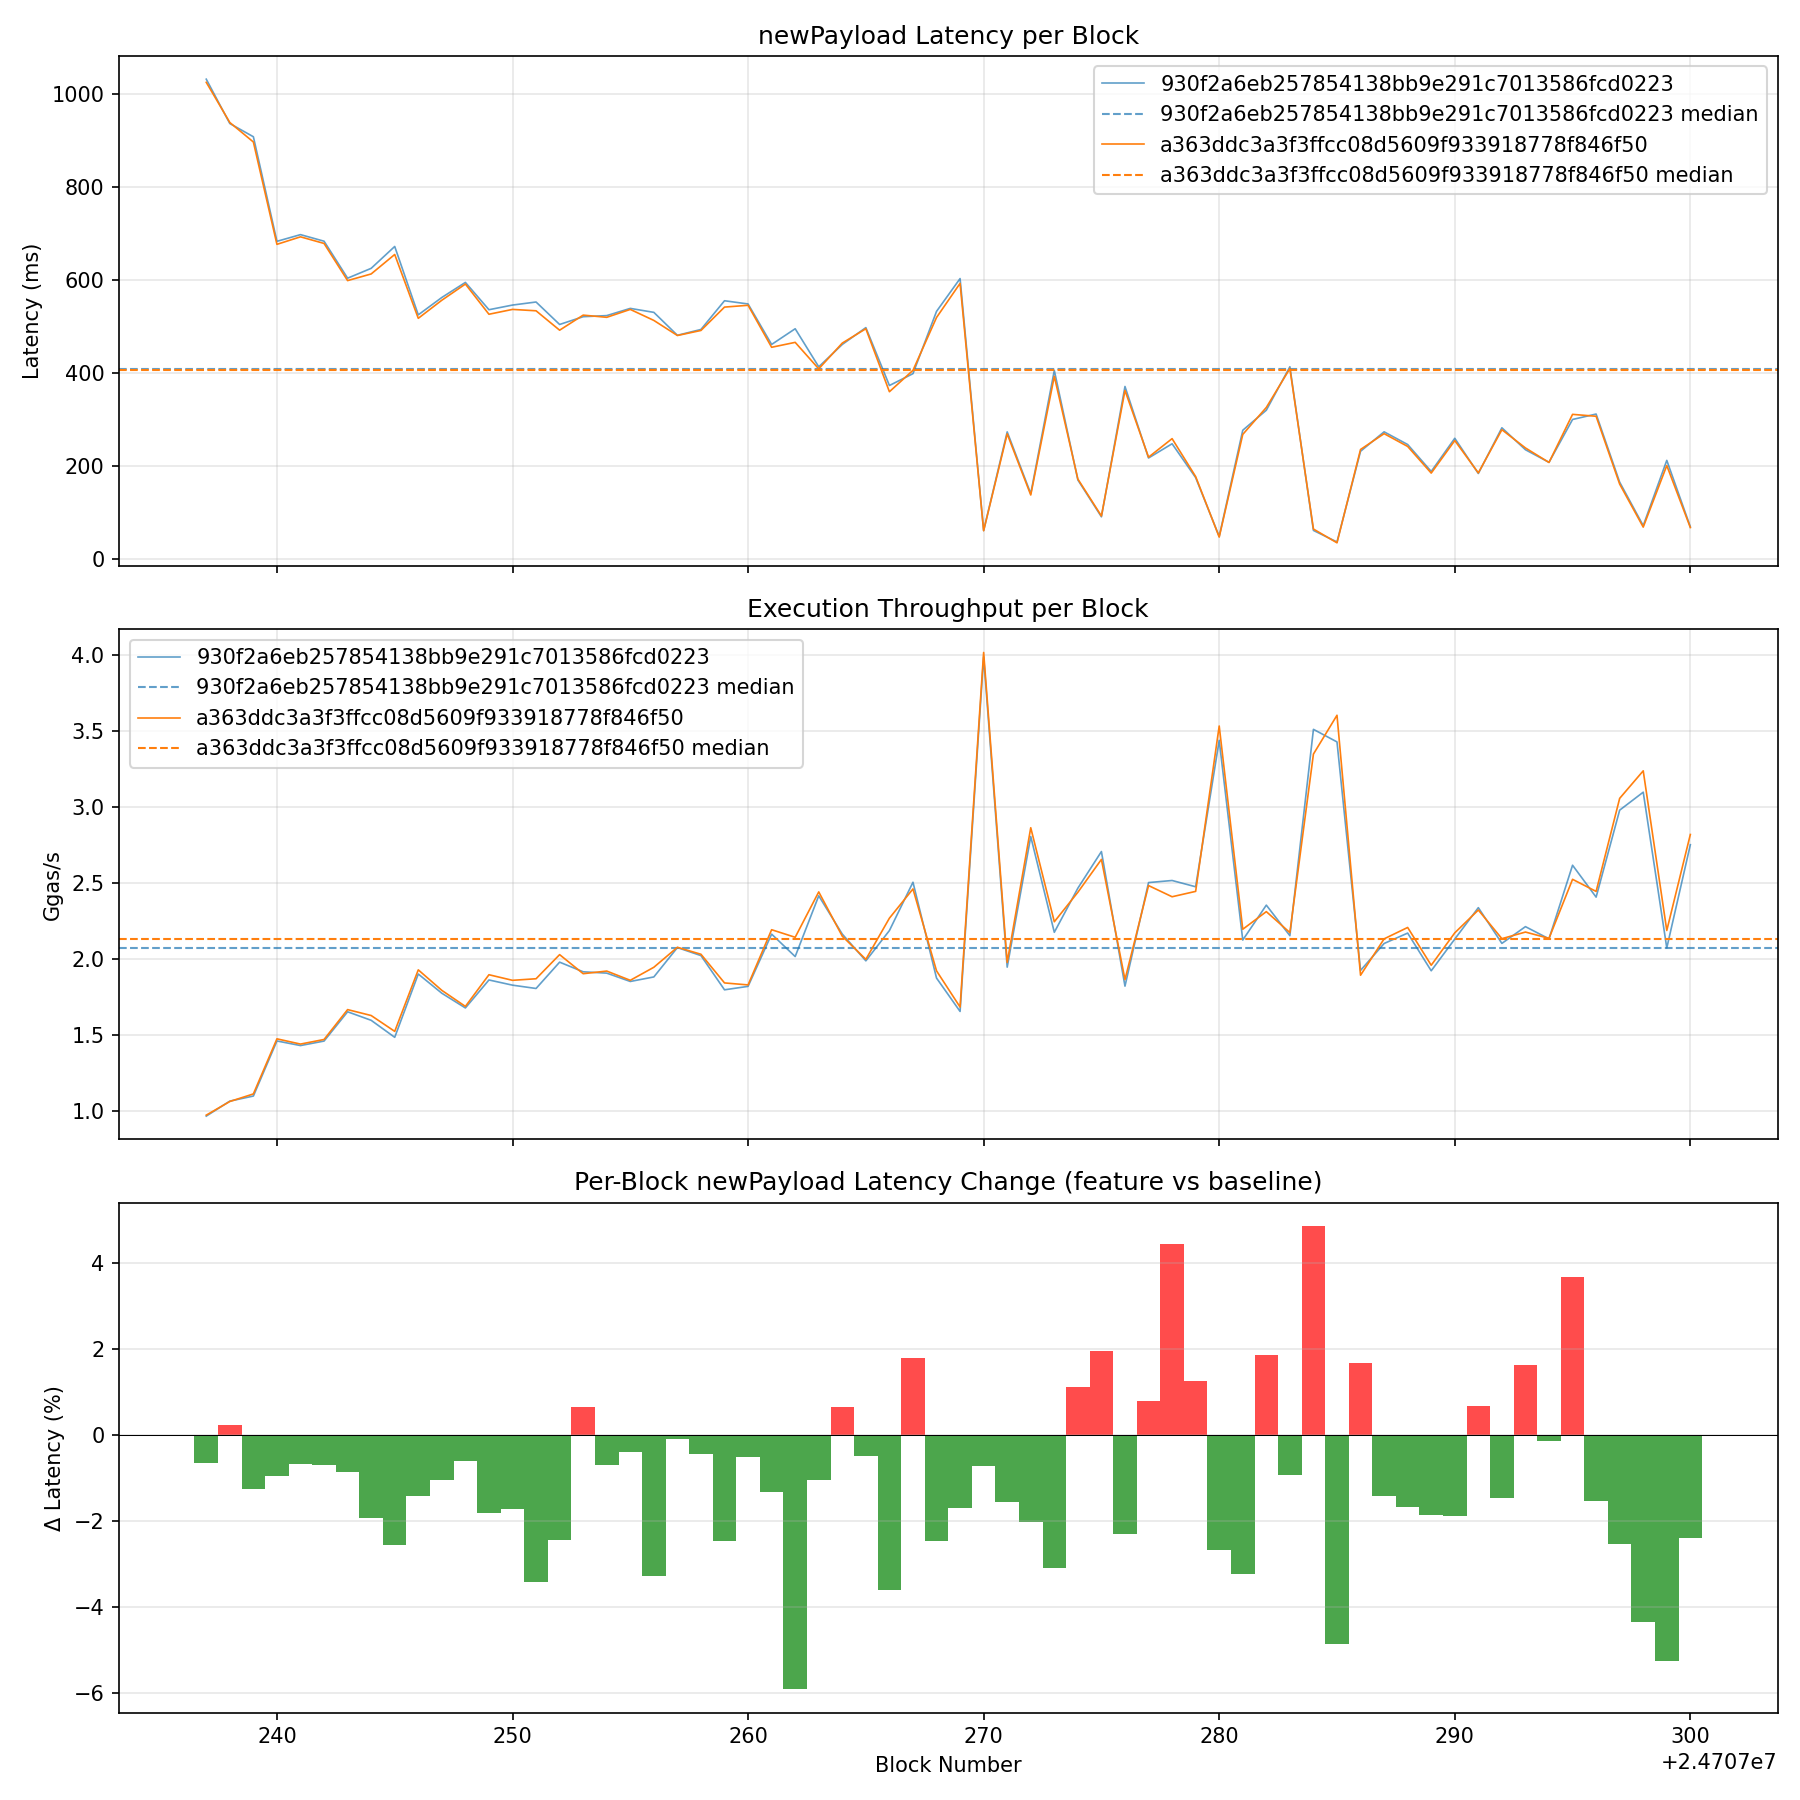
derek bench otlp=false blocks=big baseline=930f2a6eb257854138bb9e291c7013586fcd0223 feature=a363ddc3a3f3ffcc08d5609f933918778f846f50 |
|
cc @pepyakin ✅ Benchmark complete! View job Benchmark Results
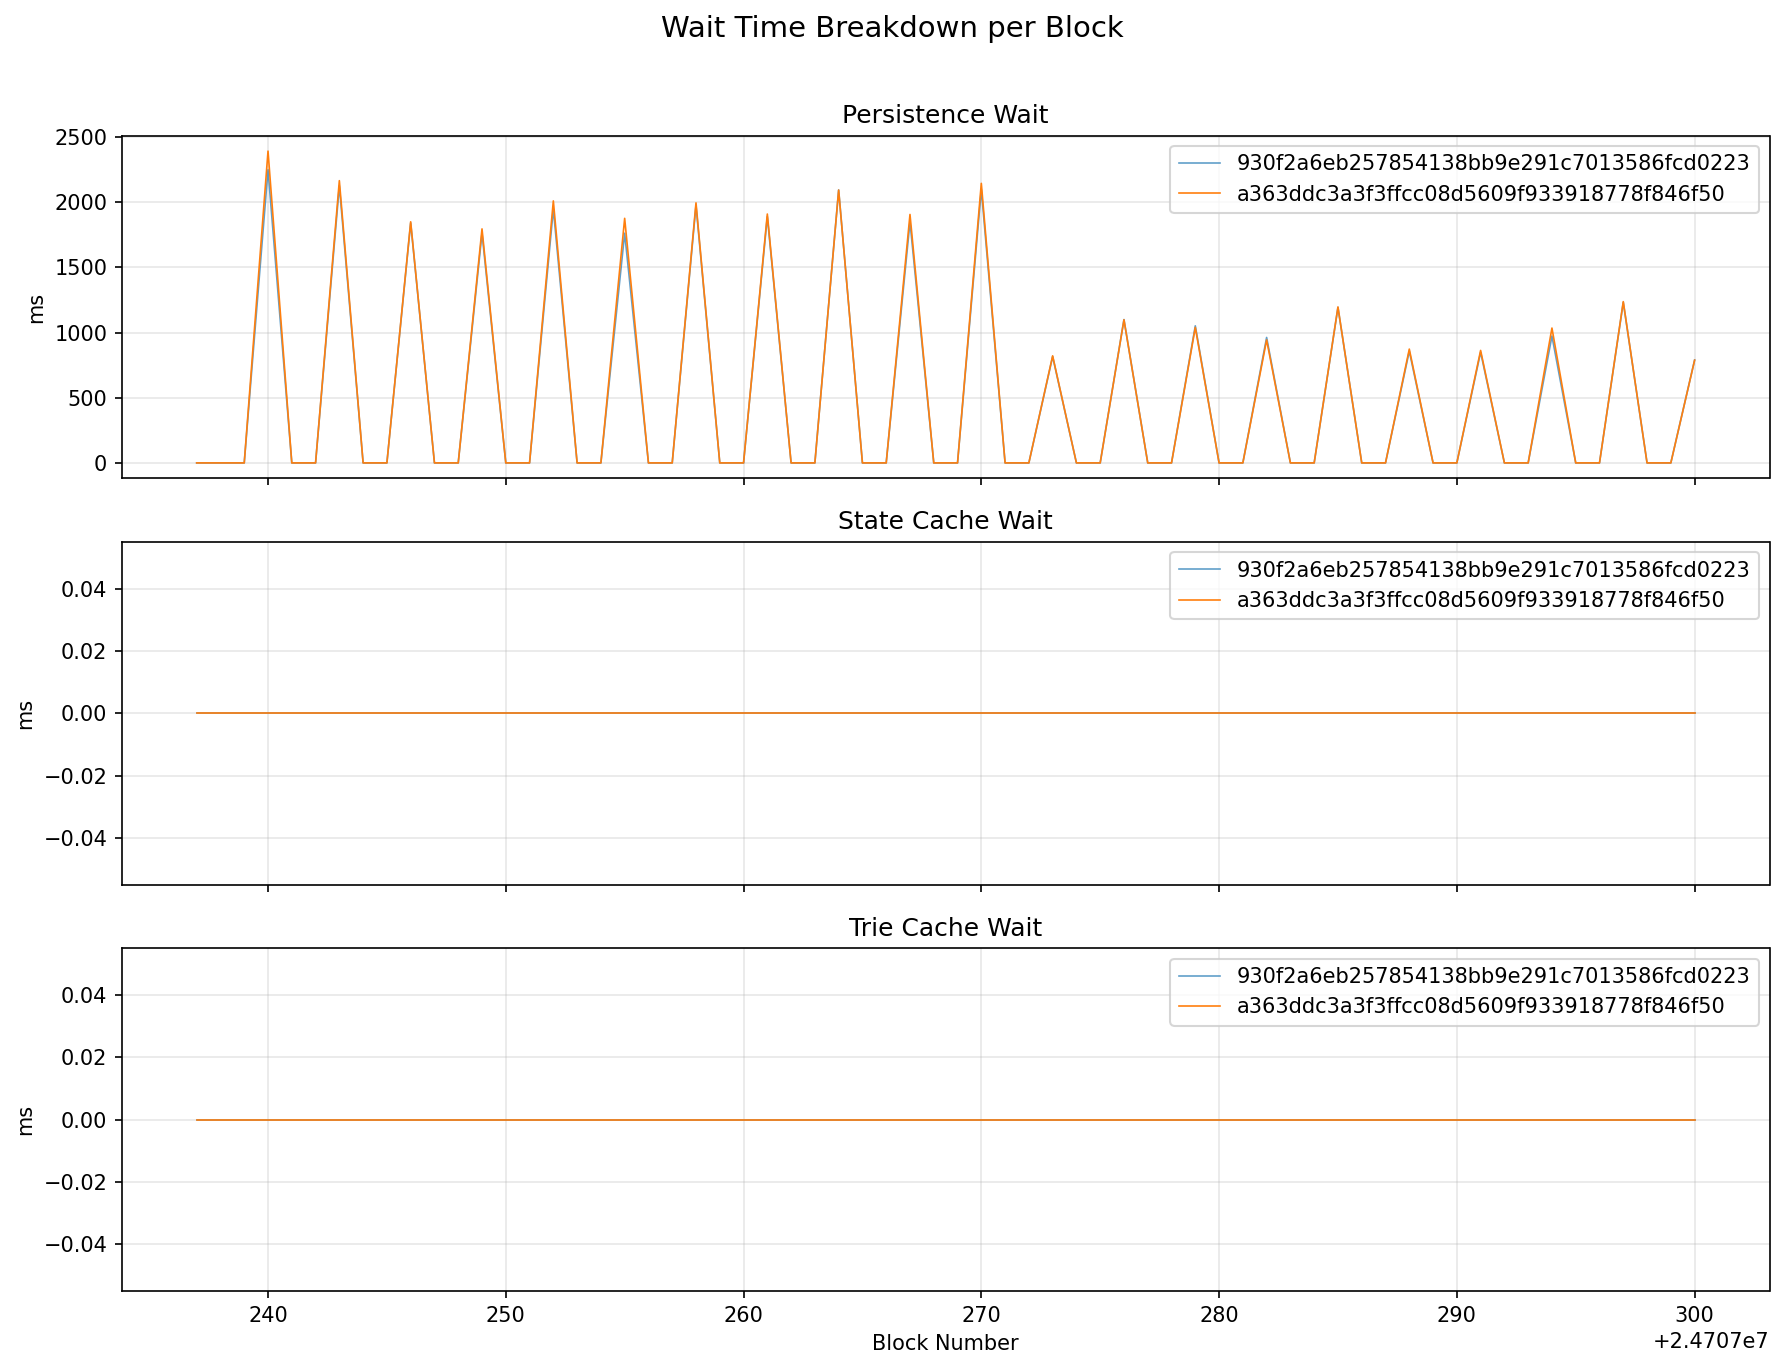
64 big blocks Wait Time BreakdownPersistence Wait
Trie Cache Update Wait
Execution Cache Update Wait
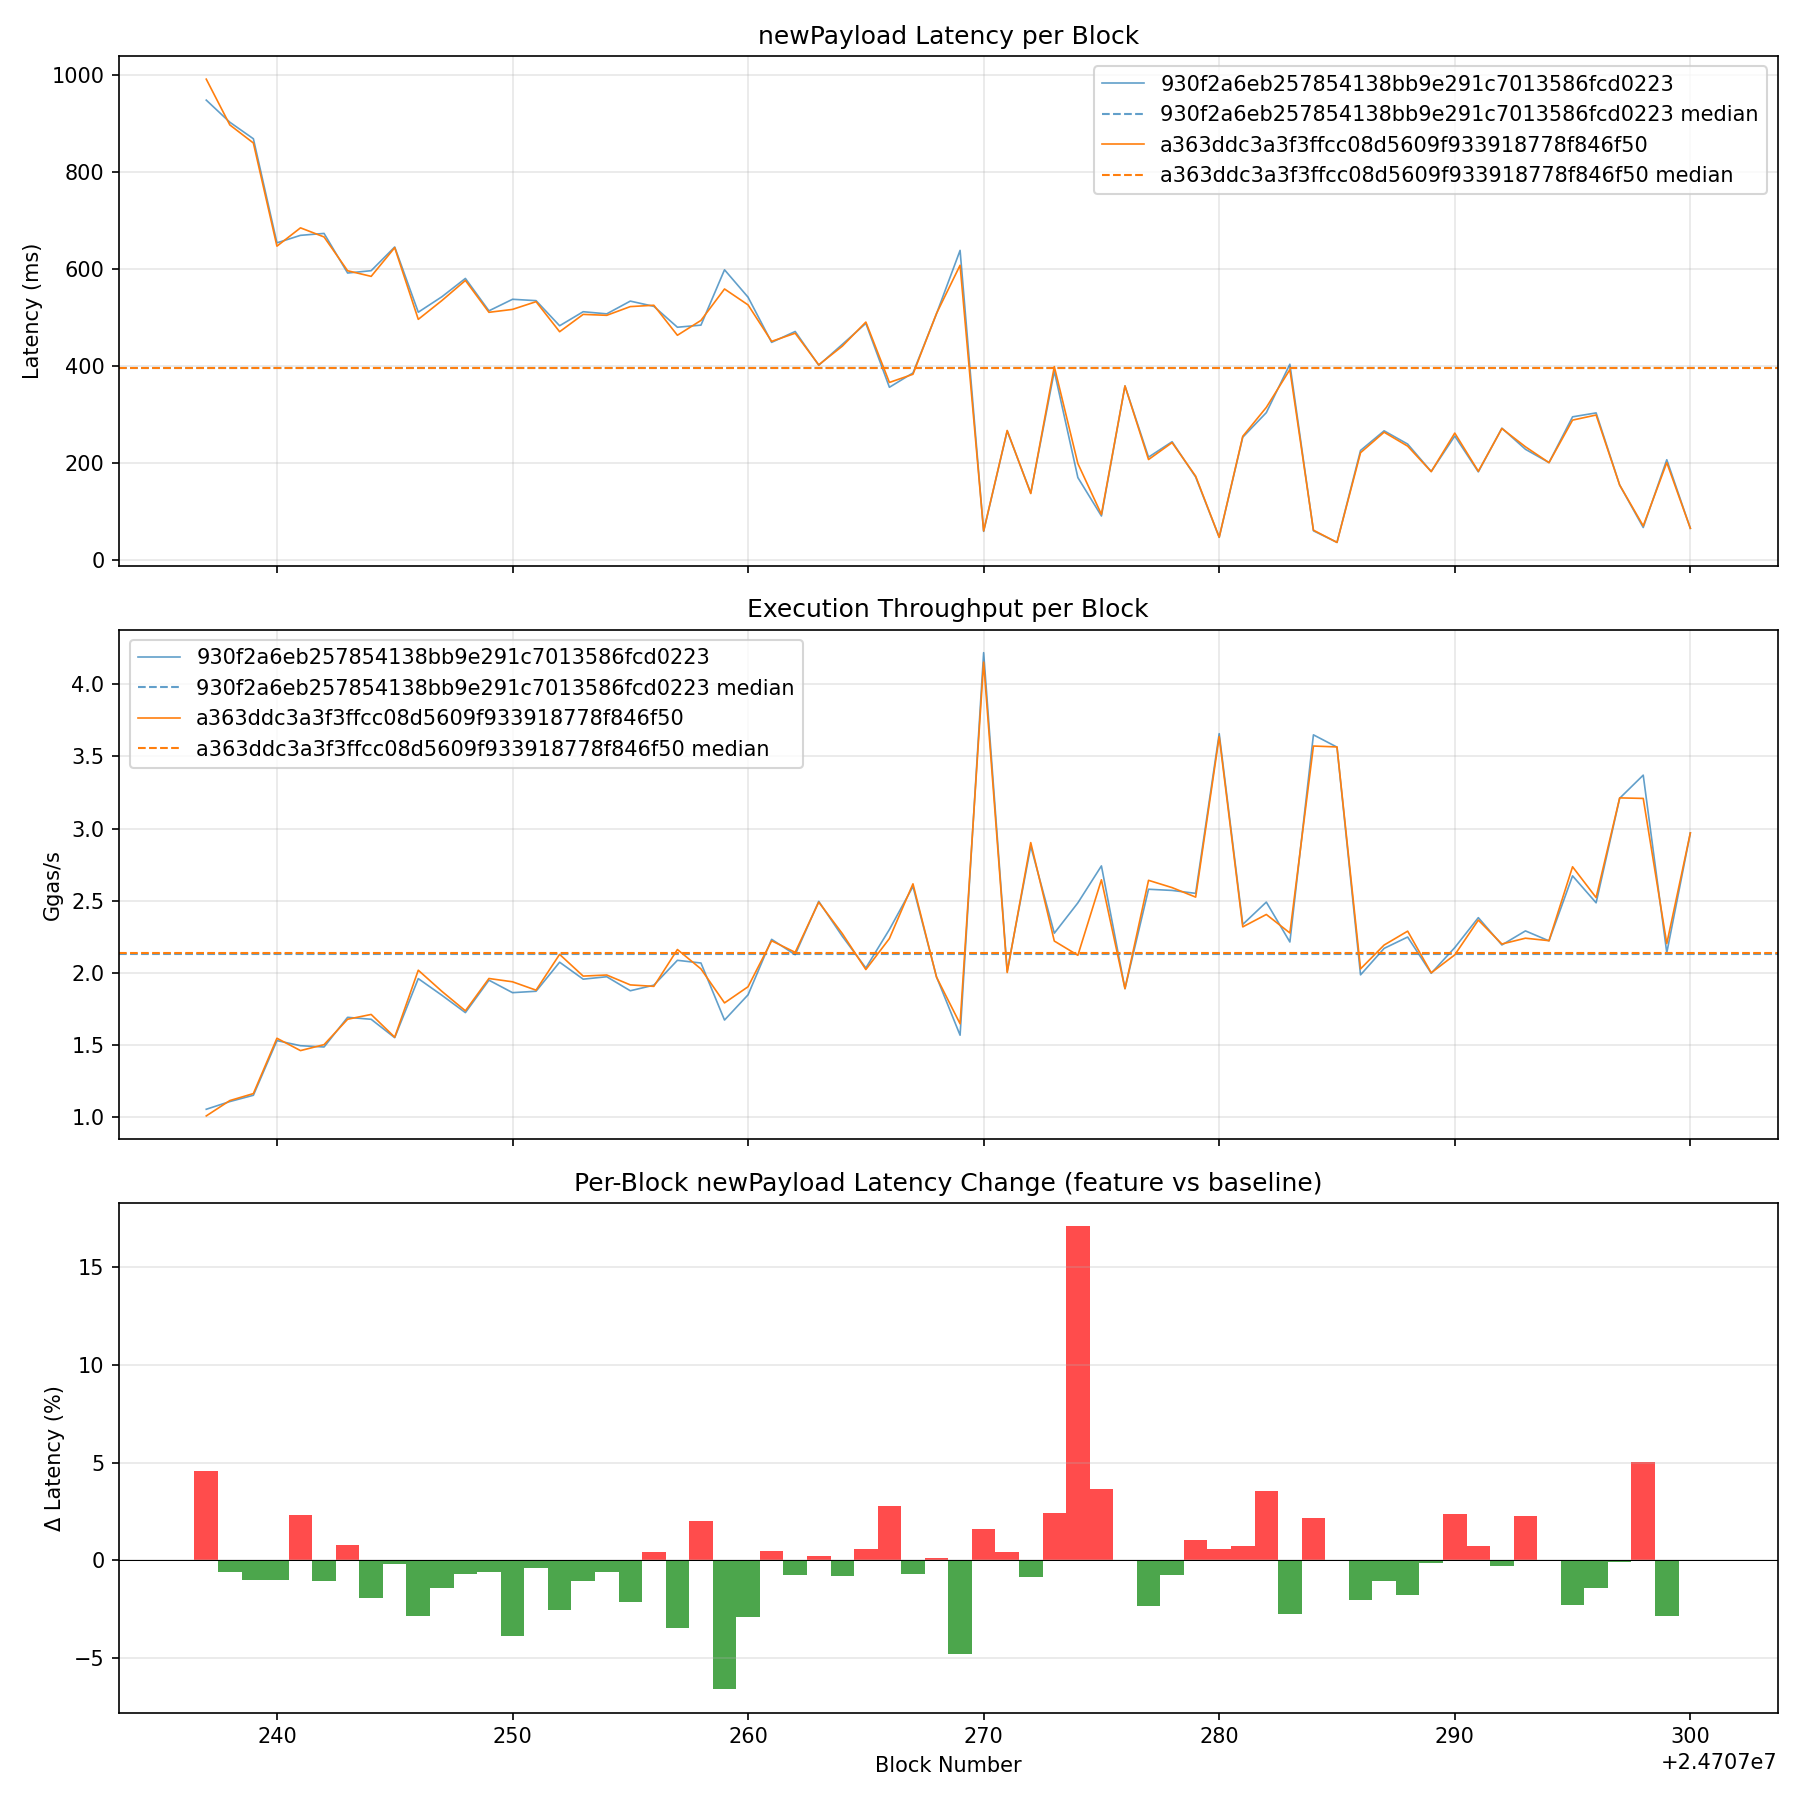
ChartsLatency, Throughput & Diff
Wait Time Breakdown
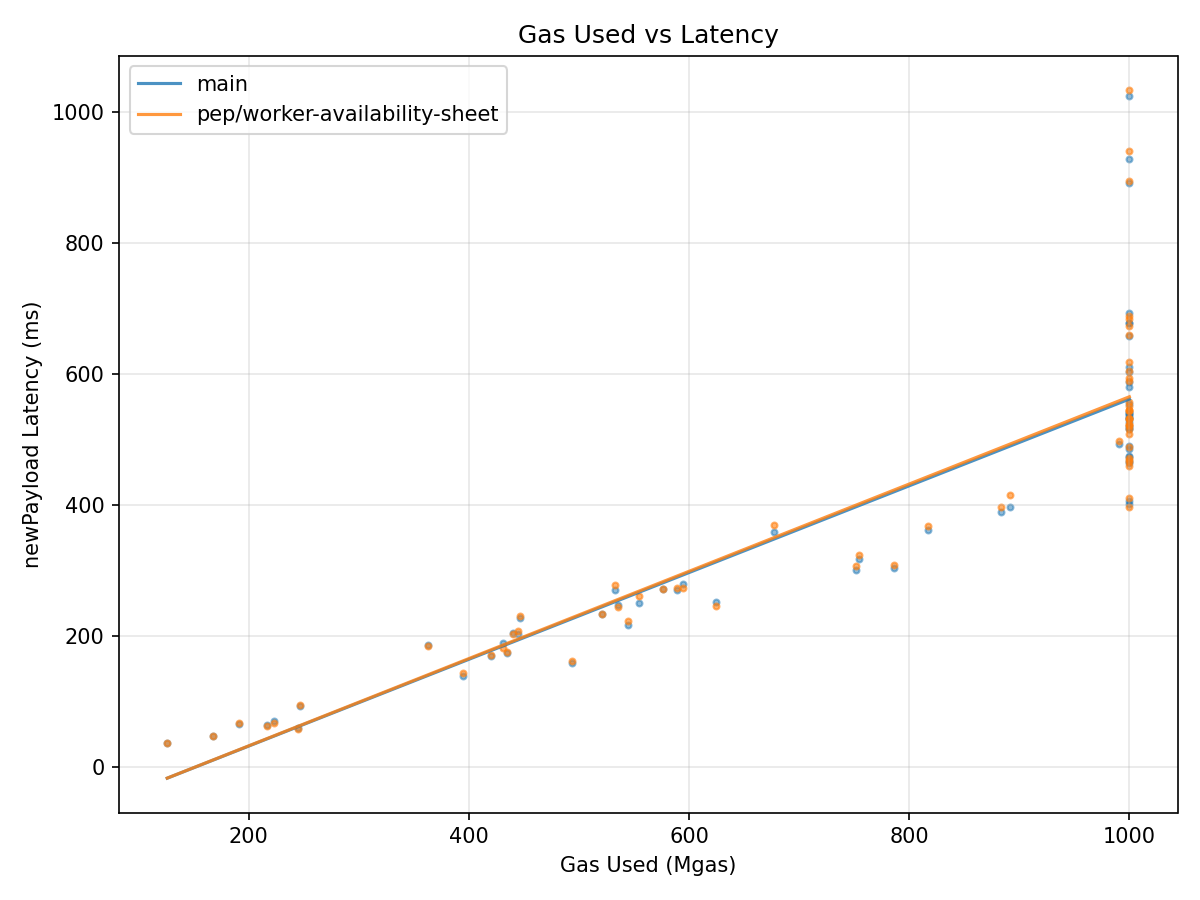
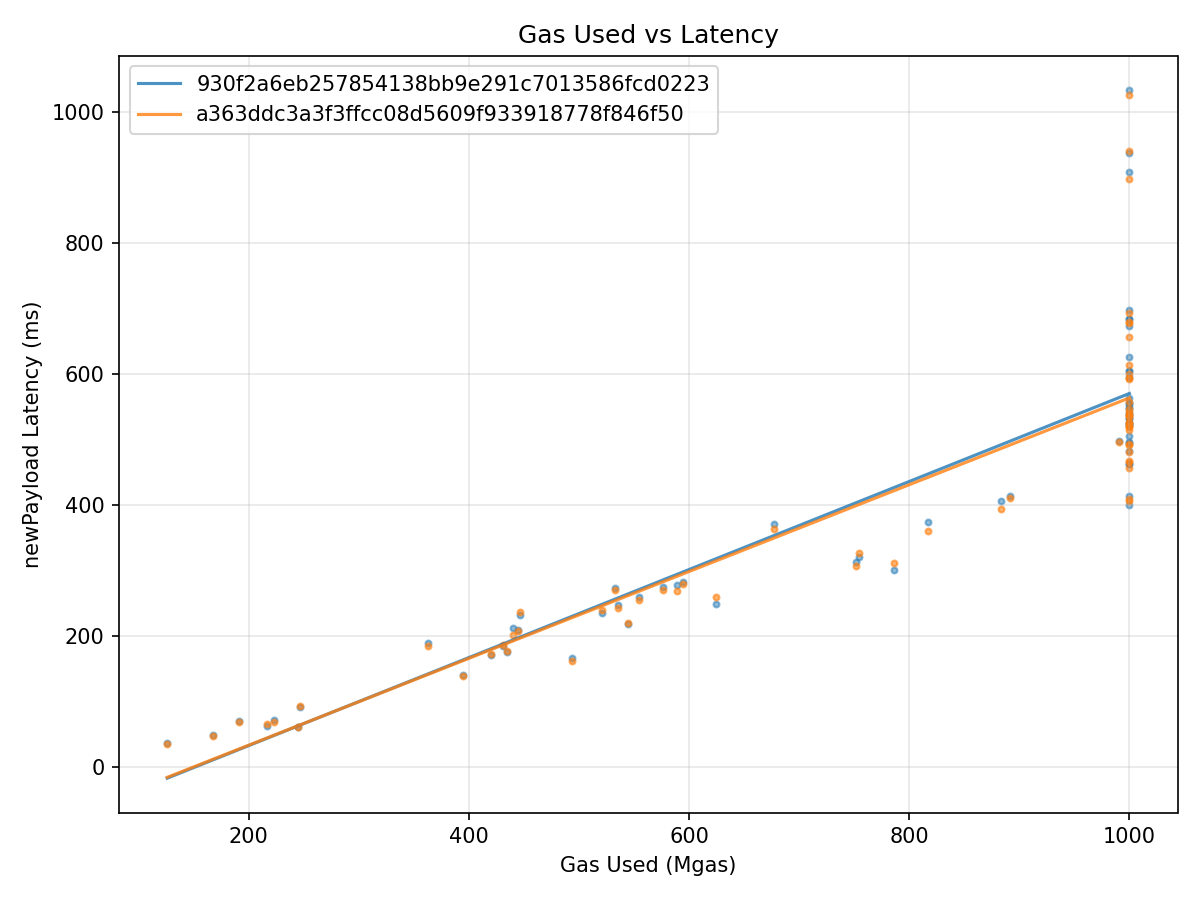
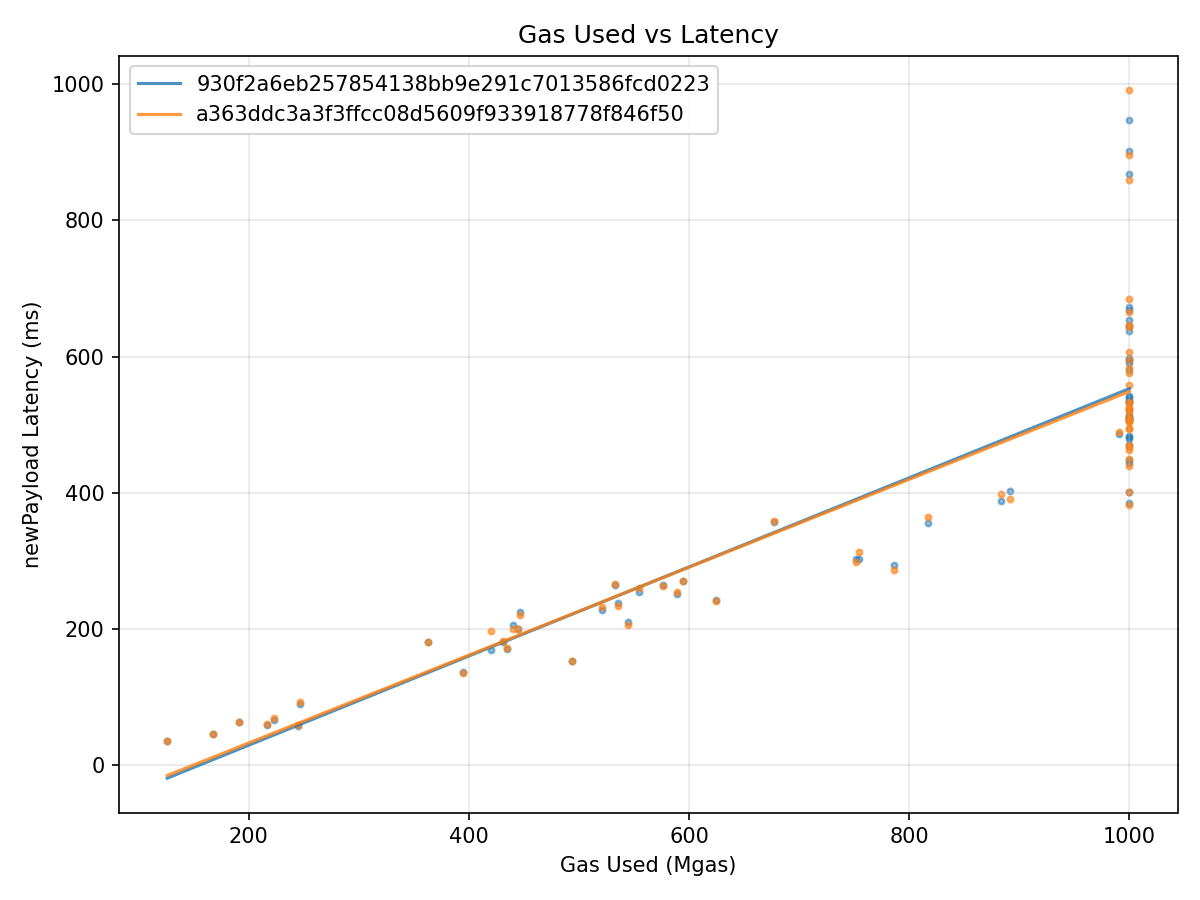
Gas vs Latency
Grafana Dashboard |
|
derek bench otlp=false blocks=big baseline=930f2a6eb257854138bb9e291c7013586fcd0223 feature=a363ddc3a3f3ffcc08d5609f933918778f846f50 |
|
cc @pepyakin ✅ Benchmark complete! View job Benchmark Results
64 big blocks Wait Time BreakdownPersistence Wait
Trie Cache Update Wait
Execution Cache Update Wait
ChartsLatency, Throughput & Diff
Wait Time Breakdown
Gas vs Latency
Grafana Dashboard |

|
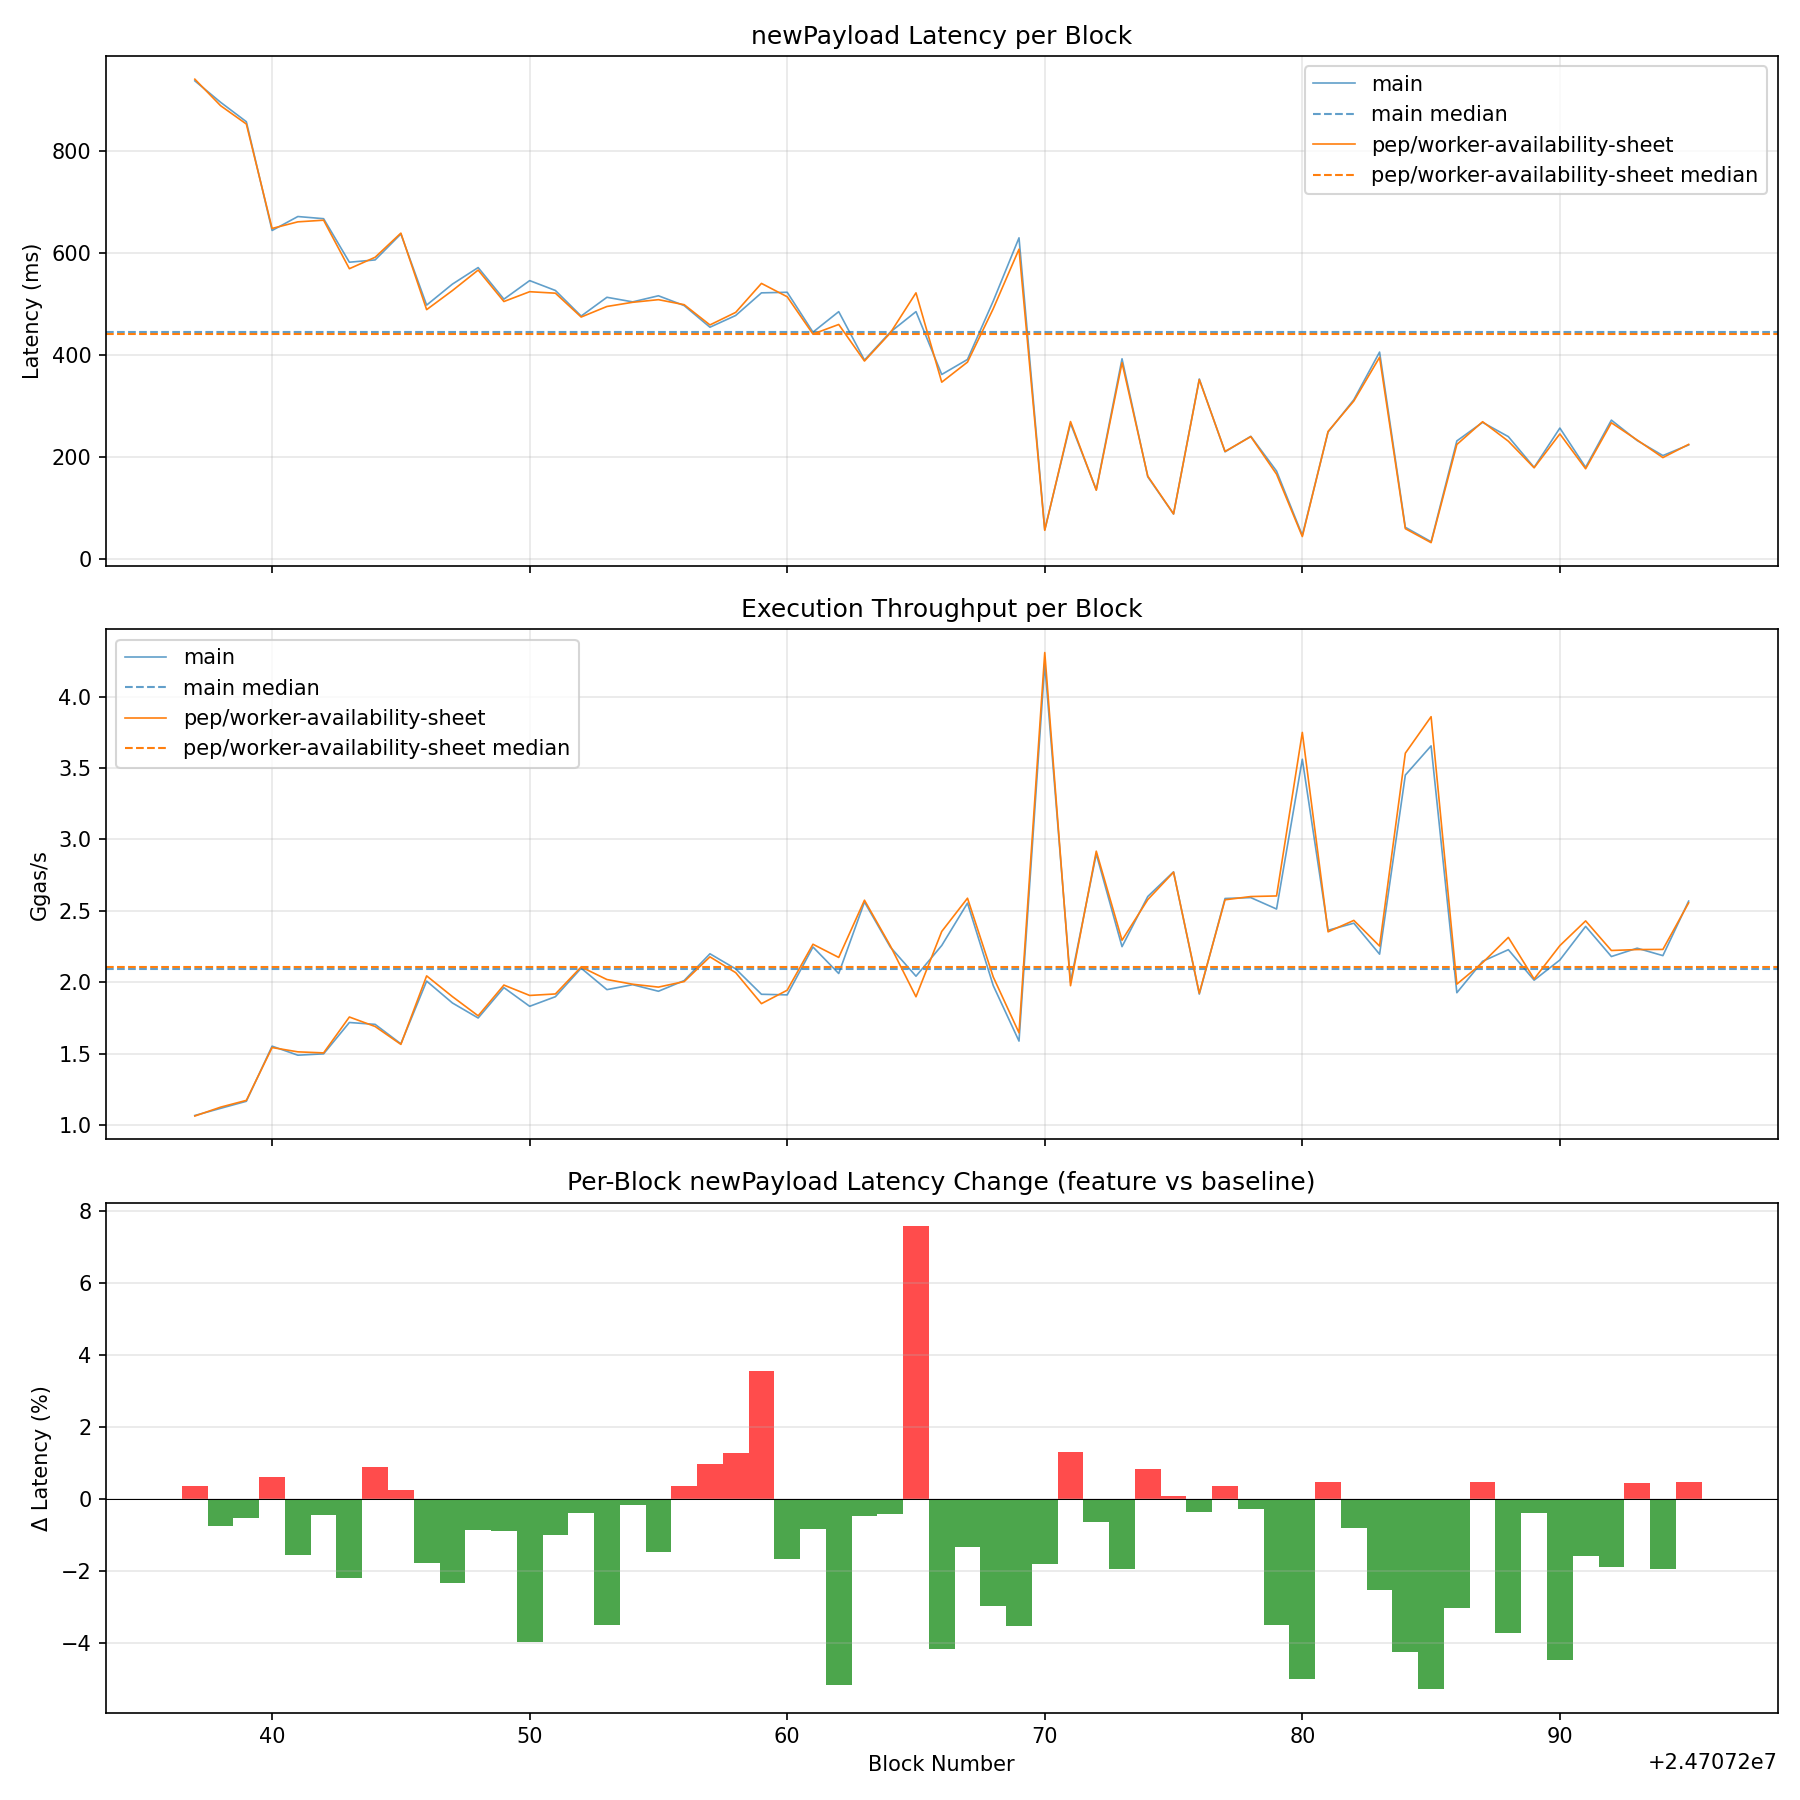
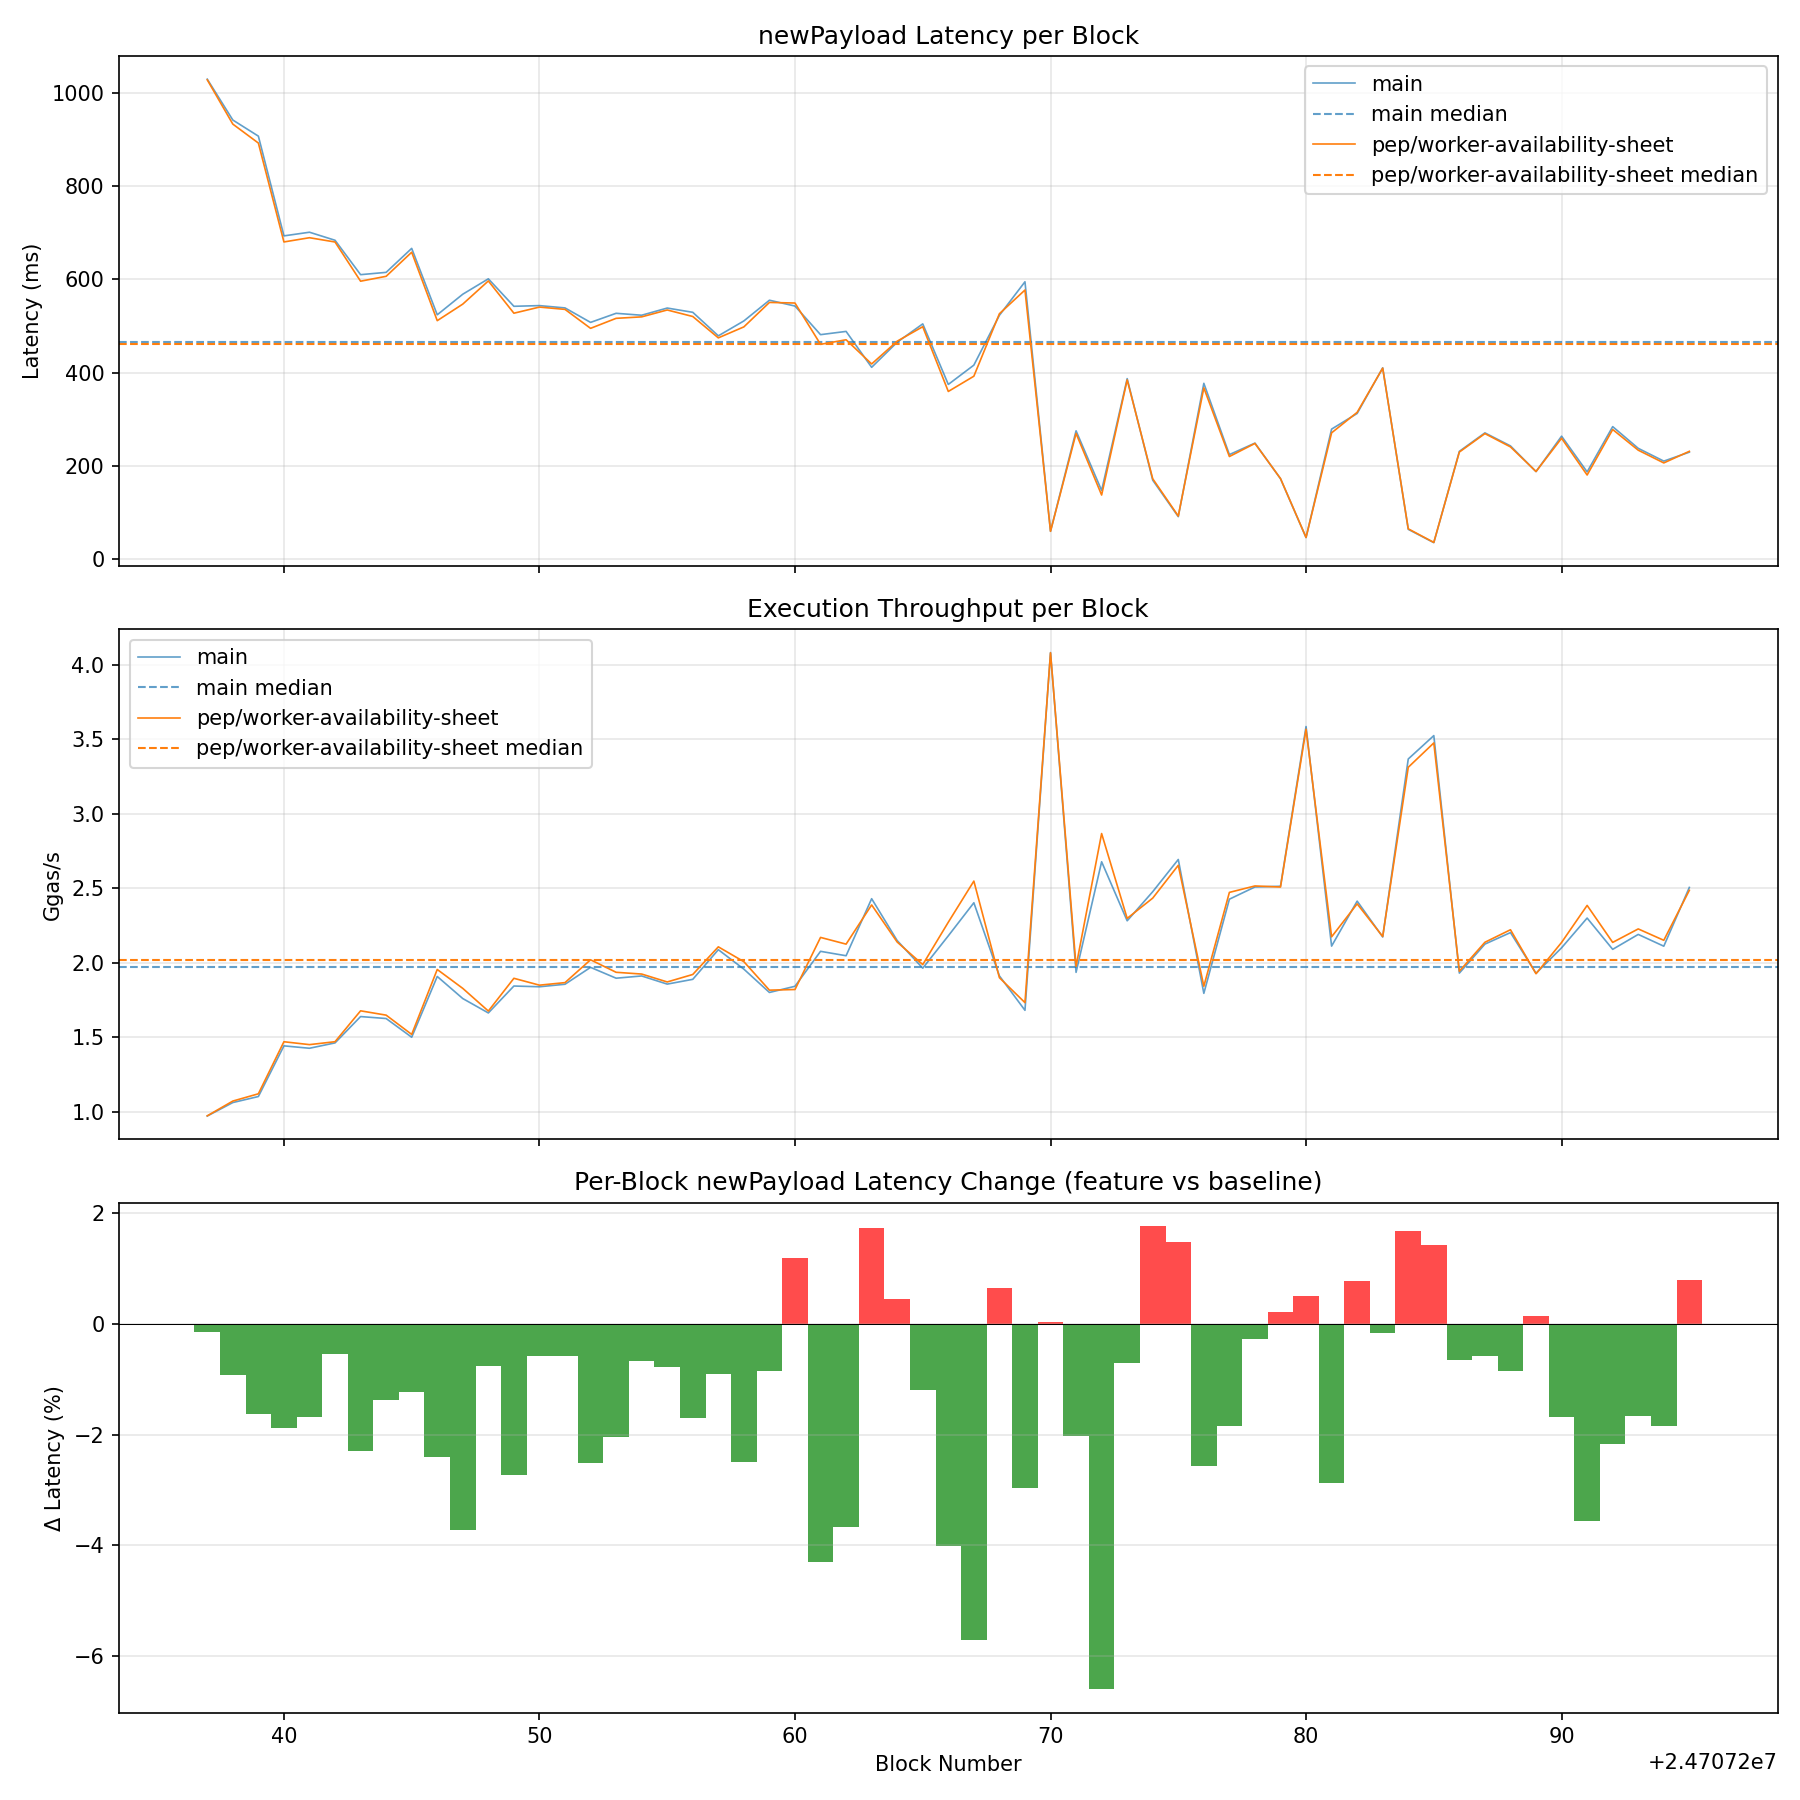
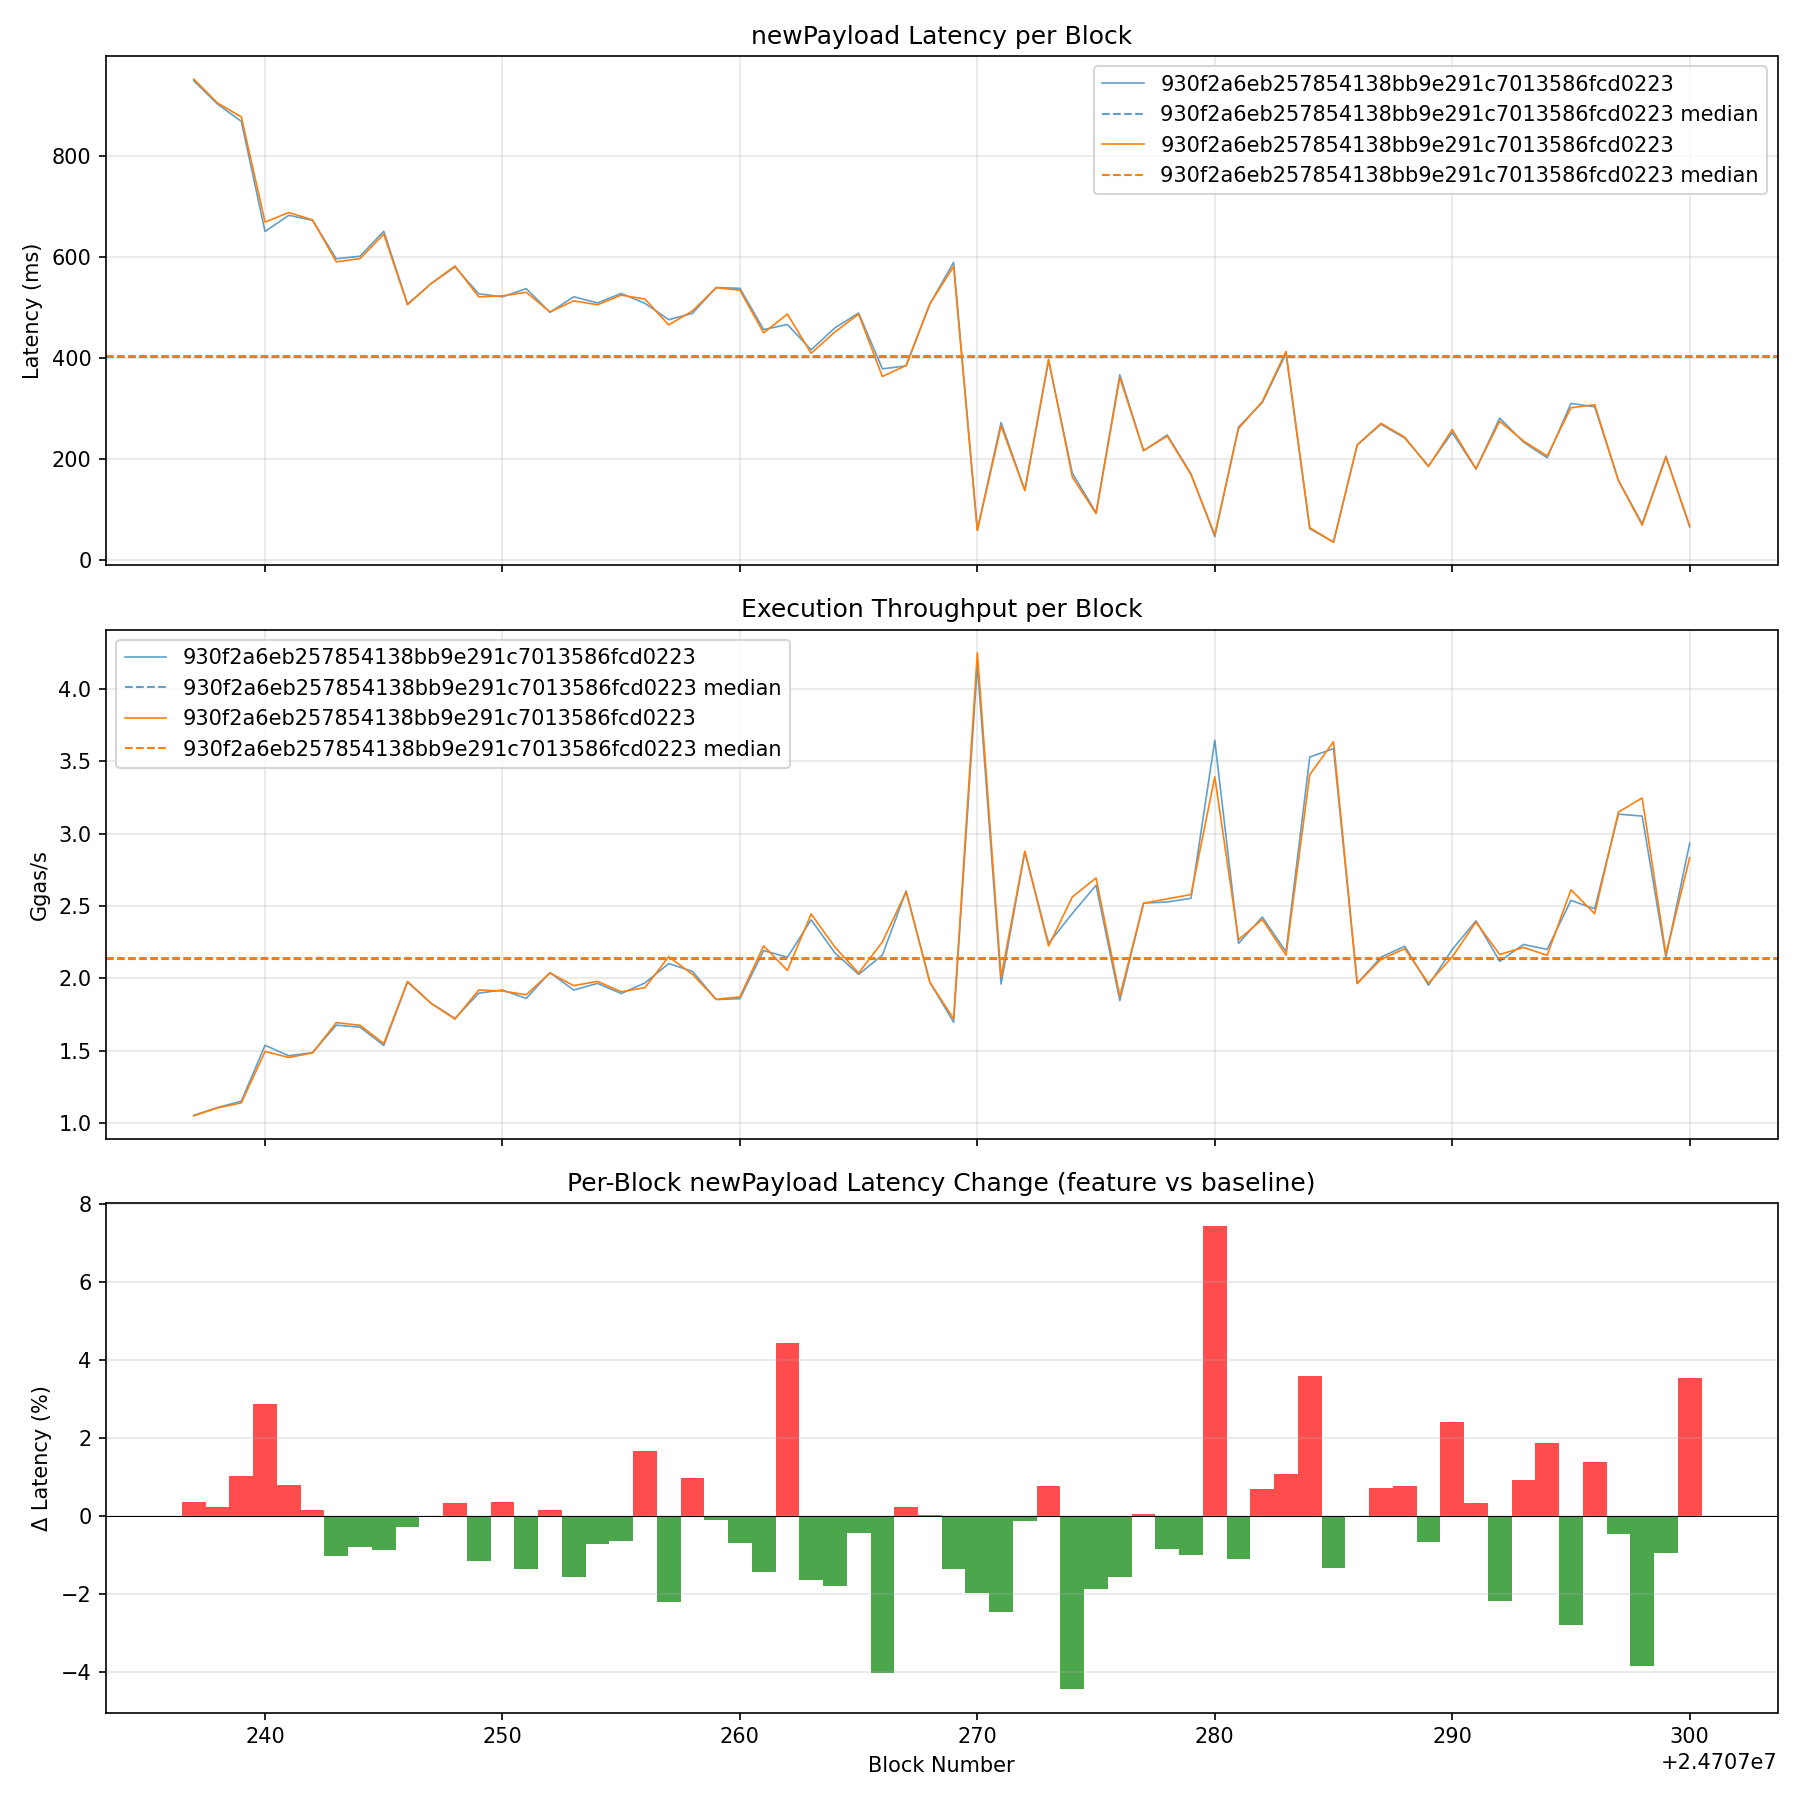
↑ I think this settles that derek reports are just noise. I can see improving the c2c metrics and can see that that place is no longer a hotspot but I don't think it's worth it |
|
derek bench otlp=false blocks=big baseline=930f2a6eb257854138bb9e291c7013586fcd0223 feature=a363ddc3a3f3ffcc08d5609f933918778f846f50 |
|
derek bench otlp=false blocks=big baseline=930f2a6eb257854138bb9e291c7013586fcd0223 feature=930f2a6eb257854138bb9e291c7013586fcd0223 |
|
cc @pepyakin ✅ Benchmark complete! View job Benchmark Results
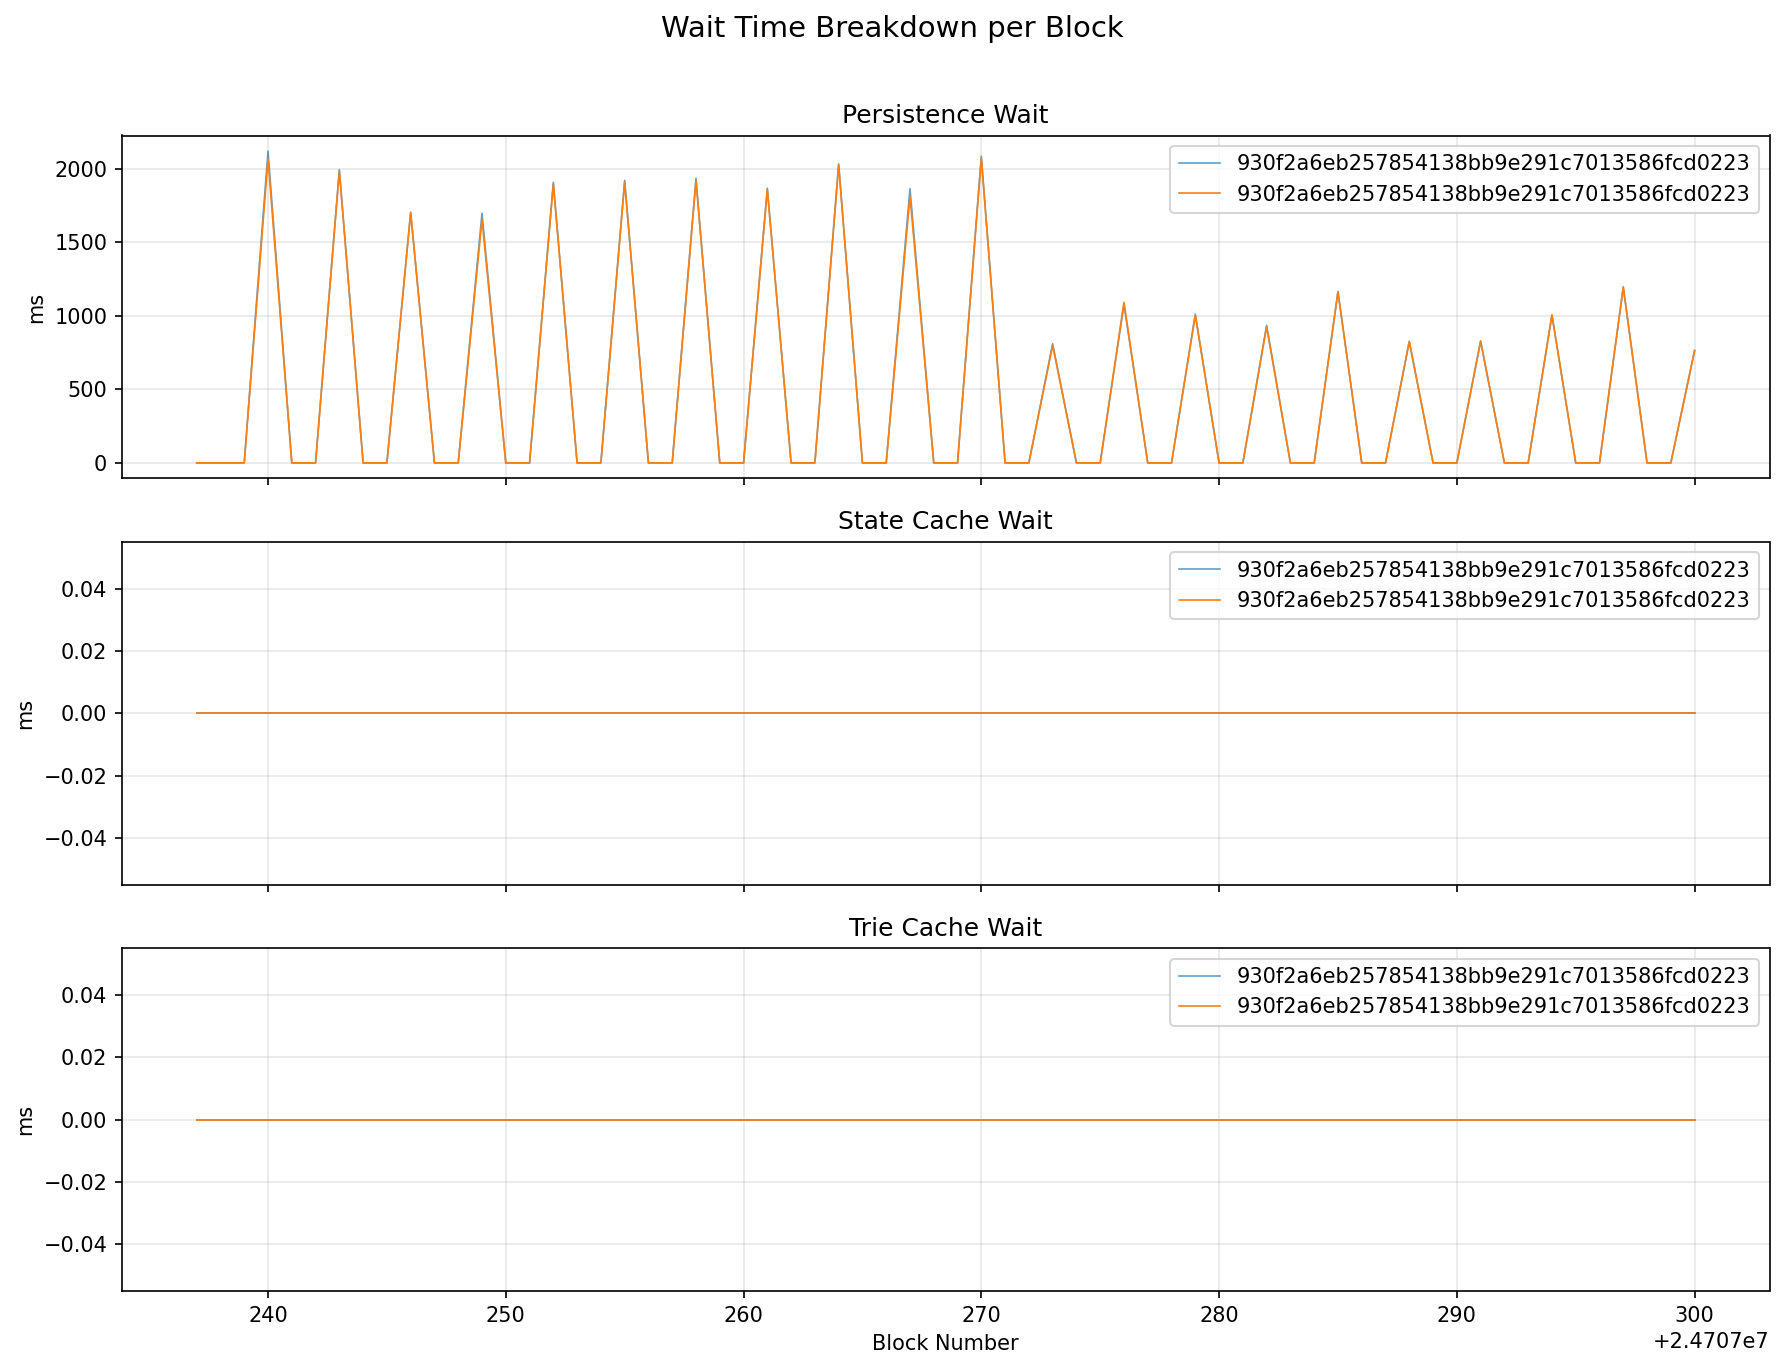
64 big blocks Wait Time BreakdownPersistence Wait
Trie Cache Update Wait
Execution Cache Update Wait
ChartsLatency, Throughput & Diff
Wait Time Breakdown
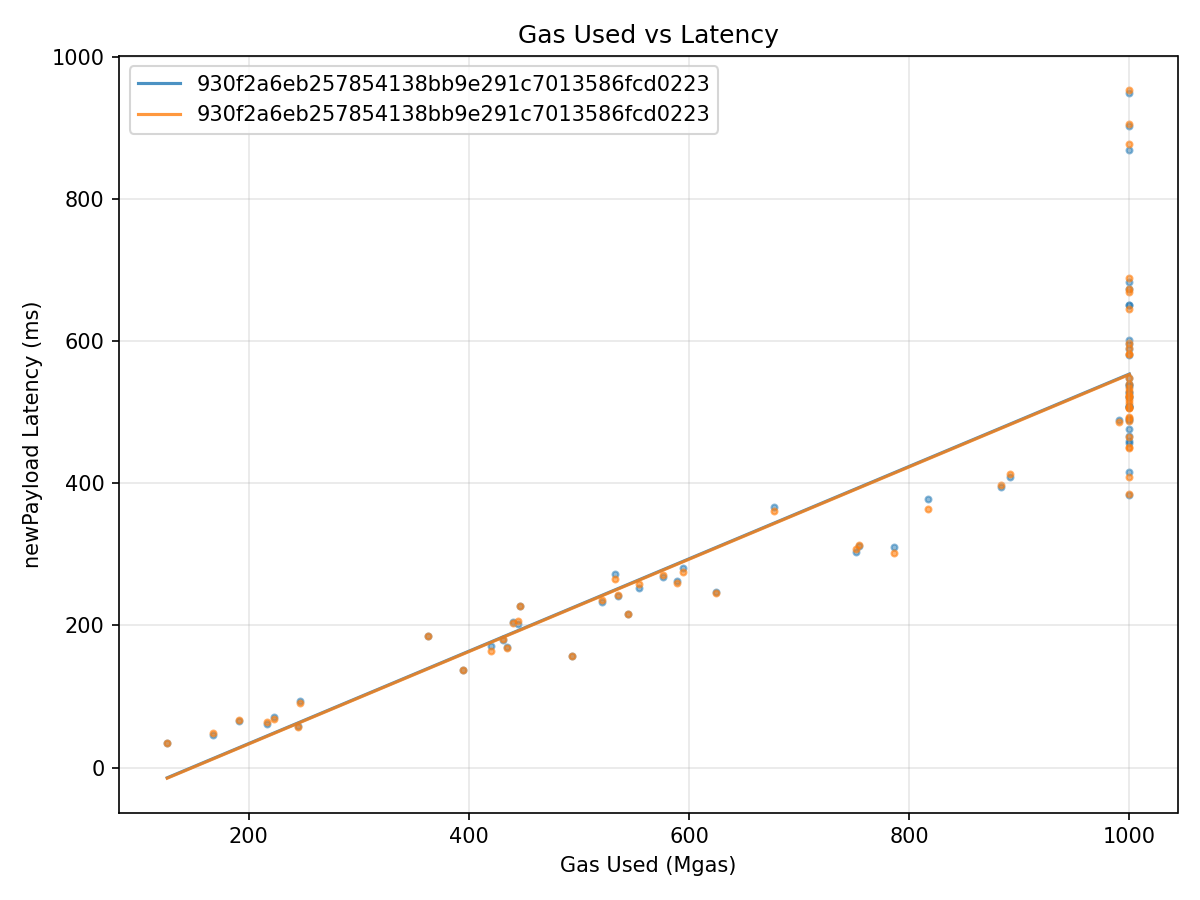
Gas vs Latency
Grafana Dashboard |
|
derek bench otlp=false blocks=big baseline=930f2a6eb257854138bb9e291c7013586fcd0223 feature=a363ddc3a3f3ffcc08d5609f933918778f846f50 |
8157dbb to
1080ba2
Compare
|
derek bench otlp=false blocks=big |
|
cc @pepyakin ✅ Benchmark complete! View job Benchmark Results
64 big blocks Wait Time BreakdownPersistence Wait
Trie Cache Update Wait
Execution Cache Update Wait
ChartsLatency, Throughput & Diff
Wait Time Breakdown
Gas vs Latency
Grafana Dashboard |

1080ba2 to
f81632a
Compare
|
derek bench otlp=false blocks=big |
|
cc @pepyakin ✅ Benchmark complete! View job Benchmark Results
64 big blocks Wait Time BreakdownPersistence Wait
Trie Cache Update Wait
Execution Cache Update Wait
ChartsLatency, Throughput & Diff
Wait Time Breakdown
Gas vs Latency
Grafana Dashboard |
|
derek bench otlp=false blocks=big |
|
❌ Invalid bench command Invalid value(s): Usage: |
|
derek bench big-blocks |
|
🚀 Benchmark started! View job ⏳ Status: Running benchmarks... Config: blocks: |
Every time a core updates the availability counter it claims the cacheline invalidating it on other cores. Workers essentially ping pong this cacheline to each others. This showed up during perf c2c profiling.
The solution is to have each worker report its status on its own cacheline. When a non-worker core wants to know the status/counts, it will request the cachelines making them shared temporarily. This path should become a bit more expensive but AFAIU it's also a less frequent one.
At least that's the theory.