Skip to content

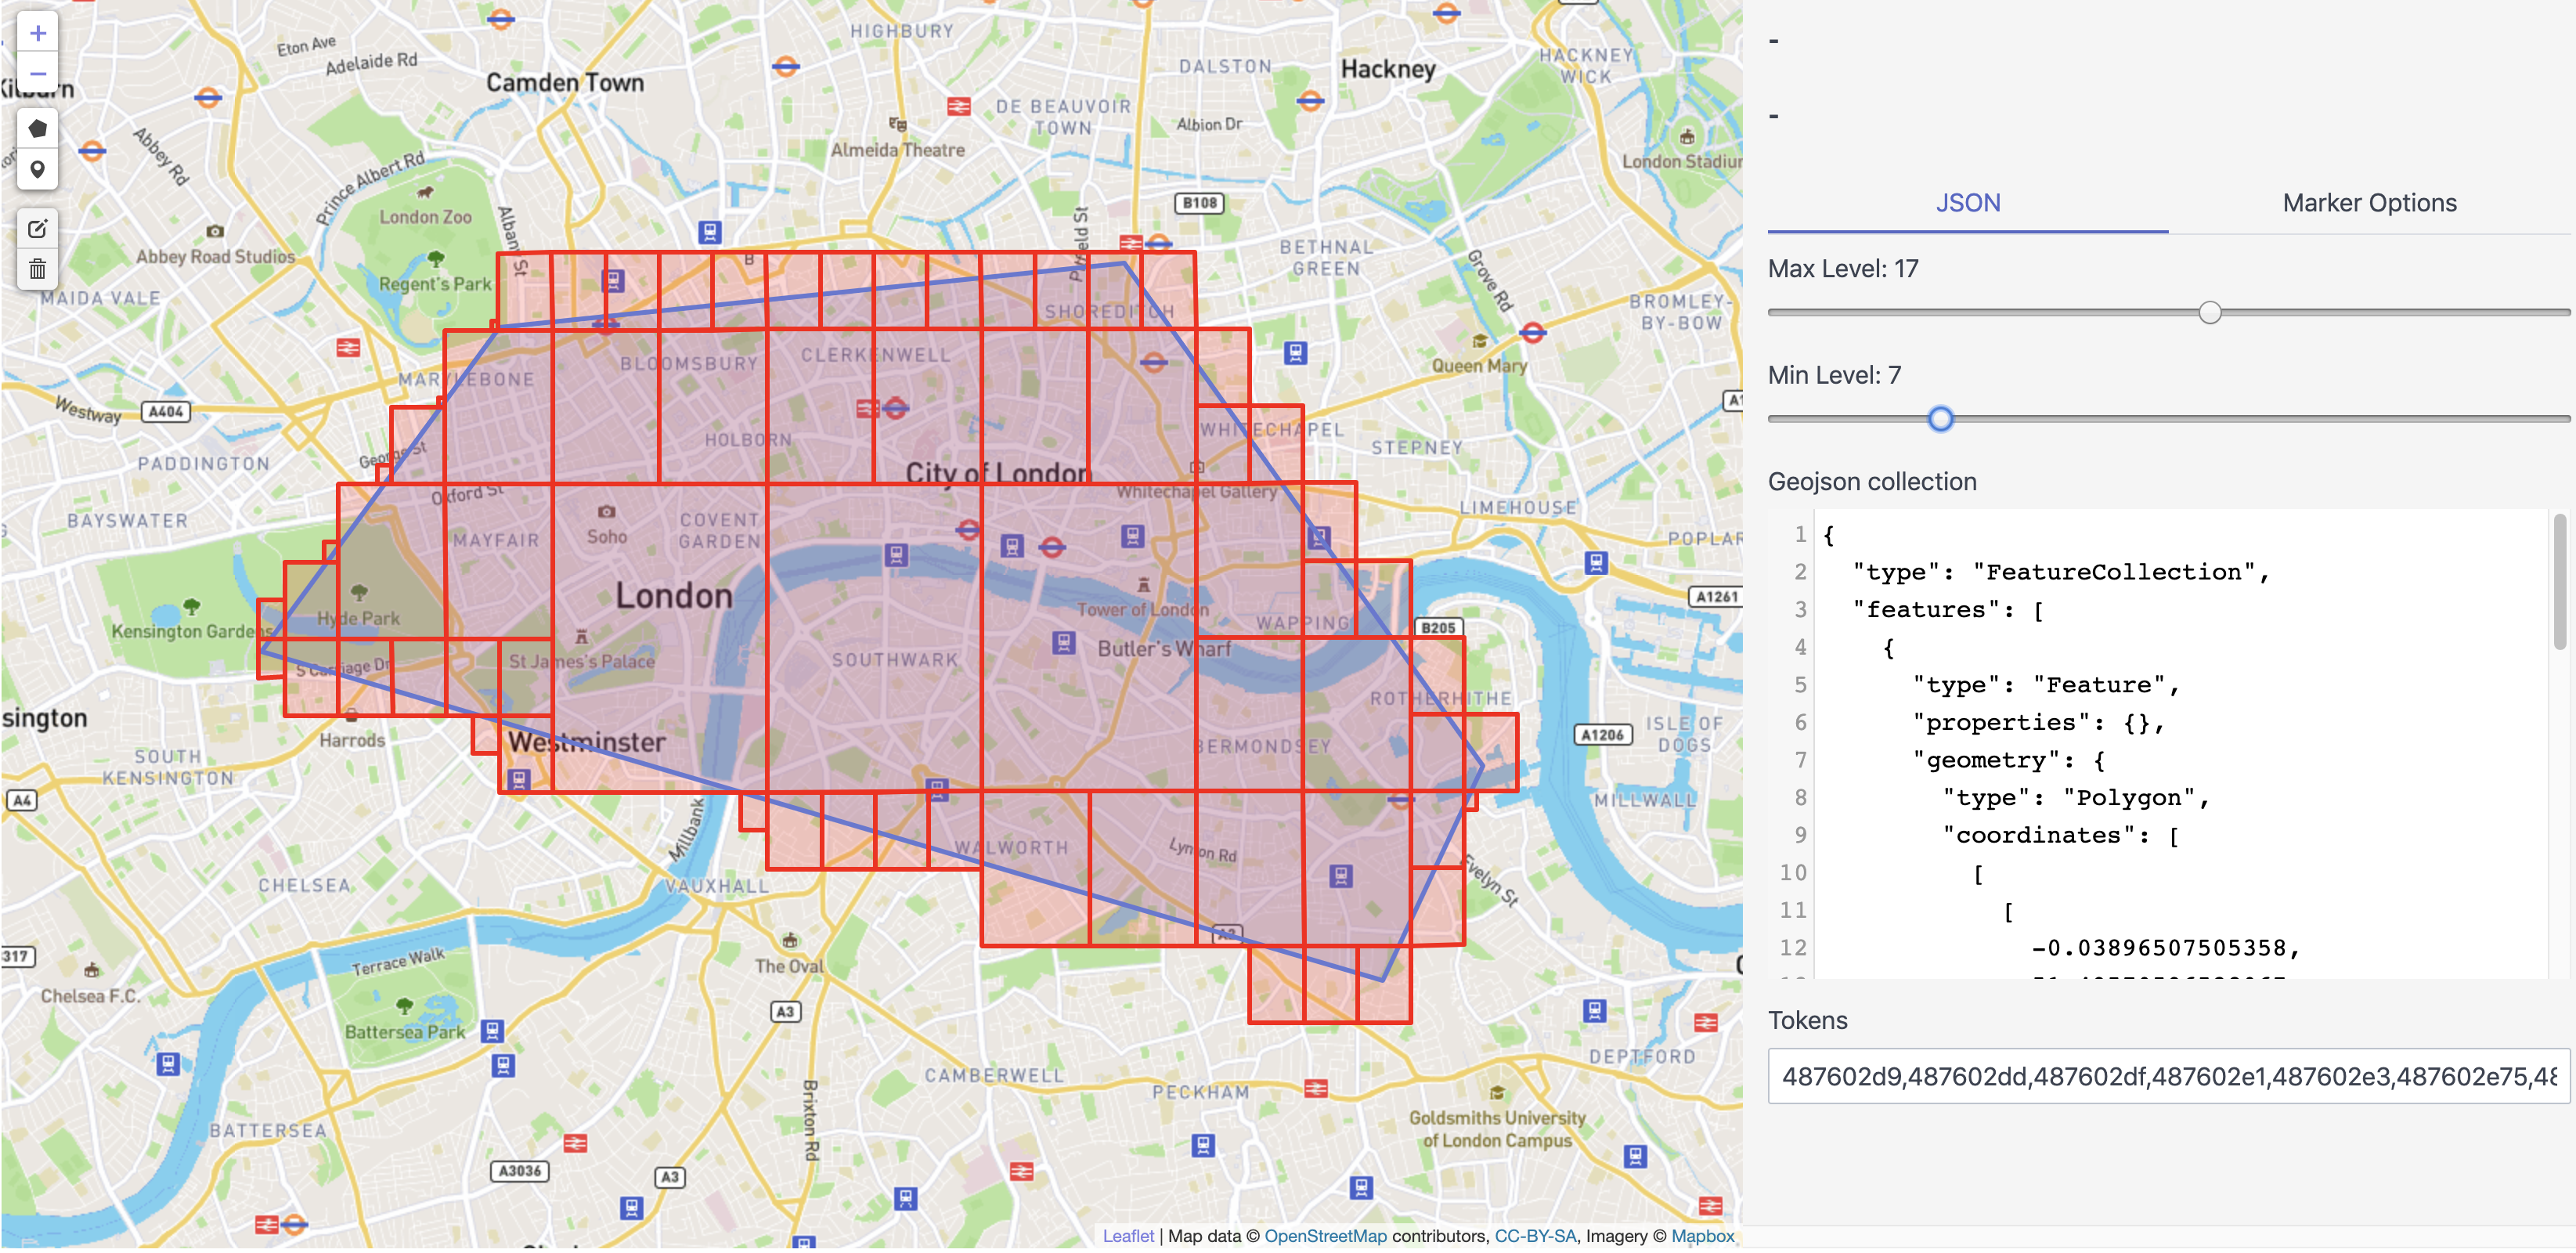
Draw a polygon on the map or paste a geoJSON and explore how the s2.RegionCoverer covers it with S2 cells depending on the min and max levels

License

Notifications You must be signed in to change notification settings

pantrif/s2-geojson

Repository files navigation

Build Status GoDoc Go Report Card codecov

Preview

preview

Summary

Draw a polygon on the map or paste a geoJSON and explore how the s2.RegionCoverer covers it with S2 cells depending on the min and max levels. Drop a marker and inspect the corresponding S2 cell.

  • Display s2 cells on leaflet map using the region coverer.
  • Convert geojson features to cell unions depending on the min and max levels (supported only Polygons and Points).
  • Draw points and polygons.
  • Check point & circle intersection with the geoJSON features.

Quick start

 go run cmd/s2-geojson/main.go

Docker

docker run -p 8080:8080 --rm lmaroulis/s2-geojson

License

This project is licensed under the MIT License - see the LICENSE file for details.

About

Draw a polygon on the map or paste a geoJSON and explore how the s2.RegionCoverer covers it with S2 cells depending on the min and max levels

Topics

Resources

License

Stars

Watchers

Forks

Releases

No releases published

Packages

No packages published