


A Python package for visualizing and analyzing hyperspectral data in coastal regions
- Free software: MIT License
- Documentation: https://hypercoast.org
HyperCoast is a Python package designed to provide an accessible and comprehensive set of tools for visualizing and analyzing hyperspectral data in coastal regions. Building on the capabilities of popular packages like Leafmap and PyVista, HyperCoast streamlines the process of exploring and interpreting complex remote sensing data. This enables researchers and environmental managers to gain deeper insights into the dynamic processes occurring in coastal environments.
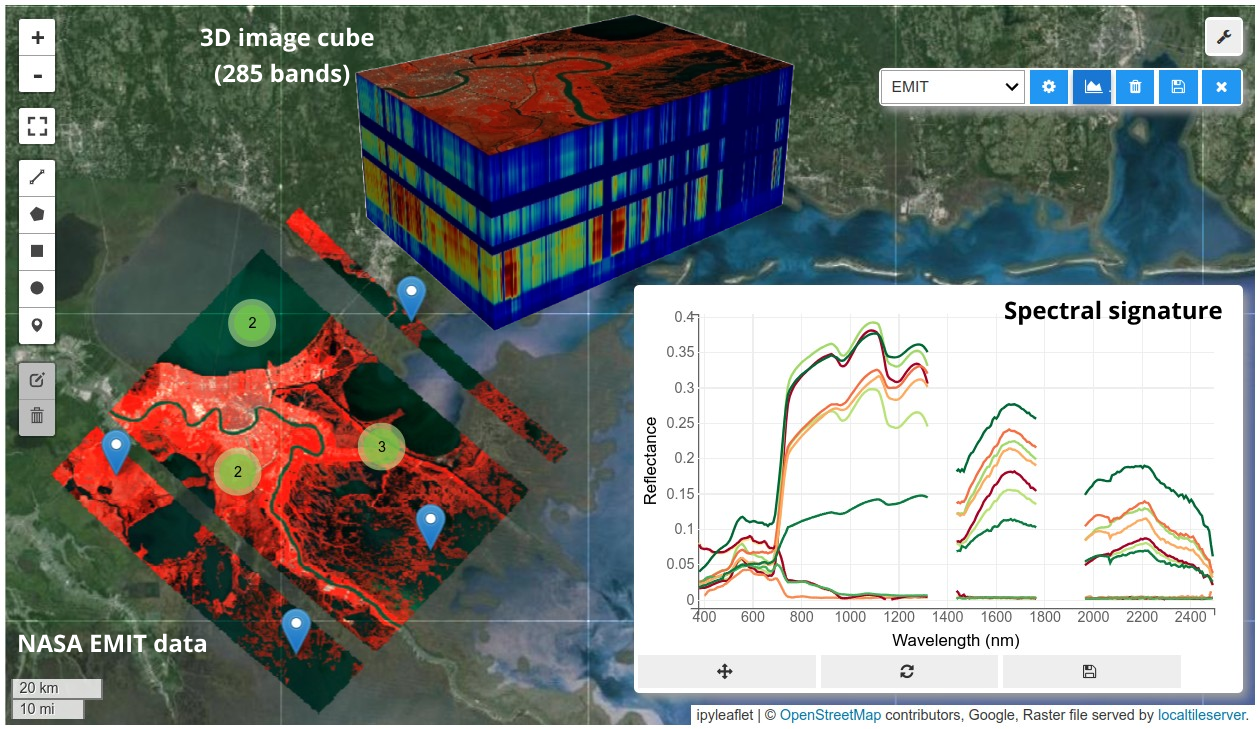
HyperCoast supports the reading and visualization of hyperspectral data from various NASA airborne and satellite missions, such as AVIRIS, NEON, PACE, and EMIT, along with other datasets like DESIS and ECOSTRESS. Users can interactively explore hyperspectral data, extract spectral signatures, change band combinations and colormaps, visualize data in 3D, and perform interactive slicing and thresholding operations (see Figure 1). Additionally, leveraging the earthaccess package, HyperCoast offers tools for searching NASA hyperspectral data interactively. This makes it a versatile and powerful tool for working with hyperspectral data globally, with a particular focus on coastal regions.
- Searching for NASA hyperspectral data interactively
- Interactive visualization and analysis of hyperspectral data, such as AVIRIS, DESIS, EMIT, PACE, NEON AOP
- Interactive visualization of NASA ECOSTRESS data
- Interactive visualization of PACE chlorophyll-a data
- Interactive extraction and visualization of spectral signatures
- Changing band combinations and colormaps interactively
- Visualizing hyperspectral data in 3D
- Visualizing ERA5 temperature data in 3D
- Interactive slicing and thresholding of hyperspectral data in 3D
- Saving spectral signatures as CSV files
- Visualizing hyperspectral data in 3D (notebook)

- Interactive slicing of hyperspectral data in 3D (notebook)

- Interactive thresholding of hyperspectral data in 3D (notebook)

- Visualizing ERA5 temperature data in 3D (notebook)

- Changing band combinations and colormaps interactively (notebook)


This project draws inspiration and adapts source code from the nasa/EMIT-Data-Resources repository. Credit goes to the original authors.