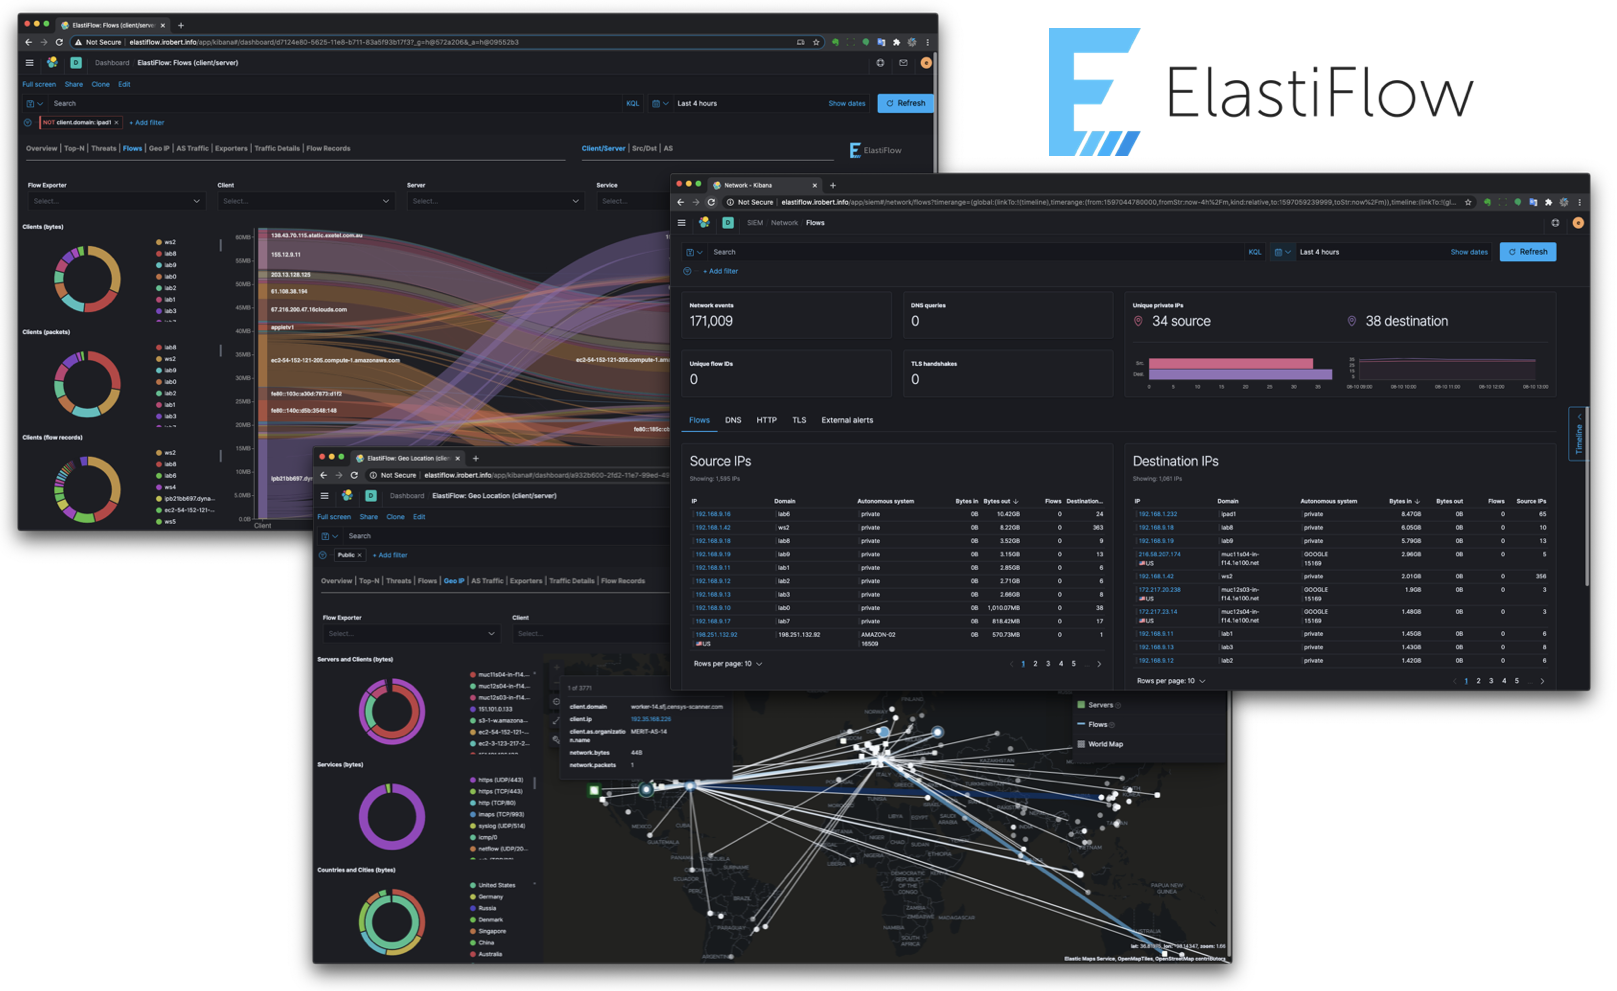
ElastiFlow™ provides network flow data collection and visualization using the Elastic Stack (Elasticsearch, Logstash and Kibana). It supports Netflow v5/v9, sFlow and IPFIX flow types (1.x versions support only Netflow v5/v9).
I was inspired to create ElastiFlow™ following the overwhelmingly positive feedback received to an article I posted on Linkedin... WTFlow?! Are you really still paying for commercial solutions to collect and analyze network flow data?
| Organization | Feedback |
|---|---|
 |
"ElastiFlow has significantly reduced our network flow monitoring costs. The flexibility and extensibility inherent to ElastiFlow was essential for an easy integration with our infrastructure monitoring suite." |
 |
“Right now this is my personal favorite analytics tool. I use it extensively and am always finding a new way to leverage it." |
 |
"We're using it since two months in our new datacenter and our network admins are very happy and impressed." |
 |
"Of all the netflow tools I’ve tested it has, by far, the best visualizations." |
 |
"We absolutely love ElastiFlow and recently stood it up in production. Looking forward to new functionality and dashboards." |
NOTE - Please refer to
INSTALL.mdfor installation instructions.
ElastiFlow™ is built using the Elastic Stack, including Elasticsearch, Logstash and Kibana. Please refer to INSTALL.md for instructions on how to install and configure ElastiFlow™.
If you are new to the Elastic Stack, this video goes beyond a simple default installation of Elasticsearch and Kibana. It discusses real-world best practices for hardware sizing and configuration, providing production-level performance and reliability.

Additionally local SSD storage should be considered as mandatory! For an in-depth look at how different storage options compare, and in particular how bad HDD-based storage is for Elasticsearch (even in multi-drive RAID0 configurations) you should watch this video...

NOTE: Please make sure that have reviewed KNOWN_ISSUES.md prior to getting started.


The following dashboards are provided.
NOTE: The dashboards are optimized for a monitor resolution of 1920x1080.

There are separate Top-N dashboards for Top Talkers, Services, Conversations and Applications.


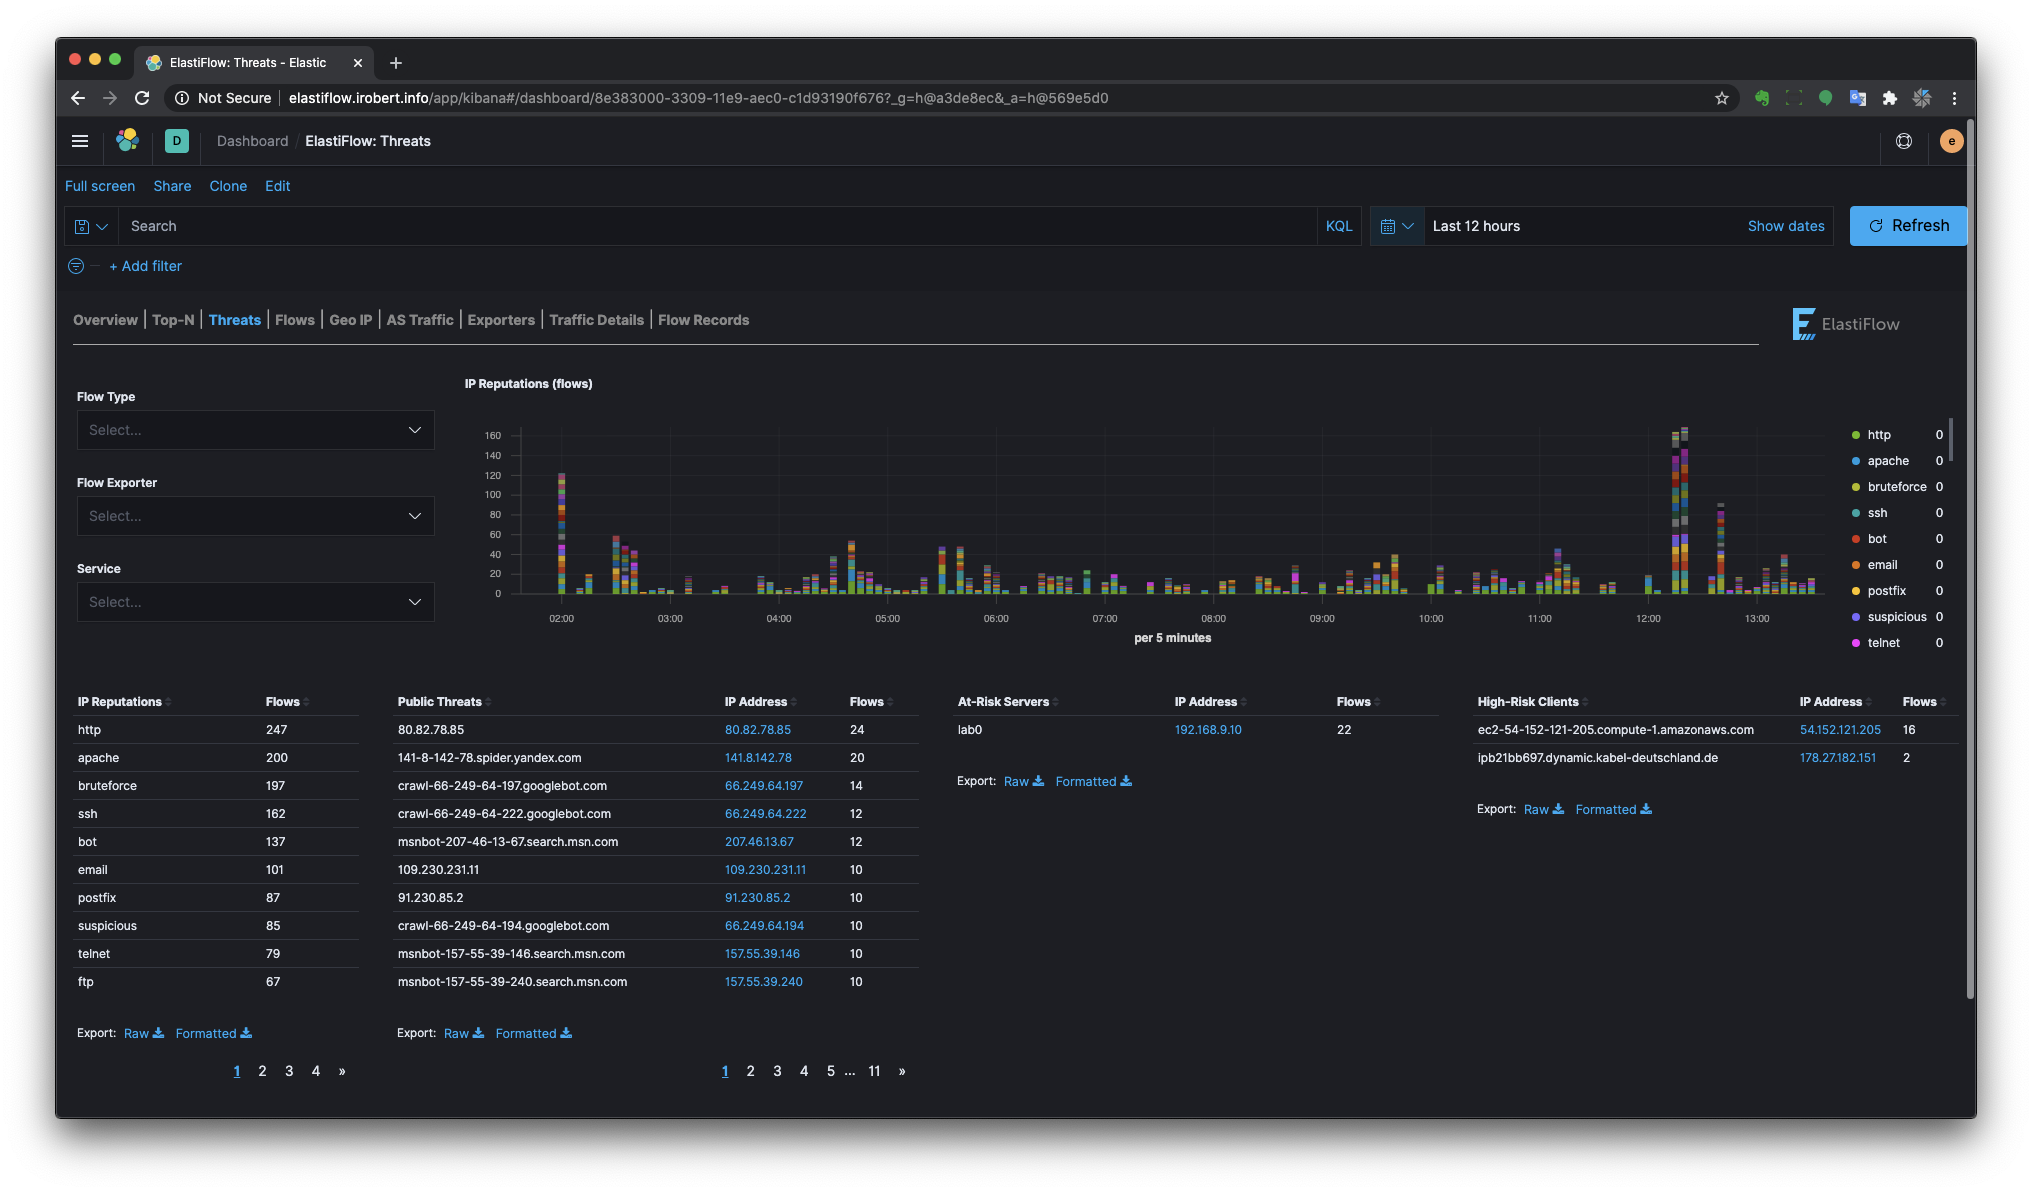
ElastiFlow™ includes a dictionary of public IP addresses that are known to have a poor reputation. This dictionary is built from many OSINT data sources, normalized to a common taxonomy. The Threats dashboard uses this IP reputation information to highlight three threat/risk types.
- Public Threats - Public clients with a poor IP reputation that are reaching private addresses.
- At-Risk Servers - Private Servers that are being reached by clients with a poor IP reputation.
- High-Risk Clients - Private clients that are accessing public servers which have a poor reputation.
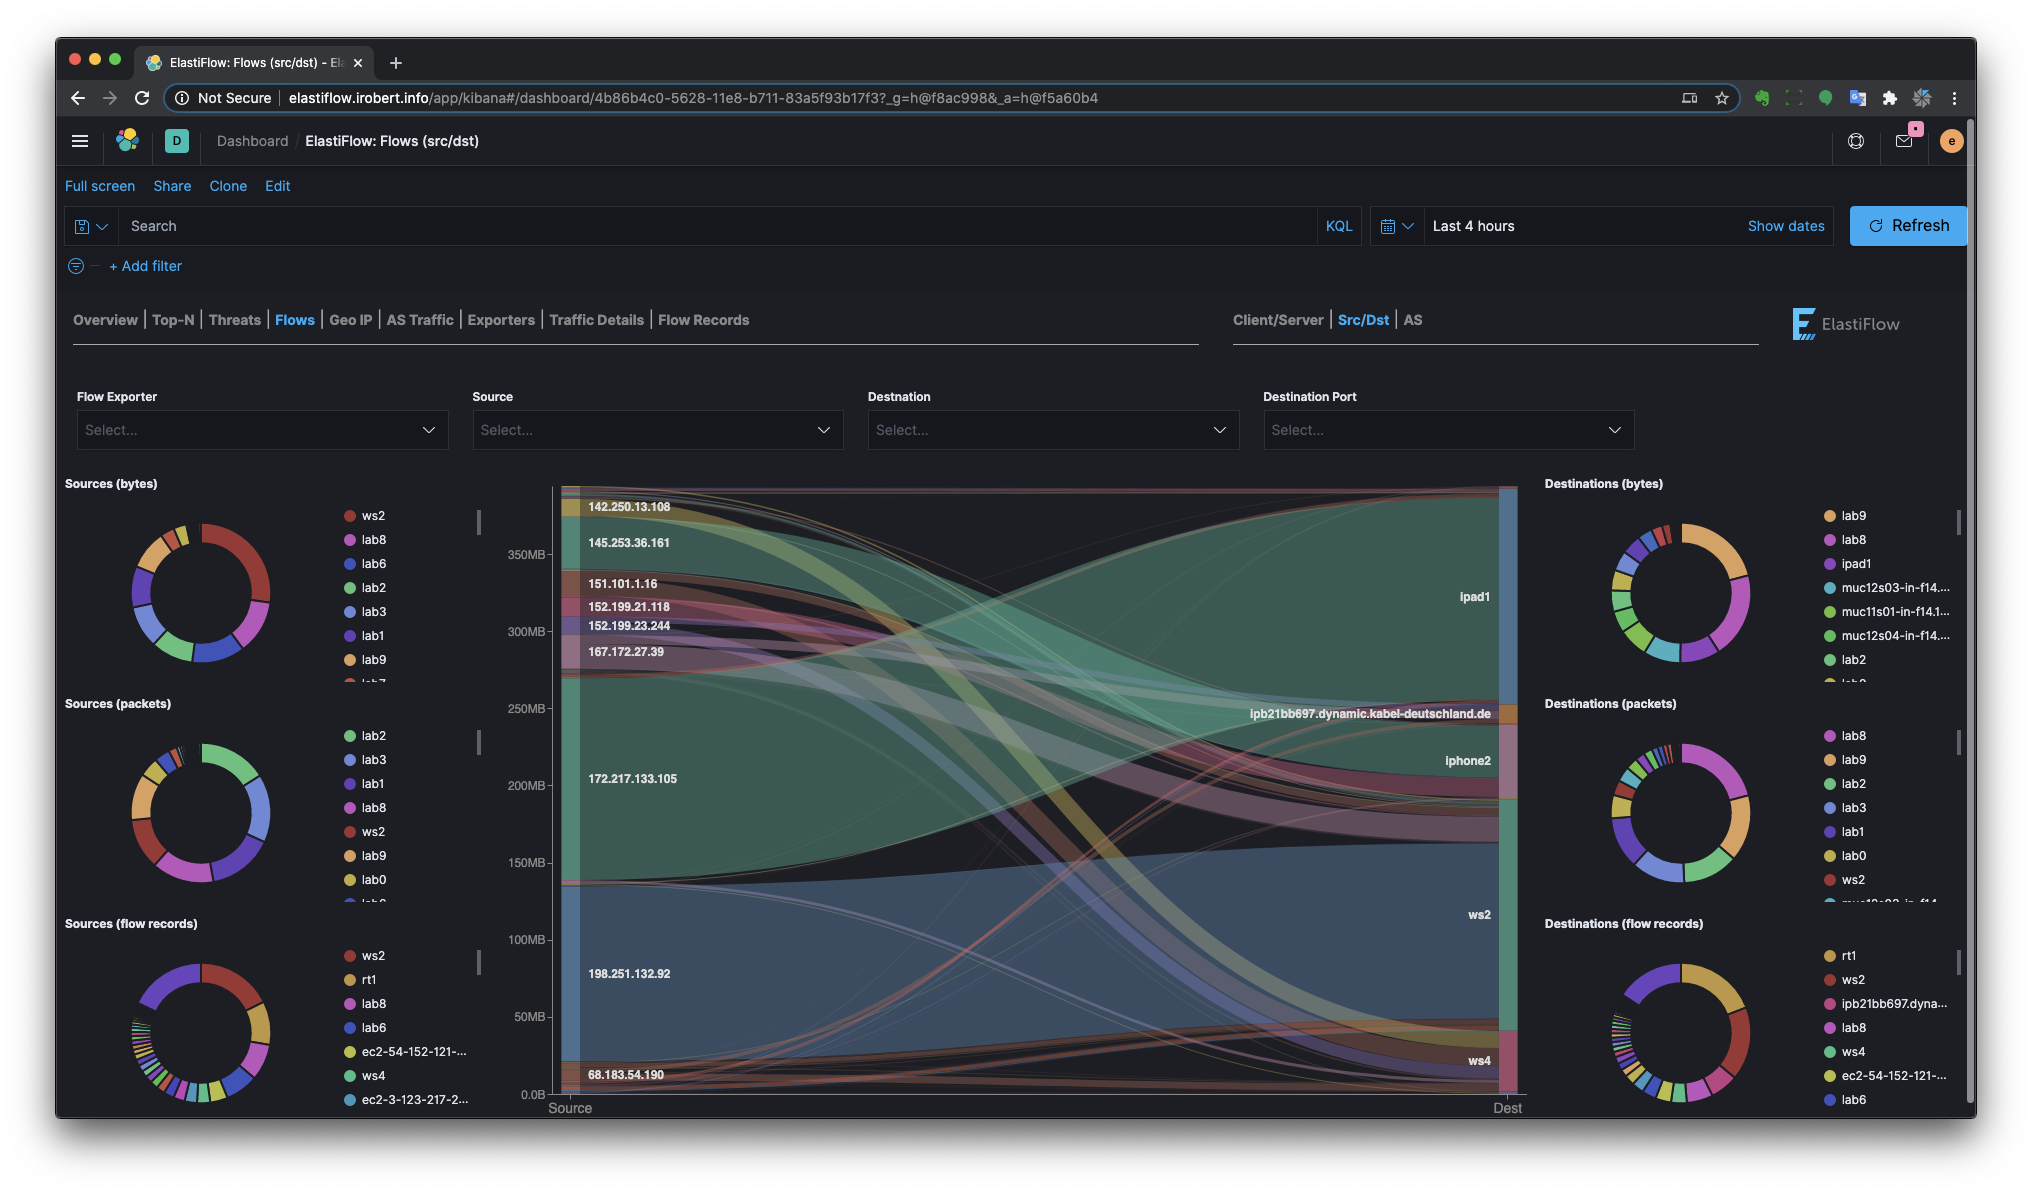
There are separate Sankey dashboards for Client/Server, Source/Destination and Autonomous System perspectives. The sankey visualizations are built using the new Vega visualization plugin.


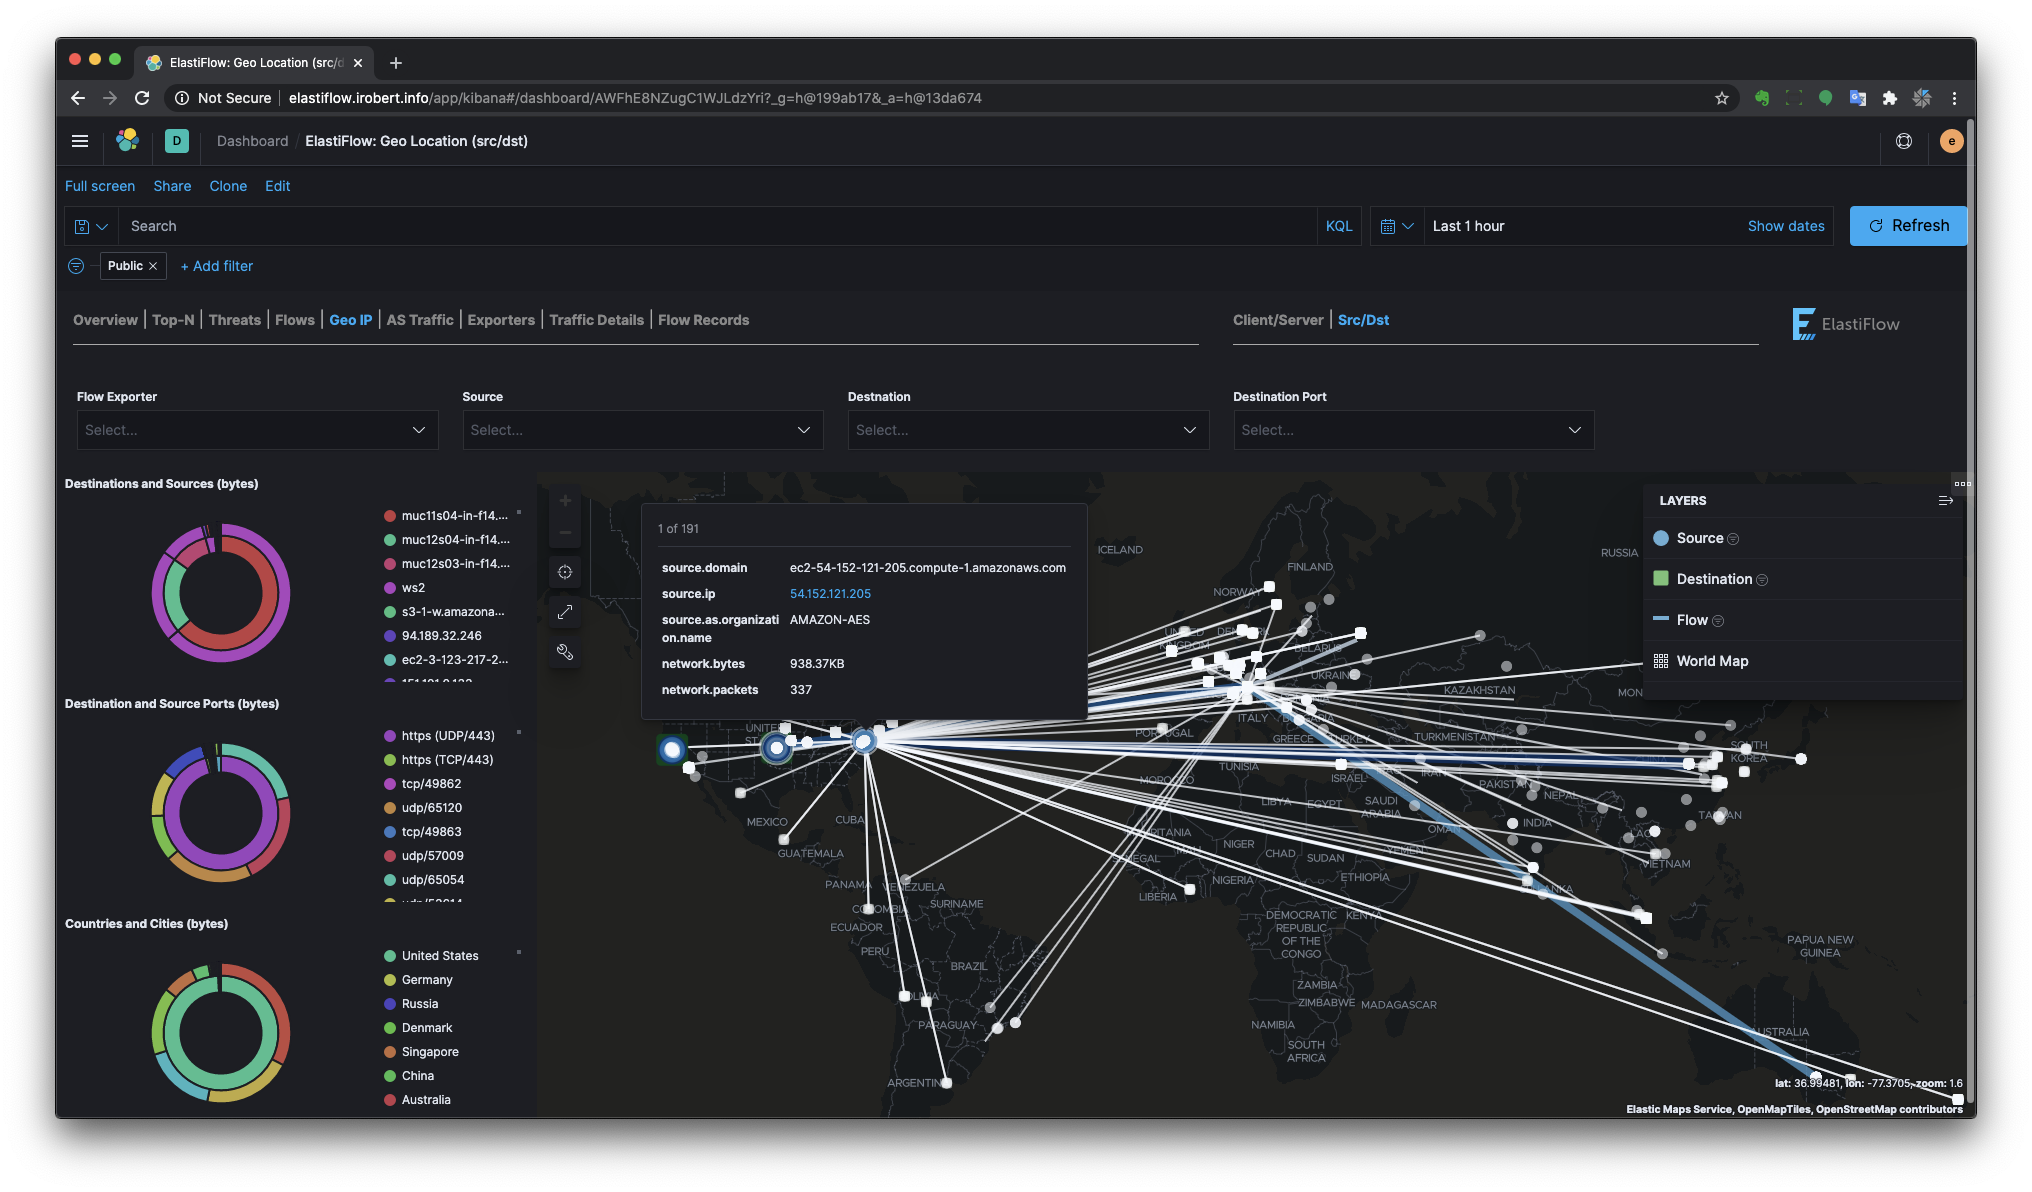
There are separate Geo Location dashboards for Client/Server and Source/Destination perspectives.

Provides a view of traffic to and from Autonomous Systems (public IP ranges)


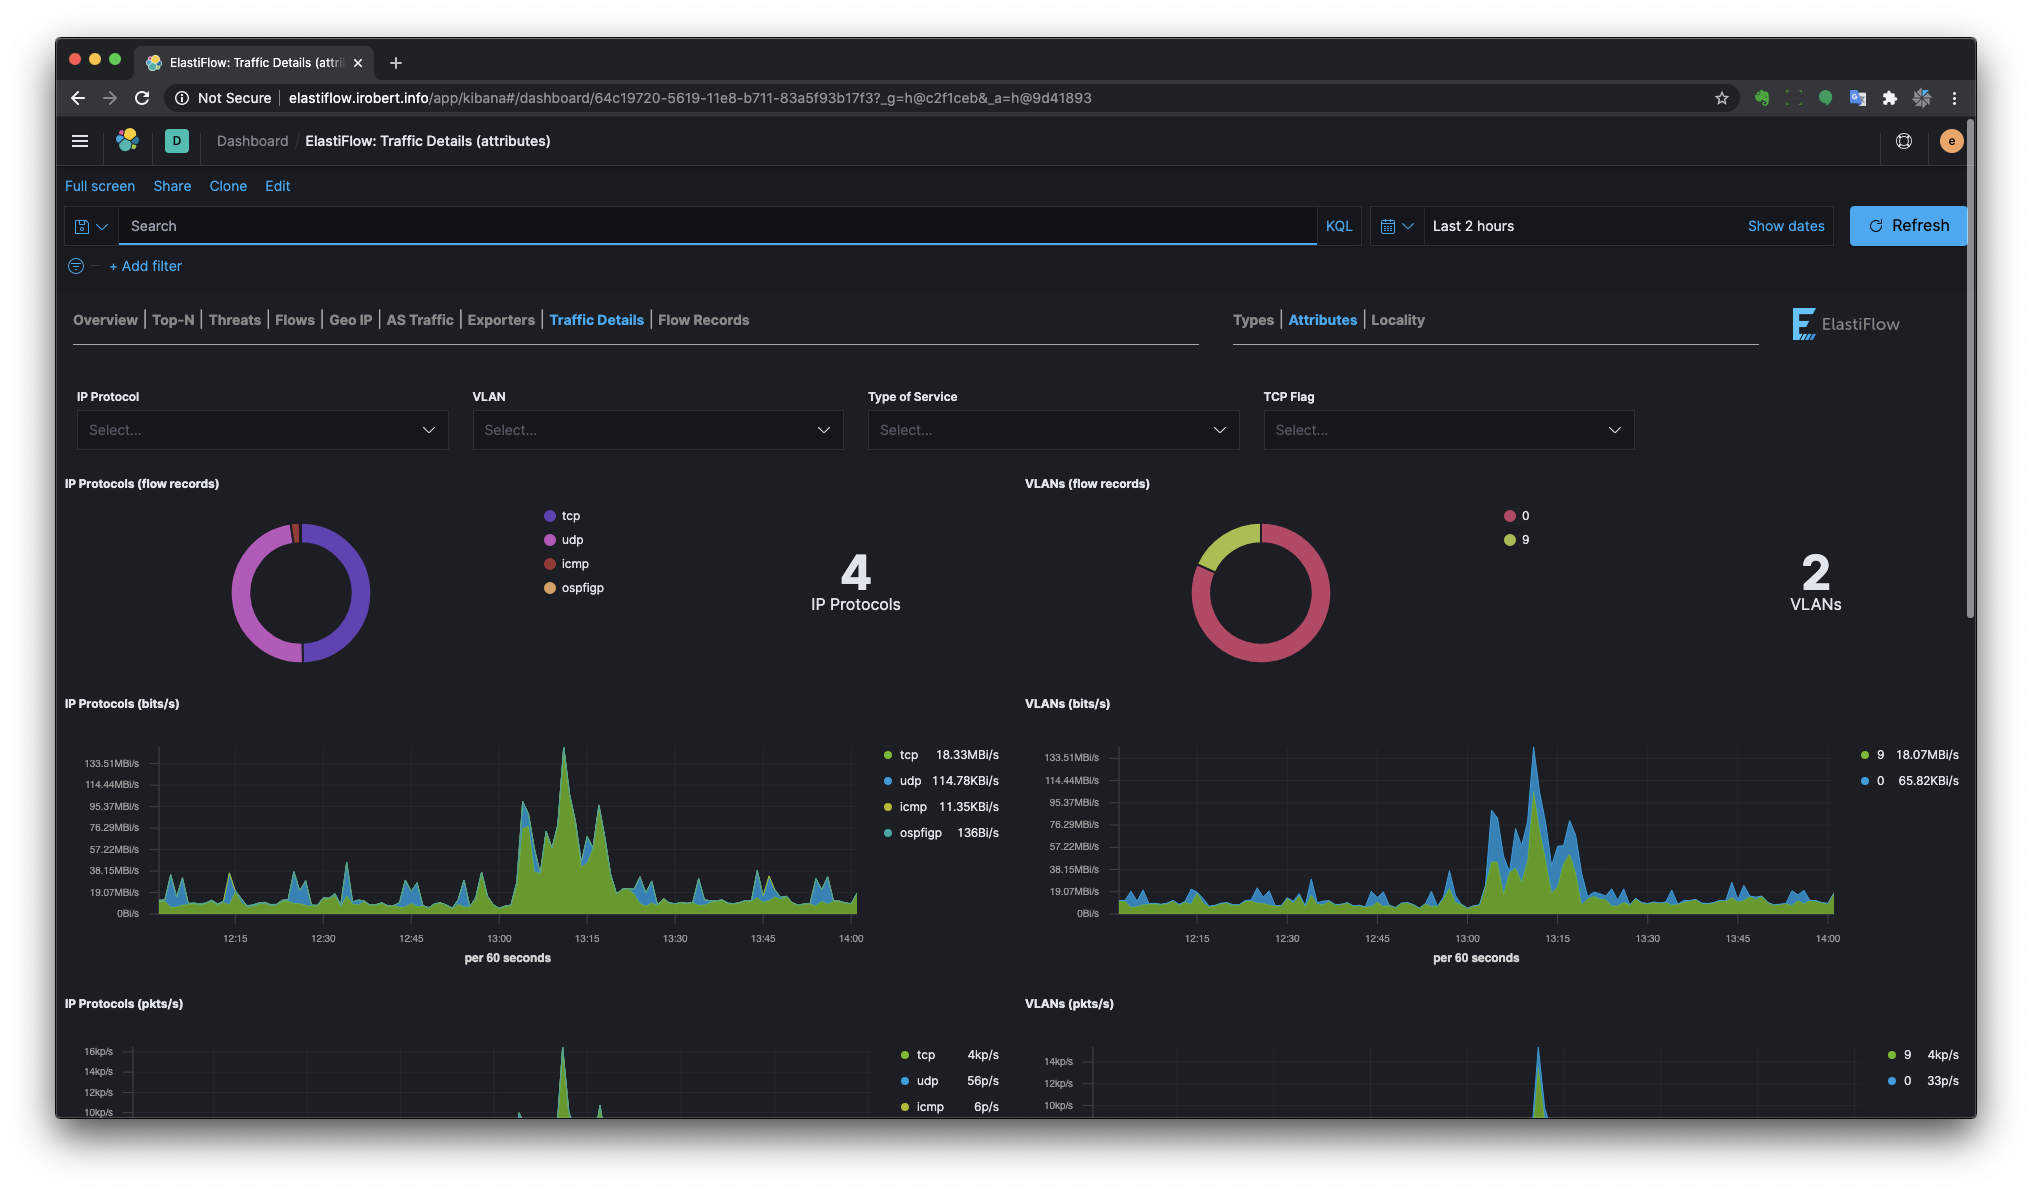
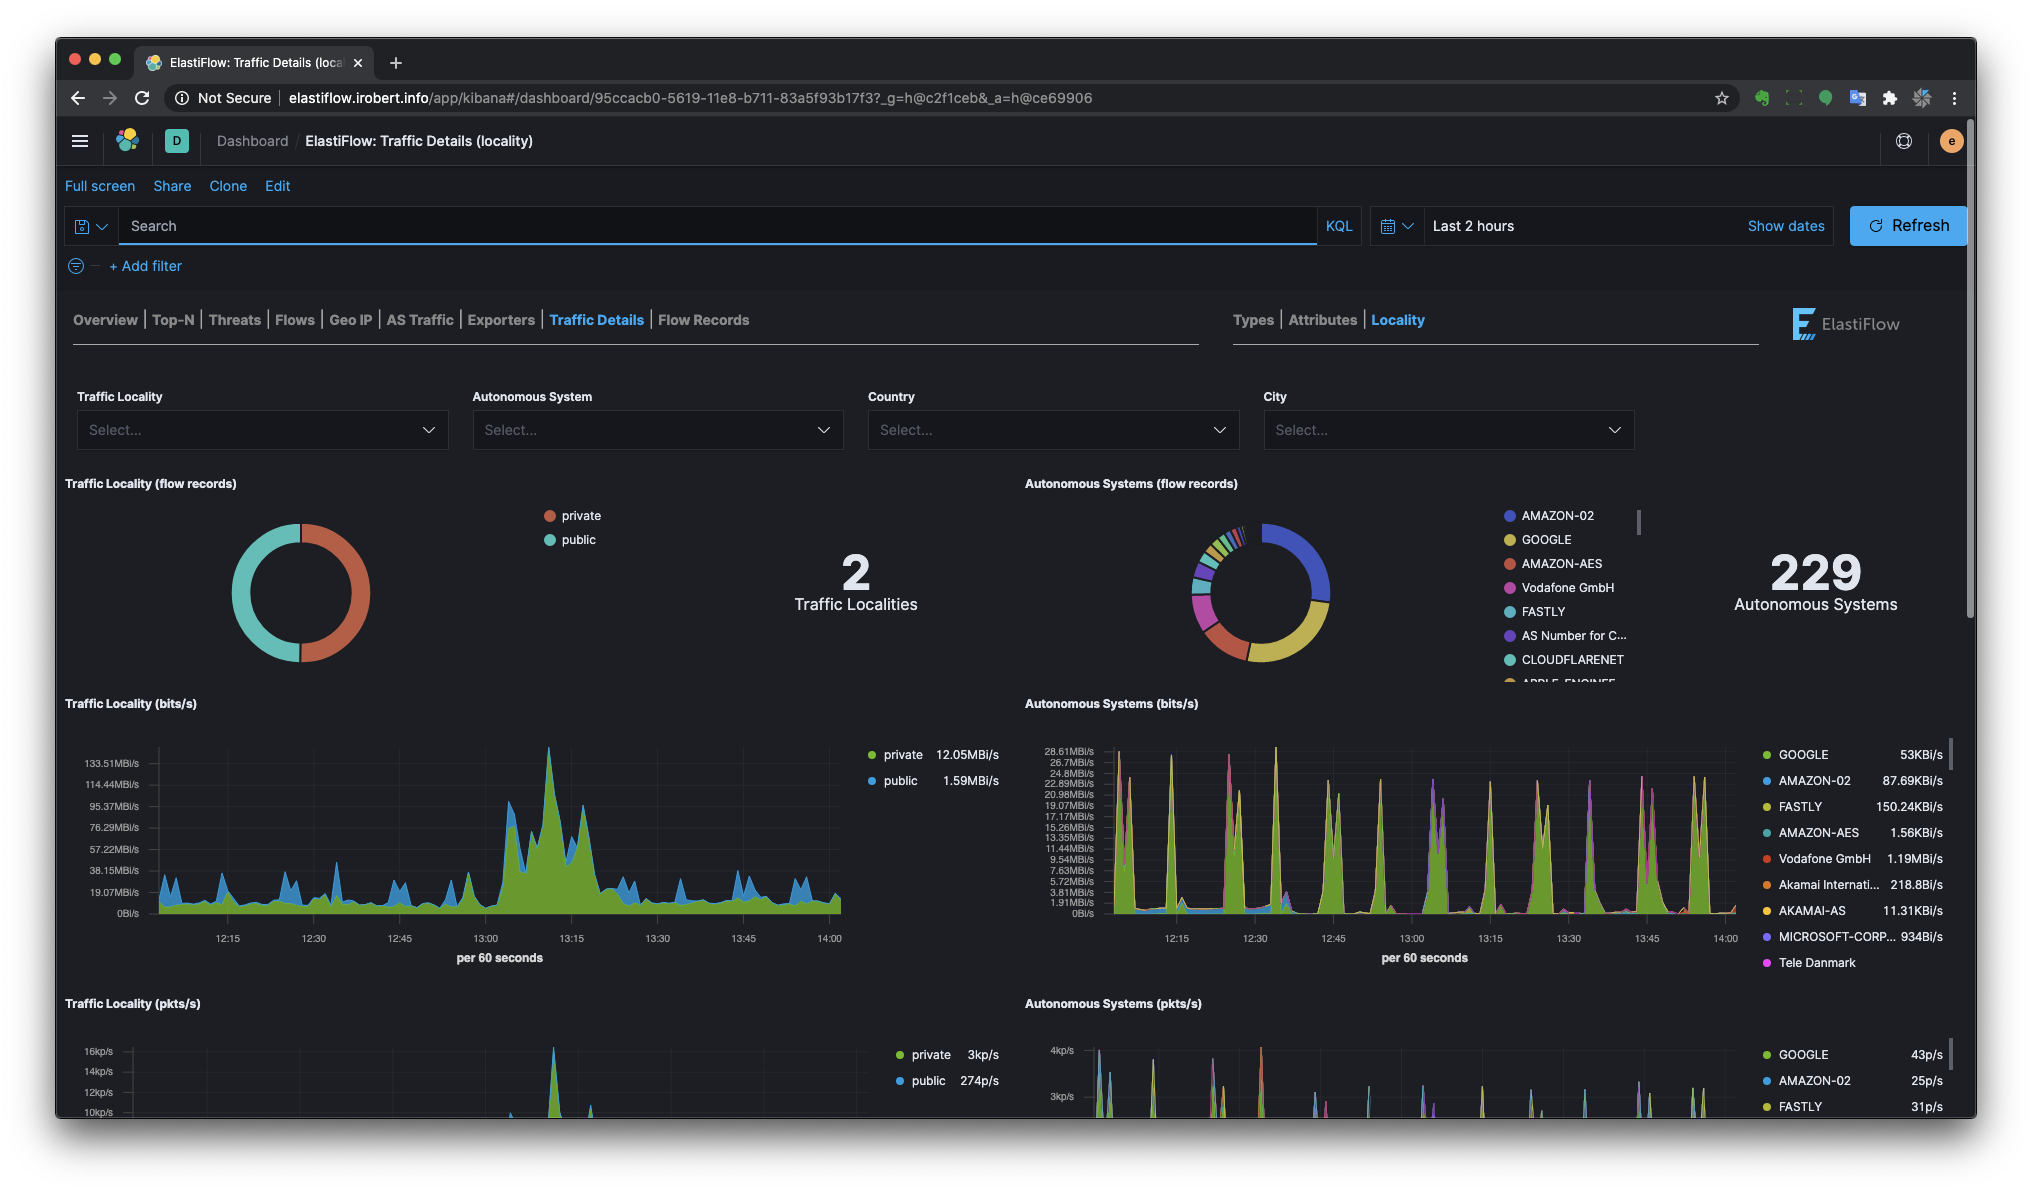
Provides more detailed breakdown of various network traffic characteristics.


ElastiFlow™ v3.4.0 added support for IPFIX records from Ziften's ZFlow agent. In addition to being fully integrated with the standard dashboards, a stand-alone ZFlow dashboards displays network traffic based on user and command data provided by ZFlow.

This product includes GeoLite2 data created by MaxMind, available from (http://www.maxmind.com)