SeaSketch reports are built upon two major components. The first are geoprocessing services built currently on arcgis server. These services accept a "Sketch" or "SketchCollection" and output the results of spatial analysis on those feature(s). The second component is that used to visualize the output of these services. These "Client Reporting Modules" can depend on the output of zero, one, or many geoprocessing services and present user-friendly representations of the output. This repository is a template from which all client reporting modules should be based on.
First clone this template repository. Just run the following commands to clone this repo locally, and install all it's dependencies.
git clone [email protected]:mcclintock-lab/seasketch-report-template.git
cd seasketch-report-template
npm install
Included in the dependencies is the SeaSketch reporting api library. This libary
contains the base ReportTab class from which all report code is based.
You'll want to test your reporting module code within SeaSketch as you work. To do so, let startup a local server to host this module and startup a daemon that will compile changes to source files as they are modified.
Open a new terminal, and run grunt connect. Then in another terminal, run grunt watch. This will start a local server at http://localhost:8080/ which makes accessible every file under dist/. grunt watch will watch all source files and recompile them for hosting under dist/. All grunt-related commands are configured via Gruntfile.coffee. See the Grunt docs for more info on how to use this file. Just think of it as a webapp-focused Makefile. If you need to manually compile the javascript and stylesheet files within dist, simple run grunt without any arguments.
Now that you are hosting this demo module locally you can configure SeaSketch to use it. Each SketchClass supports a the addition of client reporting module urls. For debugging purposes, you can load a reporting module url for any SketchClass as part of your temporary browser session. This means you can just go to the relevant SeaSketch project on the production site, and load and view development code hosted on your local machine.
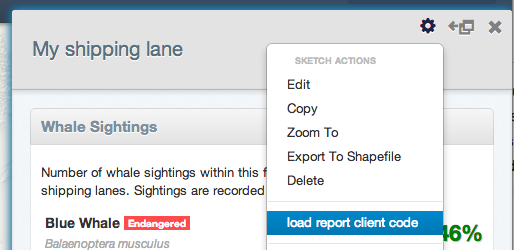
To do so first open the attributes/report for your SketchClass of interest, click on the gear icon, and choose load report client code.
Instruct SeaSketch to load http://localhost:8080/report.js. Load the report again, and you should see the demo report tab, and the gear icon should turn red indicating you have a custom report loaded. Via the same context menu you can choose clear report client code to reset to the default, or choose load again to reload this file without refreshing your browser.
Report implementations are simply Javascript, HTML, and CSS code, and the code framework is quite minimal and in flux. The best way to get up to speed is to just dive into the demo and other reporting modules hosted under the mcclintock-lab github organization. Keep the following in mind while developing new reports:
Reporting modules are not sandboxed in any way, and represent a very serious security and reliability issue. All new reports must be audited by either Chad or Todd before they are published in the mcclintock-lab organization and loaded on SeaSketch. In no case should 3rd party code be incorporated within SeaSketch without extensive testing and line-by-line audits.
We don't want our github org littered with duplicates of this README.md file.
scripts/reports.coffee contains an example that loads a single tab and single stylesheet. Stylesheets are loaded "globally", so it's up to the author to make sure all selectors are scoped to the appropriate tabs. The report.tabs method can register multiple tabs that should be associated with a SketchClass.
scripts/tab.coffee contains an example tab. It subclasses lib/reportTab (as should all reports) and as a simple demo has no geoprocessing dependencies.
Most report tabs will require the results of one or more geoprocessing service runs. To specify needed data, add key properties to the reportTab implementation like so:
class OverviewTab extends ReportTab
  name: 'Overview'
  dependencies: ['SizeStats']
  timeout: 15000
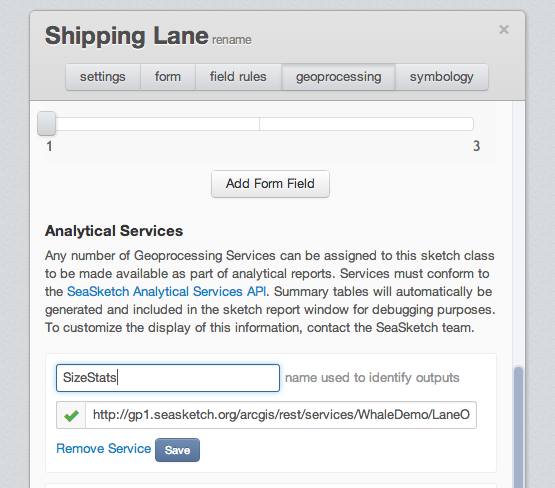
In this case the OverviewTab requires a geoprocessing service named SizeStats to be run, and will throw a timeout error after 15 seconds (the default is 10s). SizeStats refers to an "AnalyticalService" added to the SketchClass configuration via the admin interface. A named id is used rather than the url of the service so that geoprocessing services can be re-deployed to other locations without requiring code changes. Example of how a service can be configured in SeaSketch:
All data from these geoprocessing scripts will be available as an instance variable @results within the ReportTab implementation. ReportTab also has shortcut methods to get at some of this data more easily.
When running grunt watch it can act as a LiveReload server for stylesheets. With the LiveReload browser extension installed, changes to report css will update in the browser without requiring browser reloads.
D3 is a fantastic way to make interactive visualizations, and the only such library included in SeaSketch by default (via window.d3). It is not compatible with IE8. Develop visualizations for modern browsers and provide a table-based fallback for all others. The demo tab under script/tab.coffee and templates/demo.mustache has an example of how to use conditional statements in your html and test for the presence of d3 to alert the user when visualizations aren't available for their browser.
This example template provides a single report (dist/report.js), but there is no reason a single project cannot contain multiple client reporting modules to support many different SketchClasses. In fact, this is a great approach since there is likely code that can be shared among reports for different SketchClasses within a project. To do this, just add new report registering scripts similar to scripts/report.coffee and configure Gruntfile.coffee to generate each.
# you'll want to use more descriptive names...
# scripts/report2.coffee
InfoTab = require './infoTab.coffee'
HabitatTab = require './habitatTab.coffee'

window.app.registerReport (report) ->
  report.tabs [InfoTab, HabitatTab]
  report.stylesheets ['./report2.css']
# Gruntfile.coffee
...
  browserify:
    report:
      src: 'scripts/report.coffee'
      dest: 'dist/report.js'
    report2:
      src: 'scripts/report2.coffee'
      dest: 'dist/report2.js'
    options:
      transform: ['coffeeify']
      debug: true
      alias: [
        'node_modules/seasketch-reporting-api/scripts/reportTab.coffee:reportTab'
]If it's necessary to make changes to the base ReportTab or other library code within seasketch-reporting-api it will have to be committed to that repo. The easiest way to do this is to run npm install normally within your report project, then delete node_modules/seasketch-reporting-api. Within node_modules, then clone the seasketch-reporting-api project with r/w permissions, make changes and commit/push them up to the main repo. Make sure to tag new revisions using semantic versioning so that report modules can be tied to specific versions.
First thing you will need to do is create a new github repository to host the new project. Create a brand-new repo under the mcclintock-lab organization, and make sure you choose to create it bare (no auto-generated README or .gitignore).
If you have followed this README to here, the new reporting module is still attached to the seasketch-report-template repo, and you definitly should not push changes there. Remove the current git remote origin, add the new github repo as the target remote origin, and push all changes there.
git remote rm origin
git remote add origin [email protected]:mcclintock-lab/<NEW-REPO-NAME>.git
git push origin
Now that the client reporting code has a home, it needs to be hosted at a web accessible url so SeaSketch can load it. As a security precaution, SeaSketch can only be configured with reporting modules hosted via Github Pages under the mcclintock-lab organization. To start hosting new report code, run the following:
git checkout -b gh-pages
git push origin
Code should then be avialable at http://mcclintock-lab.github.io/<PROJECT-NAME>/dist/<REPORT-NAME>.js within 10 minutes. Be sure when developing code to make sure you are on the master branch, then merge and push to the gh-pages branch when you want to go live with changes.
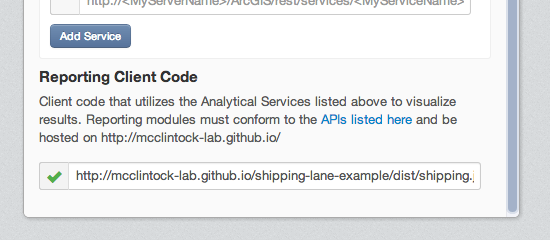
Within the SketchClass admin interface of the project of interest, choose a SketchClass and go to the geoprocessing tab. Make sure AnalyticalServices are configured that the reporting modules depends on. There is a text box where the path to the registration script hosted on Github Pages can be pasted in. After that, the new report code is live.


