Bug Report: #346
Description
Describe the bug
mpf.plot(data,type="candle") generates a line graph.
To Reproduce
Steps to reproduce the behavior:
create OHLC dataframe... something like this:
Date Close Open Volume High Low
2021-02-12 07:05:00 134.6100 134.68 11829 134.72 134.59
2021-02-12 07:10:00 134.5300 134.63 6182 134.63 134.50
2021-02-12 07:15:00 134.5900 134.55 7473 134.62 134.55
2021-02-12 07:20:00 134.6500 134.58 3938 134.65 134.57
2021-02-12 07:25:00 134.6600 134.66 3909 134.69 134.66
... ... ... ... ... ...
2021-02-26 19:35:00 121.8800 121.90 18794 121.90 121.80
2021-02-26 19:40:00 121.8000 121.88 23020 121.88 121.80
2021-02-26 19:45:00 121.8399 121.83 9625 121.85 121.76
2021-02-26 19:50:00 121.8300 121.81 9939 121.85 121.81
2021-02-26 19:55:00 121.7600 121.83 28145 121.86 121.69[1883 rows x 5 column
then try to create candle graph
mpf.plot(df,type="candle")
Expected behavior
something resembling a candle graph is made
Screenshots
If applicable, add screenshots to help explain your problem.
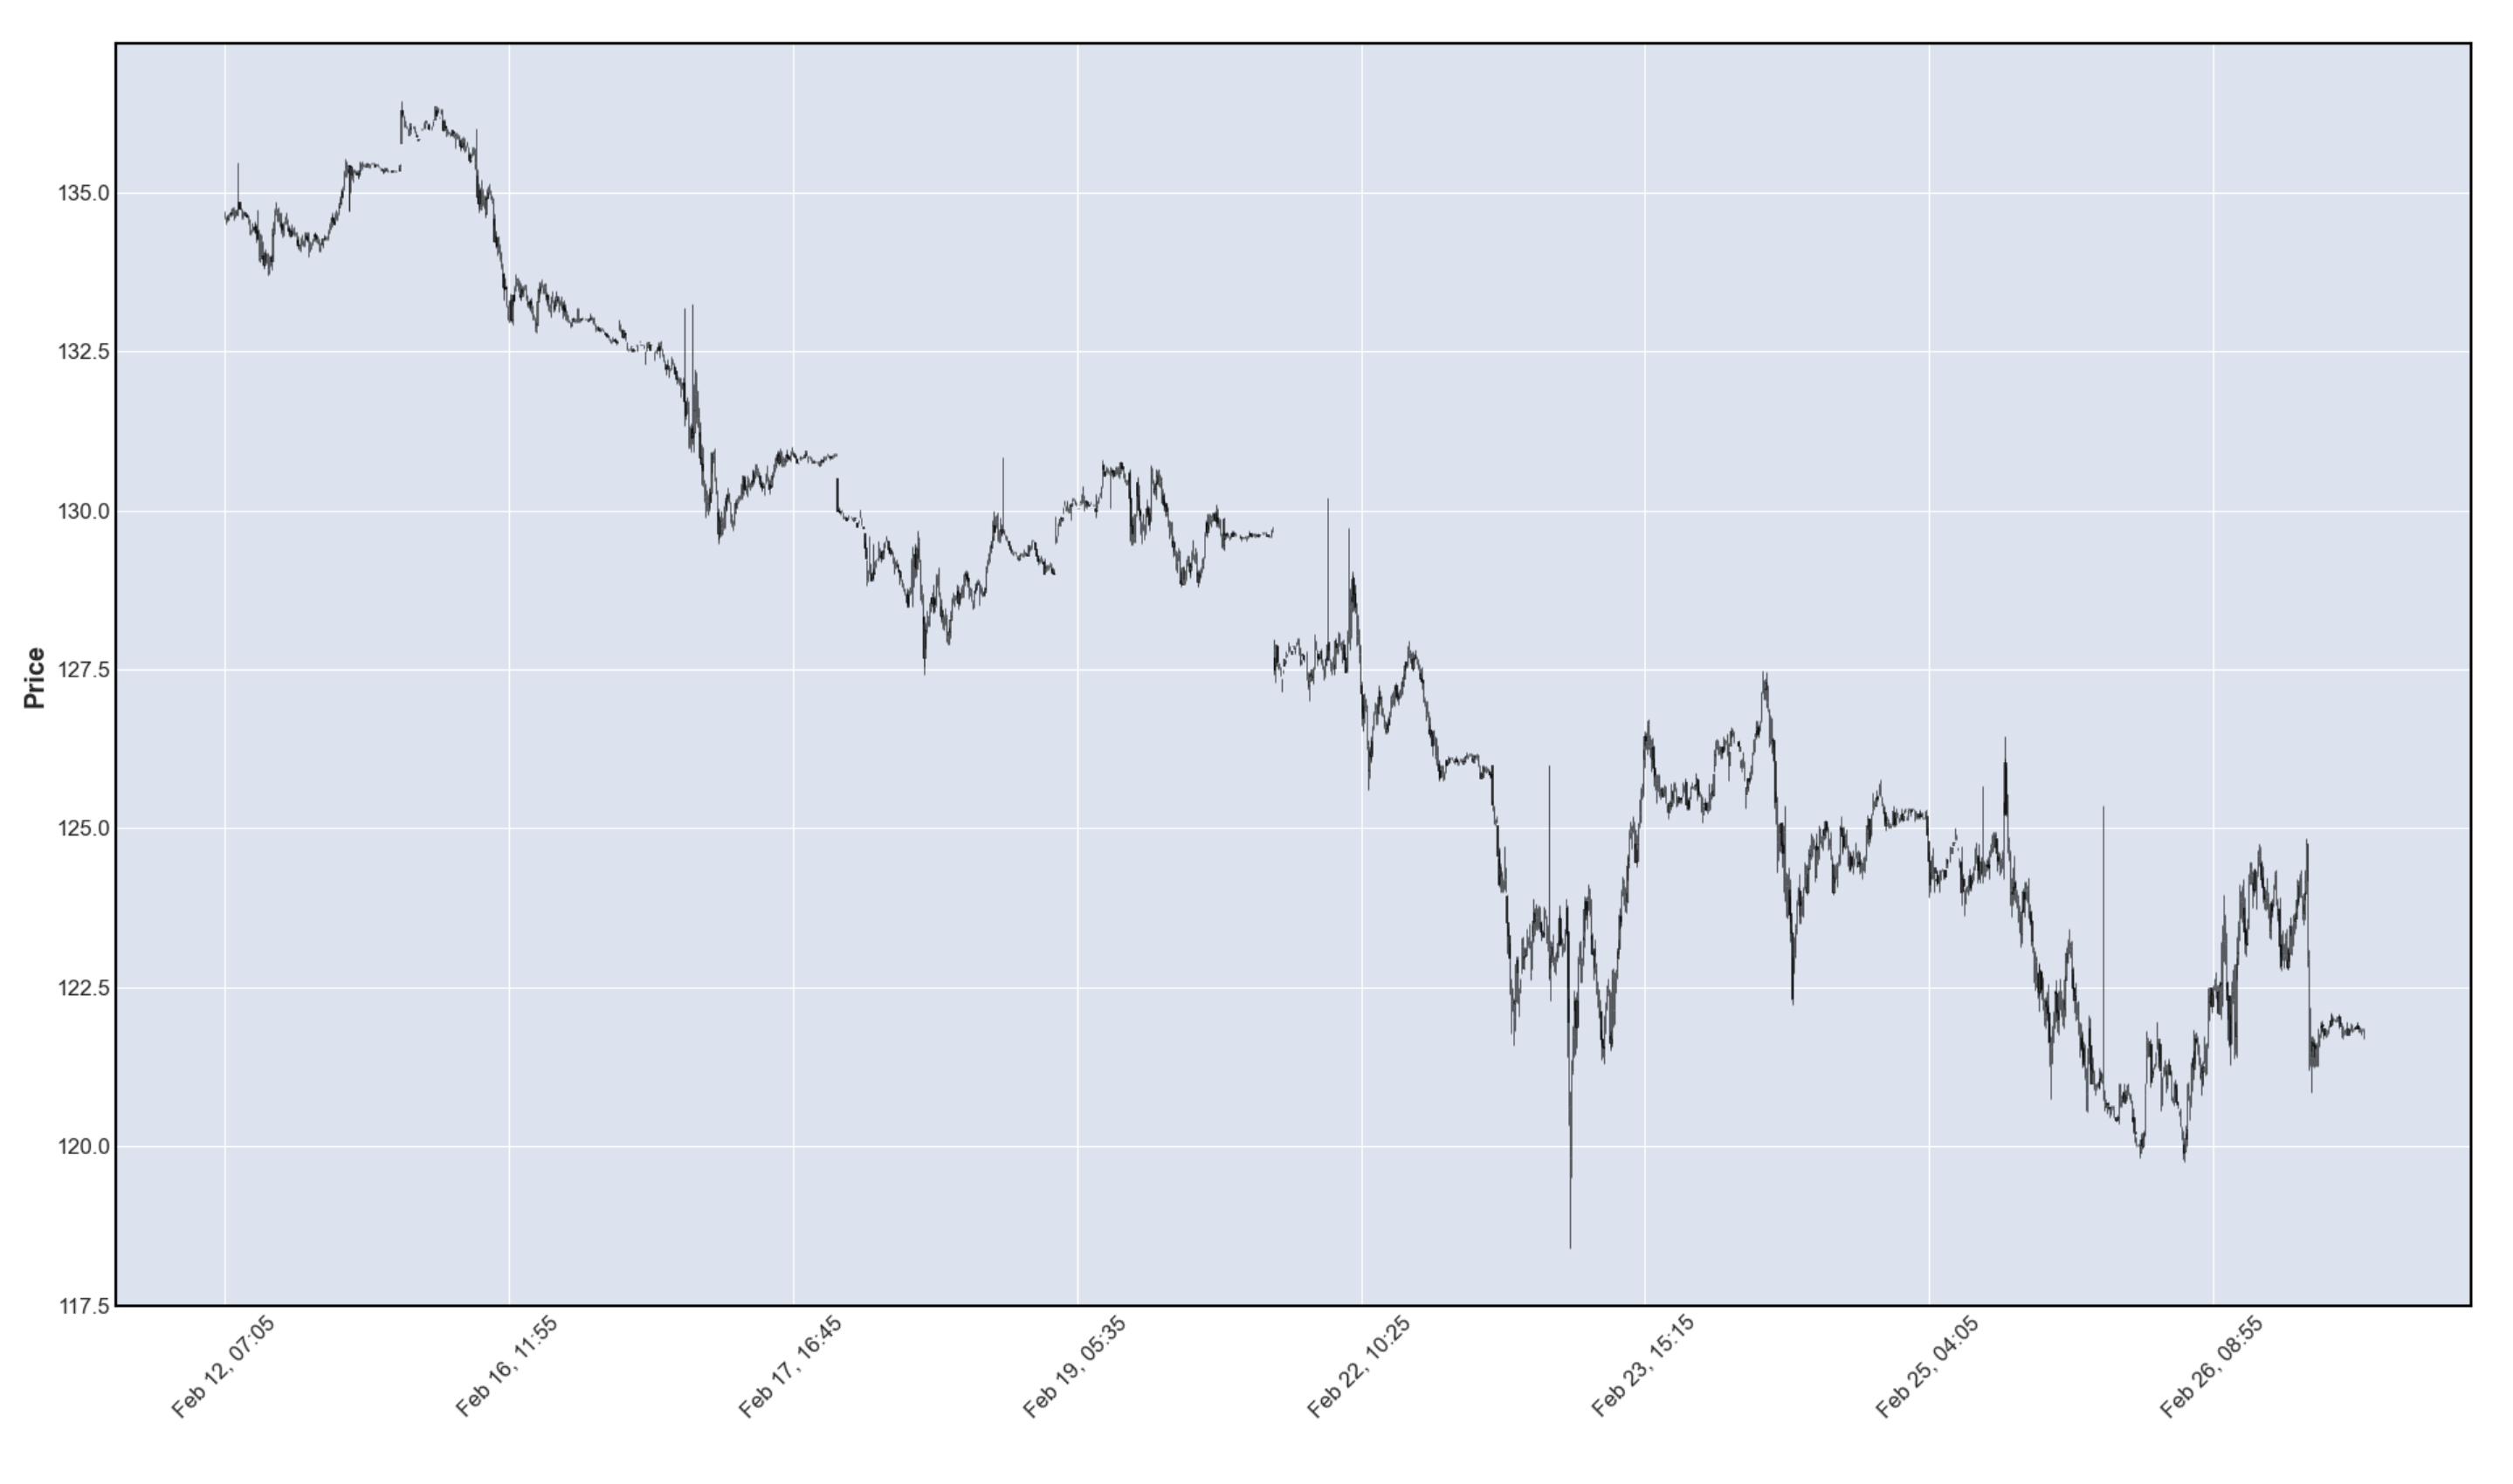
This is made. No errors of any kind
Desktop (please complete the following information):
- OS: Windows 10
- Version mplfinance~=0.12.7a7
- python3.8