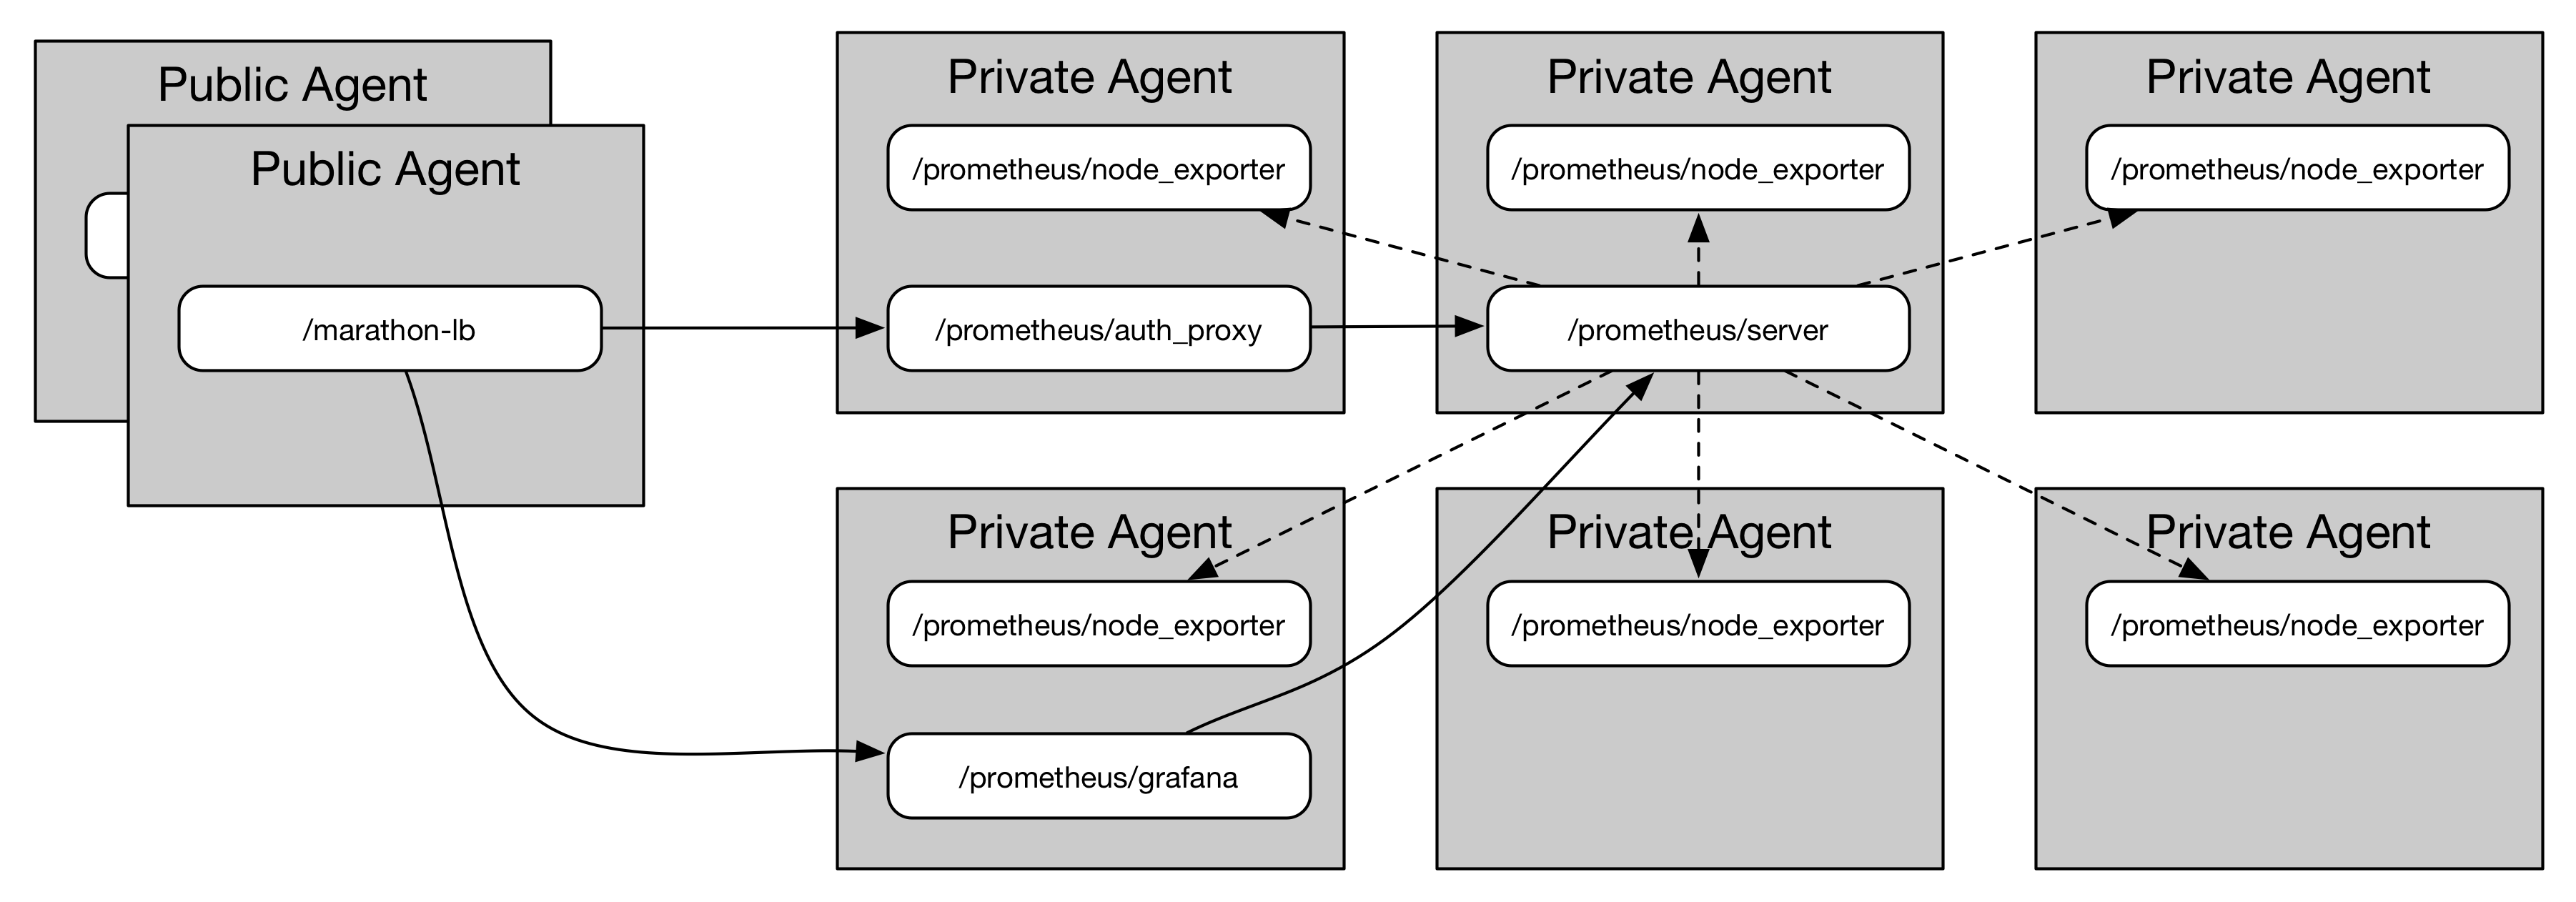
This runs Prometheus on DC/OS (1.8+). server.json contains the service definition for Prometheus itself. node_exporter.json contains the service definition for node_exporter. I'm running node_exporter inside a Mesos (cgroups) container so that it sees all of the hosts filesystems without any need for priviliges or translation.
To make life easier I also created a group.json that includes the Prometheus Server, Node Exporter, cAdvisor, Grafana Dashboard and an authentication proxy which will add Basic Auth to the Server's WebUI. The group assumes you're running Marathon-LB on your DC/OS and exports Marathon-LB labels.
To get started just install the group as shown below.
Install using
$ dcos marathon group add https://raw.githubusercontent.com/lloesche/prometheus-dcos/master/group.json
$ dcos marathon app update /prometheus/node-exporter instances=7000 # however many agents you have in your cluster
Important: Once the apps are deployed make sure to update all Environment Variables with something useful. Alternatively download group.json and modify them directly before deploying to DC/OS.
When working with the group.json you'll want to adjust the following variables and labels:
| App | Variable | Value |
|---|---|---|
/prometheus/server |
EXTERNAL_URI |
The complete URL your Prometheus Server will be reachable under (http(s)://...) |
/prometheus/server |
PAGERDUTY_HIGH_PRIORITY_KEY |
A PagerDuty API Key for High Priority Alerts |
/prometheus/server |
PAGERDUTY_LOW_PRIORITY_KEY |
A PagerDuty API Key for Low Priority Alerts |
/prometheus/server |
SMTP_FROM |
Sender Address Alert Emails are send from |
/prometheus/server |
SMTP_TO |
Recipient Address Alert Emails get send to |
/prometheus/server |
SMTP_SMARTHOST |
SMTP Server Alert Emails are send via |
/prometheus/server |
SMTP_LOGIN |
SMTP Server Login |
/prometheus/server |
SMTP_PASSWORD |
SMTP Server Password |
/prometheus/auth-proxy |
LOGIN |
Login Users have to provide when accessing Prometheus Server |
/prometheus/auth-proxy |
PASSWORD |
Password Users have to provide when accessing Prometheus Server (following this scheme) |
/prometheus/grafana |
GF_SERVER_ROOT_URL |
The complete URL Grafana will be reachable under |
/prometheus/grafana |
GF_SECURITY_ADMIN_USER |
Grafana Admin Login |
/prometheus/grafana |
GF_SECURITY_ADMIN_PASSWORD |
Grafana Admin Password |
| App | Label | Value |
|---|---|---|
/prometheus/auth-proxy |
HAPROXY_0_VHOST |
Hostname Prometheus Server should be reachable under. This is what's contained in EXTERNAL_URI |
/prometheus/grafana |
HAPROXY_0_VHOST |
Hostname Grafana should be reachable under. This is what's contained in GF_SERVER_ROOT_URL |
Prometheus supports DNS based service discovery. Given a Mesos-DNS SRV record like _node-exporter.prometheus._tcp.marathon.mesos it will find the list of node_exporter nodes and poll them. However it'll result in instance names like
node-exporter.prometheus-6ms1y-s1.marathon.mesos:14181
node-exporter.prometheus-54eio-s0.marathon.mesos:12227
node-exporter.prometheus-1e1ow-s2.marathon.mesos:31798
which is not very useful. Also the Mesos scheduler will assign a random port resource.
So after a discussion on the mailing list it turned out that Prometheus can't relabel the instance with the node's IP address since name resolution happens after relabeling. It was suggested to use the file_sd based discovery method instead. This is what the srv2file_sd helper is for. It performs the same SRV and A record lookup and instead of the hostname writes the node's IP addres into the targets file. There's also relabeling taking place to replace the random port number with the node_exporter standard port 9100 so that when a node_exporter is restarted on a different port it's data is still associated with the same node.
| Variable | Function | Example |
|---|---|---|
NODE_EXPORTER_SRV |
Mesos-DNS SRV record of the node_exporter | NODE_EXPORTER_SRV=_node-exporter.prometheus._tcp.marathon.mesos |
CADVISOR_SRV |
Mesos-DNS SRV record of cadvisor | CADVISOR_SRV=_cadvisor.prometheus._tcp.marathon.mesos |
SRV_REFRESH_INTERVAL (optional) |
How often should we update the targets JSON | SRV_REFRESH_INTERVAL=60 |
ALERTMANAGER_URL (optional) |
AlertManager URL - uses buildin AlertManager if not defined | ALERTMANAGER_URL=prometheusalertmanager.marathon.l4lb.thisdcos.directory:9093 |
ALERTMANAGER_SCHEME (optional) |
AlertManager Scheme - uses http if not defined | ALERTMANAGER_SCHEME=https |
PAGERDUTY_*_KEY (optional) |
Pagerduty API Key for Alertmanager. Name in * will be made into the severity | PAGERDUTY_HIGH_PRIORITY_KEY=93dsqkj23gfTD_nFbdwqk |
RULES (optional) |
prometheus.rules, replaces the version that ships with the container image | RULES=... Entire prometheus.rules file content |
EXTERNAL_URI (optional) |
External WebUI URL | EXTERNAL_URI=http://prometheusserver.marathon.l4lb.thisdcos.directory:9090 |
STORAGE_TSDB_RETENTION (optional) |
Storage TSDB Retention \ STORAGE_TSDB_RETENTION=7d |
|
SMTP_FROM |
How often should we update the targets JSON | [email protected] |
SMTP_TO |
How often should we update the targets JSON | [email protected] |
SMTP_SMARTHOST |
How often should we update the targets JSON | SMTP_SMARTHOST=mail.example.com |
SMTP_LOGIN |
How often should we update the targets JSON | SMTP_LOGIN=prometheus |
SMTP_PASSWORD |
How often should we update the targets JSON | SMTP_PASSWORD=23iuhf23few |
To produce the $RULES env variable it can be handy to use something like
$ cat prometheus.rules | sed -e ':a' -e 'N' -e '$!ba' -e 's/\n/\\n/g'
To run the srv2file_sd helper tool inside the minimal prom/prometheus Docker container I statically linked it. To do so yourself install musl libc and compile using:
$ CC=/usr/local/musl/bin/musl-gcc go build --ldflags '-linkmode external -extldflags "-static"' srv2file_sd.go
All this was hacked up in an afternoon. Surely there's bugs. If you find any submit a PR or open an issue.
- perform A lookups in parallel instead of looping over all hosts sequentially
