inspectIT Ocelot is a zero-configuration Java agent for dynamically collecting application performance, tracing and behavior data based on the OpenTelemetry SDK for Tracing and OpenCensus library for Metrics-Export. Despite the zero-configuration capability, it provides a powerful configuration feature which enables a full and in-depth customization of all features. In order to use inspectIT Ocelot, the source code of the target application does not have to be touched, changed or modified - even access to the actual source code is not required. It automatically injects all required components and executes the necessary actions by itself.
Compared to the former inspectIT, Ocelot follows the approach of focusing on compatibility and interaction with other awesome open source tools. For this purpose the agent includes data exporters for tools and frameworks like Prometheus, Zipkin or Jaeger. This allows us to use and interact with well-known and established tools like Elasticsearch, InfluxDB or Grafana, reducing the amount of components which have to be introduced into an existing infrastructure or which need to be familiarized with.
The inspectIT Ocelot Java agent collects a lot of different data, namely metrics and traces. You can fully customize the metrics and traces you want to collect via the configuration. With respect to our zero-configuration goal, the agent already ships with a default configuration capturing useful data for you.
For example, the following system and JVM metrics are captured by default:
- CPU (usage and number of cores)
- Disk Space (used, free and total)
- Memory (used and available for various regions like heap or non-heap)
- Threads (counts and states)
- Garbage Collection (pause times and collection statistics)
- Class Loading (loaded and unloaded counts)
In addition, the response times for sent and received HTTP requests are collected and tagged with relevant information such as the response code or the HTTP method.
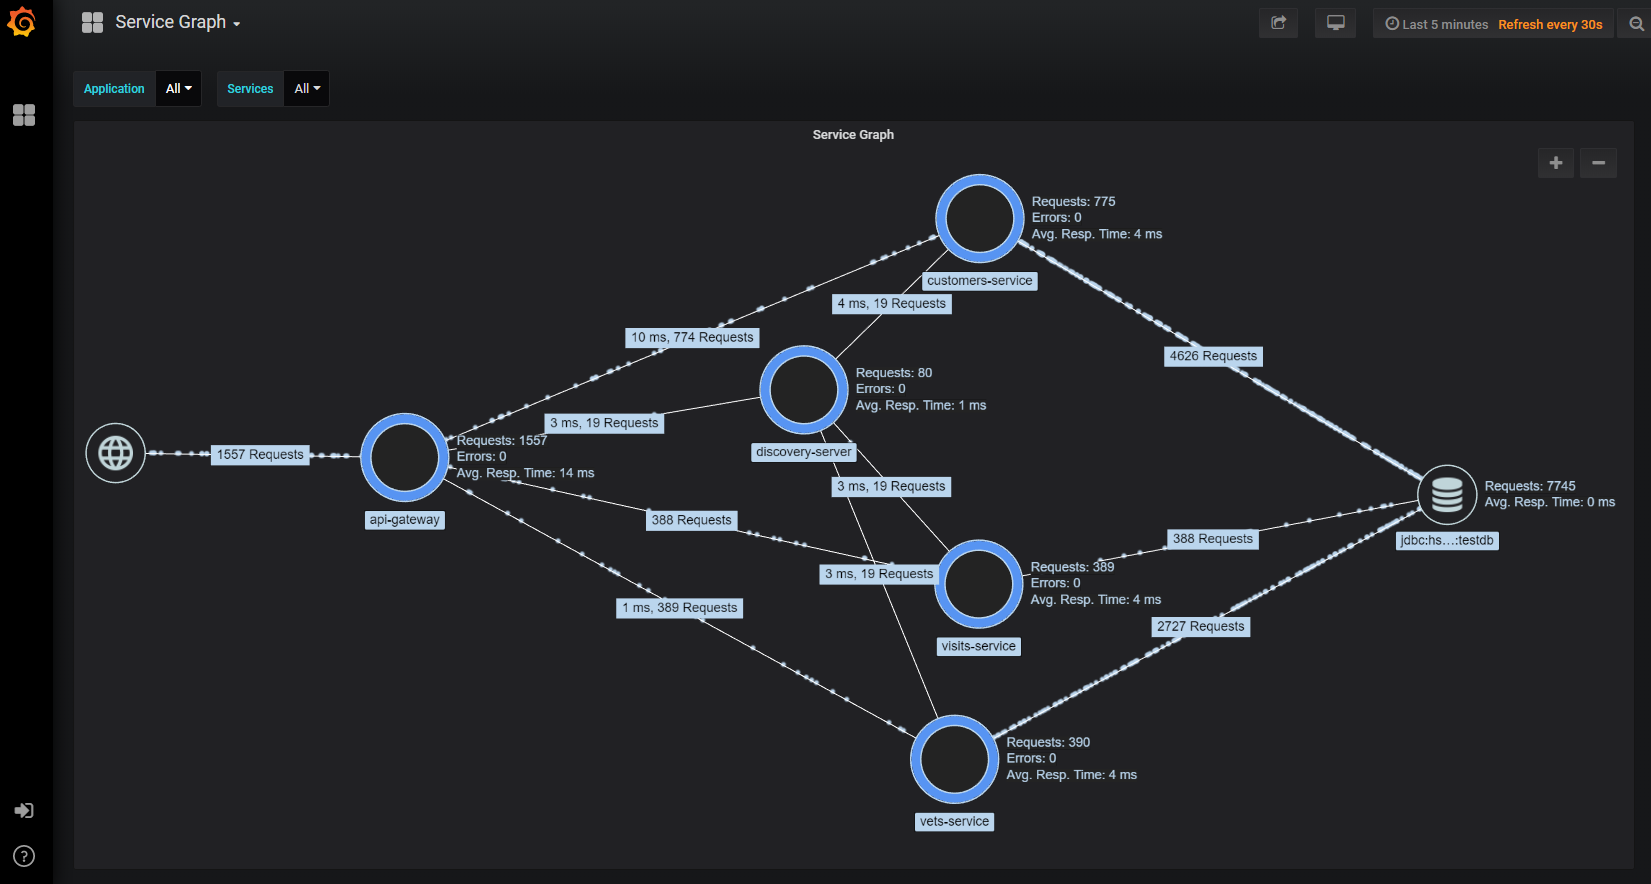
Ocelot also collects response times and invocation counts for remote calls between your services. Hereby, it is automatically detected whether the call was made to an internal or external service. The resulting metric can then then be visualized for example using the Grafana Service Graph Panel:
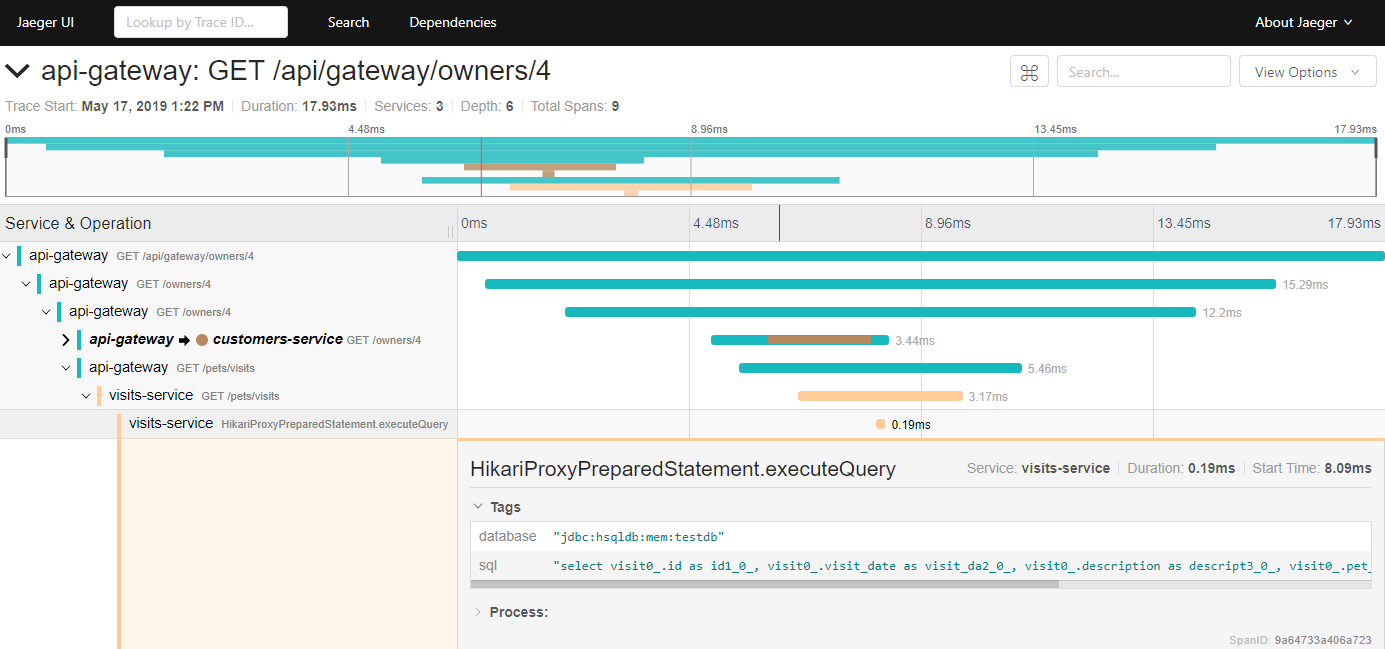
In addition, the agent provides out-of-the-box support for tracing, even across JVM borders. You can easily record your traces and enrich them with metadata extracted from your application at runtime:
Checkout the documentation to find out how you can extract custom metrics and traces.
You want to see the inspectIT Ocelot Java agent in action? No problem! We've prepared a nice containerized demo to show what the agent is capable of. The demo consists of two different scenarios, whereby we would like to emphasize the flexibility of the agent and therefore each scenario uses a different set of tools.
All you have to do is to download the demo archive and start it with docker-compose:
$ docker-compose -f docker-compose-prometheus-jaeger.yml up$ docker-compose -f docker-compose-influxdb-jaeger.yml up$ docker-compose -f docker-compose-influxdb-zipkin.yml up
Check out the documentation's demo section for detailed information on each scenario.
Getting started with the inspectIT Ocelot Java agent is very easy!
First of all, you have to download the Java agent. You can find all released versions in the release section of this repository: https://github.com/inspectIT/inspectit-ocelot/releases
The easiest way to use the inspectIT Ocelot Java agent is to attach it to your Java application during startup.
This can be achieved using the -javaagent command-line option of your JVM and referencing the agent Jar:
$ java -javaagent:"/path/to/inspectit-ocelot-agent.jar" -jar my-java-program.jar
We also support attaching the inspectIT Ocelot Java agent to an already running JVM. In such a scenario the collection of metrics and traces will start from the point of the attachment. Please read the documentation how this can be achieved.
The inspectIT Ocelot Java agent offers a comprehensive configuration capability which allows you to customize all properties to your own needs. In addition, the agent also supports hot reloading for its configuration which makes it possible to modify individual configuration settings during runtime without having to restart the application, which is usually the case.
The configuration hot reloading feature also allows you to start the agent in a kind of "standby state" with deactivated features and activate these at a later point in time.
Currently, the configuration values can be set using environment variables, system properties or configuration files. This allows you to pass configuration values to the agents by, for example, using Puppet to set specific properties or using Ansible to roll out updated configuration files which then will be hot reloaded.
For detailed information about the configuration see the related section of the documentation.
A detailed user documentation can be found at: http://docs.inspectit.rocks/
You need a documentation of an earlier version? No problem! All the released documentation can be found here.
If you cannot wait for the next stable release and want to use an agent based on the current master branch, the corresponding documentation can be found here.
If you want to contribute anything to this project, feel free to open a pull request or reach out to us! A good starting point is the CONTRIBUTING.md.
If you need additional or in-depth information on the actual implementation of inspectIT Ocelot, check out the README files in the child projects of this repository.
Important tasks to check first are dependencyUpdates or dependencyUpdates[Major|Minor] for newer (patch, minor, major)
versions, the outdated task for node modules and dependencyCheckAnalyze or dependencyCheckAggregate for security issues in the used dependencies (including node modules).
All dependency versions are maintained in one catalog file. The task versionCatalogUpdate[ConfigServerLibs] --interactive creates a copy of the catalog file with all version
updates. This file can also be edited manually and be applied with versionCatalogApplyUpdates[ConfigServerLibs].
It's like "inspect it" and not like IT in information technology. /ɪnˈspektɪt/ :)
No. The Java agent is developed against Java 8, thus, the application which you want to attach the agent to have to be using a JVM running on Java 8 or higher.
No. The agent is compatible to and can be used with any kind of JVM (Oracle JVM, an OpenJDK, an IBM JVM, ...), as long as it supports the javaagent argument and provides Java 8 or higher.
Yes, you can use the inspectIT Ocelot Java agent if you already use the OpenCensus library. However, there are a few points that need to be considered to ensure a smooth operation. Please read the corresponding section in the documentation.
We have a detailed section in the documentation about this topic.
The easiest way is to add the javaagent argument to your Java command like described above.
In this case, check your Java command and ensure that you have not accidentally removed your application.
You'll most likely have a command like java -javaagent:inspectit-ocelot-agent.jar or java -javaagent:inspectit-ocelot-agent.jar -version.
Starting Java without an application but the agent will work but does not make sense because the agent will initialize itself and then the JVM will properly shut down because it has no application to execute.
It's like executing just java.
inspectIT Ocelot is mainly driven by Novatec Consulting GmbH, a German consultancy firm that specializes in software performance.


