Workflows used for QC of WGS or WES data
This WDL pipeline implements QC in human whole-genome or exome/targeted sequencing data.
As part of the AnVIL Data Processing Working Group, a Quality Control (QC) workflow was developed to harmonize and summarize the QC for all WGS and WES sequence data sets ingested and released on the AnVIL from the Centers for Common Disease Genomics. The QC workflows are a starting point or reference for any data submission to the AnVIL.
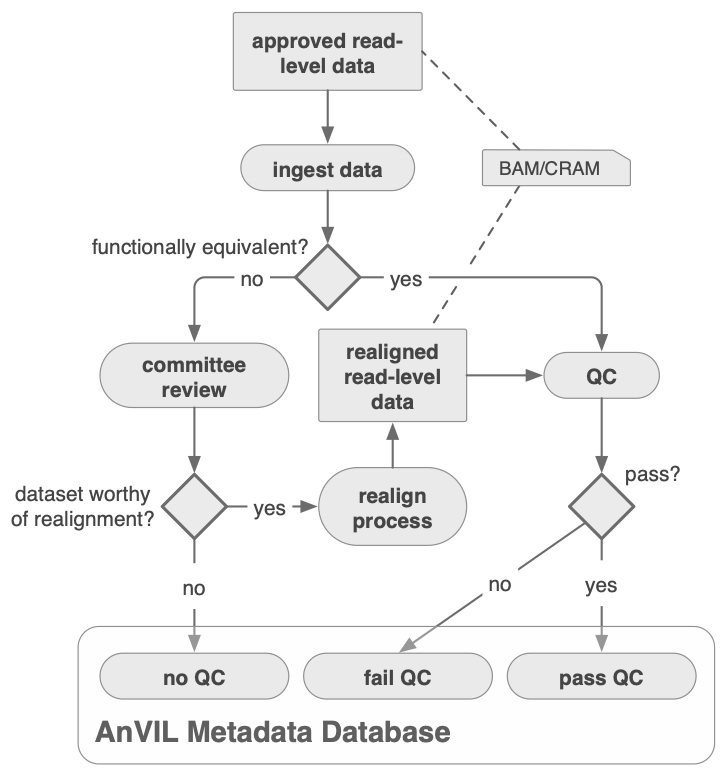
The figure below shows the read-level data processing and ingestion process, including decisions regarding reprocessing when data is determined to be incompatible with the Functional Equivalence standard defined in this Nature Communications publication.
WDL Analysis Reseach Pipelines, from the Broad Institute Data Sciences Platform and collaborators, provides an AnVIL Whole Genome Analysis Pipeline Example Workspace to demonstrate a Functional Equivalence pipeline and Joint Genotyping for WGS data. For additional details on Functional Equivalence including a DRAGEN FE comparison, please see the Broad Functional Equivalence workspace.
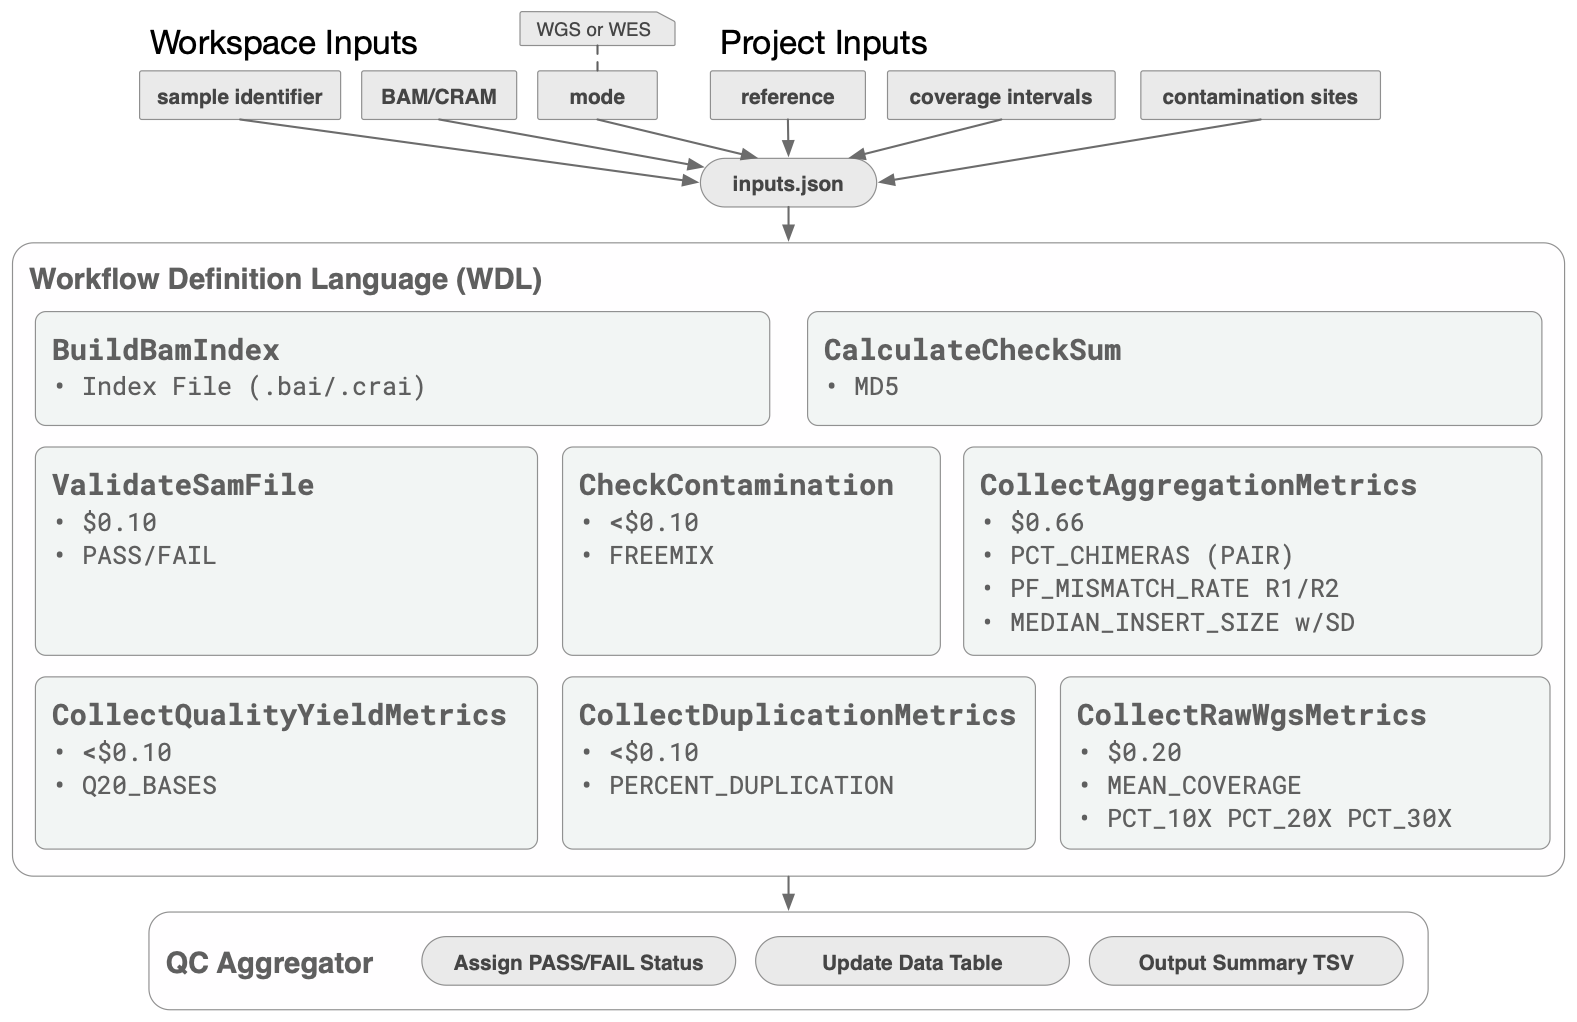
The following figure shows the steps of the workflow with approximate costs of executing each step in a cloud-hosted environment.
- Human paired-end sequencing data in aligned BAM or CRAM format
- Input BAM/CRAM files must additionally comply with the following requirements:
-
- files must pass validation by ValidateSamFile
-
- reads are provided in query-sorted order
-
- all reads must have an RG tag
- Reference genome must be Hg38 with ALT contigs
- Coverage regions, either WGS or exome/targeted, must be in a compatible interval_list format
There is a separate page for details about workflow outputs.
- Picard 2.21.7
- samtools 1.3.1 using htslib 1.3.1
- VerifyBamID2
- Python 2.7 and 3
- Cromwell version support
- Successfully tested on v48
- Does not work on versions < v23 due to output syntax
For sex estimation from WGS data, methods Ry (https://doi.org/10.1016/j.jas.2013.07.004) and Rx (https://doi.org/10.1371/journal.pone.0163019) were compared against 1kg data. The Ry method required adjustment of the default cutoffs on the 1kg data suggesting the type of sequence data, sample source/quality, coverage levels, and/or other experimental factors may impact the estimation of sex. The Rx method required no adjustments to the default cutoffs of 0.6 and 0.8. For a more detailed comparison of Rx and Ry methods, please see: https://doi.org/10.1038/s41598-020-68550-w For the Rx method, original R code is available: https://doi.org/10.1371/journal.pone.0163019.s003
- The provided JSON is meant to be a ready to use example JSON template of the workflow. It is the user’s responsibility to correctly set the reference and resource input variables using the GATK Tool and Tutorial Documentations.
- Relevant reference and resources bundles can be accessed in Resource Bundle.
- Runtime parameters are optimized for Broad's Google Cloud Platform implementation.
- For help running workflows on the Google Cloud Platform or locally please view the following tutorial (How to) Execute Workflows from the gatk-workflows Git Organization.
- The following material is provided by the GATK Team. Please post any questions or concerns to one of these forum sites : GATK , FireCloud or Terra , WDL/Cromwell.
- Please visit the User Guide site for further documentation on GATK workflows and tools.
Copyright Broad Institute, 2019 | BSD-3 This script is released under the WDL open source code license (BSD-3) (full license text at https://github.com/openwdl/wdl/blob/master/LICENSE). Note however that the programs it calls may be subject to different licenses. Users are responsible for checking that they are authorized to run all programs before running this script.
After submission, you will evaluate genomic data (ex. BAMs or CRAMS) for basic sequence yield and quality control (QC) metrics. These metrics ensure depth and breadth of coverage requirements are met for all data ingested into AnVIL.
AnVIL Data Processing Working Group has created a genomic evaluation tool for whole genome data (a whole exome QC tool is in development). You will collect quality control metrics for genome and exome sequencing data by running the tool - a workflow written in Workflow Description Language - in a sandbox workspace.
The WDL includes multiple software packages (Picard, VerifyBamID2, Samtools flagstat, bamUtil stats ) organized in a single, efficient tool that is compatible with AnVIL.
The current QC pass/fail status is based on three metrics: coverage, freemix, and sample contamination. QC metrics can be made available in the AnVIL workspace to aid users in sample selection.
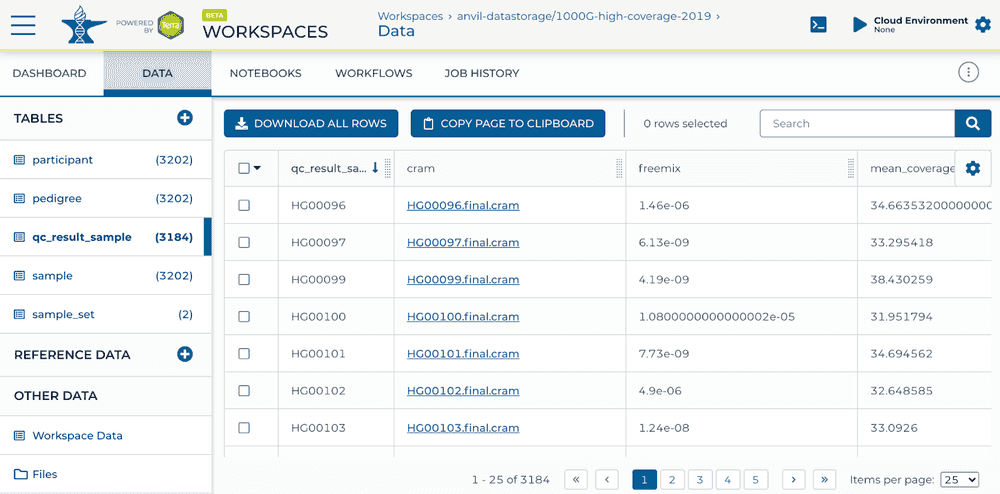
Below is an example output, generated by the workflow in a qc_results_sample data table.
| Metric Name | Metric Description | Pass threshold | Purpose | Source Tool |
|---|---|---|---|---|
| qc_results_sample_id | Sample ID | NA | Identify sample | NA |
| cram | Cram google path | NA | Locate file | NA |
| FREEMIX | FREEMIX | < 0.01 | Sample contamination | VerifyBamID2 |
| MEAN_COVERAGE | Haploid Coverage | ≥ 30 | Coverage depth | Picard CollectWgs Metrics |
| MEDIAN_ABSOLUTE_DEVIATION | Library insert size mad | NA | Batch characteristics | Picard CollectInsertSize Metrics |
| MEDIAN_INSERT_SIZE | Library insert size median | NA | Batch characteristics | Picard CollectInsertSize Metrics |
| PCT_10X | % coverage at 10X | > 0.95 | Coverage breadth | Picard CollectWgs Metrics |
| PCT_20X | % coverage at 20X | > 0.90 | Coverage breadth | Picard CollectWgs Metrics |
| PCT_30X | % coverage at 30X | NA | Additional metadata | Picard CollectWgs Metrics |
| PCT_CHIMERAS (PAIR) | % Chimeras | < 0.05 | Variant detection | Picard CollectAlignmentSummary Metrics |
| Percent_duplication | % duplication | NA | NA | NA |
| Q20_BASES | Total bases with Q20 or higher | ≥ 86x109 | Sequence quality | Picard CollectQualityYield Metrics |
| qc_status | Reported status at the sample level | Pass/Fail/No QC | Overall quality assessment | NA |
| read1_pf_mismatch_rate | Read1 base mismatch rate | < 0.05 | Sequence quality | Picard Collect Alignment Summary Metrics |
| read2_pf_mismatch_rate | Read2 base mismatch rate | < 0.05 | Sequence quality | Picard Collect Alignment Summary Metrics |
See also the aforementioned listing of all possible workflow outputs.
- Select QC status criteria
Data submitters should establish the specific metrics and thresholds for determining the pass/fail criteria on their dataset. This repo contains some example threshold files that can be used when running this workflow. There is a complete list of possible threshold metrics here.
- Run QC Processing
Data Submitters are responsible for running the WDL on their data to generate the QC metrics. If this workflow is given a threshold file, then it can report QC status outputs directly to the AnVIL data table as additional columns. AnVIL Data Processing Working Group has also created QC aggregator Jupyter notebook. Once QC status criteria have been determined, the thresholds can be modified in the notebook. The criteria is used to assign QC status of pass or fail. If a sample fails multiple times, it is assigned No QC under QC status.
There is a text walkthrough for WGS processing on AnVIL that uses the NA12878 data listed in the example JSON for WGS.
Sample QC Results Table
There is an additional example JSON for exome. It should have all the inputs necessary to run aside from the input BAM, sample name, and threshold file. After supplying those inputs, the workflow can be run just as in the WGS case and outputs can simiarly be written to the data table.
Video - Walkthrough of WGS QC Processing
 If the current version of the example JSON is used as in this video, the chosen threshold file should be uploaded to the workspace files and the
 gs:// path should be filled in as an input instead of pointing to the https:// URL in this repo. Thereafter, the outputs tab of the workflow can be used to assign which results from the workflow should be added as columns to the data table. See also the Terra dcoumentation on writing workflow outputs to the data table.
Video - How to combine data across workspaces also includes an example of running the QC workflow.