Client: Calaveras Sync Improvements + Working Branch#1310
Conversation
Codecov Report
Flags with carried forward coverage won't be shown. Click here to find out more. |

|
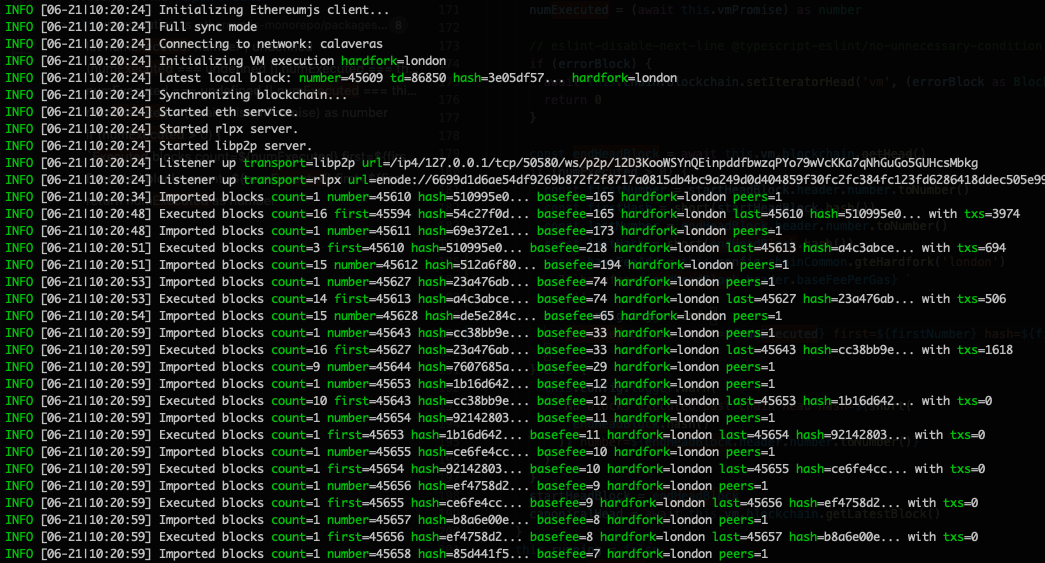
This should also be helpful and give some more orientation and feeling for the network behavior: outputting the base fee during sync along
|
f770293 to
db72a6d
Compare
|
Yeah! 🎉 This db72a6d actually fixes the maxPerRequest issue and sync is now working with the normal 50 block requests set 😄, we can keep the The block fetcher didn't allow for result sets lower than the requested number before and on Calaveras sync a cut happened on the result set in the first spam-blocks-range (2000-2200 or so) due to the large block sizes (as happened on Baikal before). The fix now allows for results with a lower lengths to be processed (a zero length is still not allowed though to prevent circular requests) and then re-calcuates the first block numbers of the outstanding jobs in the request queue. This should make the client sync generally more resilient for these kind of situations. |
db72a6d to
2a00695
Compare
|
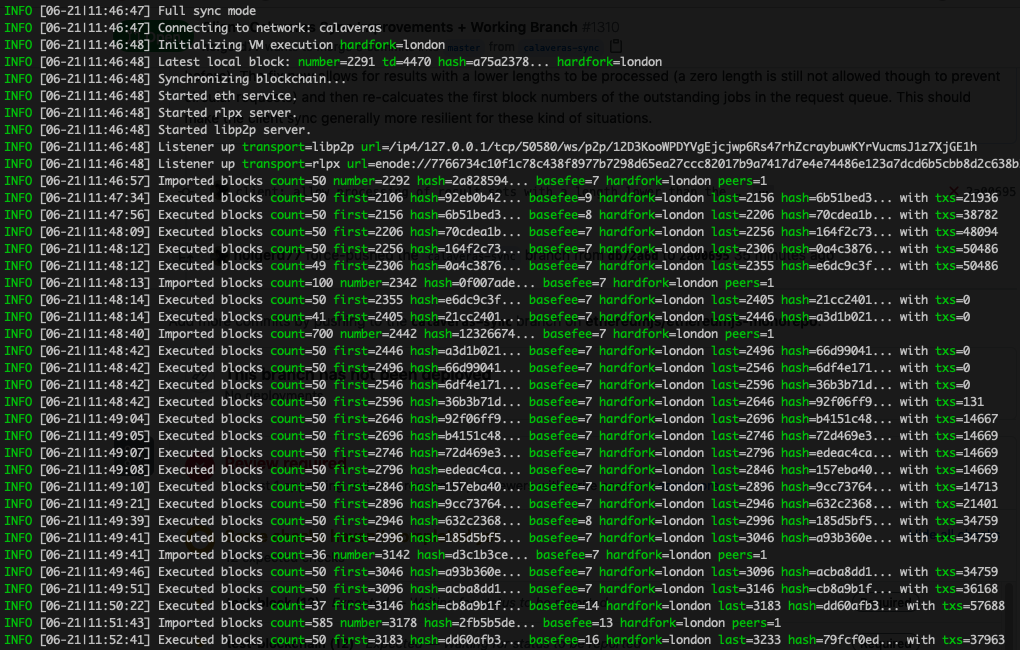
Ah, also wanted to post this screenshot along:
Sync is incredibly slow along these blocks. But at the end, these are also an awful lot of transactions. Might nevertheless be a good test bed to have a look for some bootlenecks (I guess these are all simple value transfer txs to the same account. I did some tests here with this permanent cache (surviving checkpointing) for MPT idea (//cc @gabrocheleau) but this had not really an effect here (which makes sense since there is just not much state touched with this). |
|
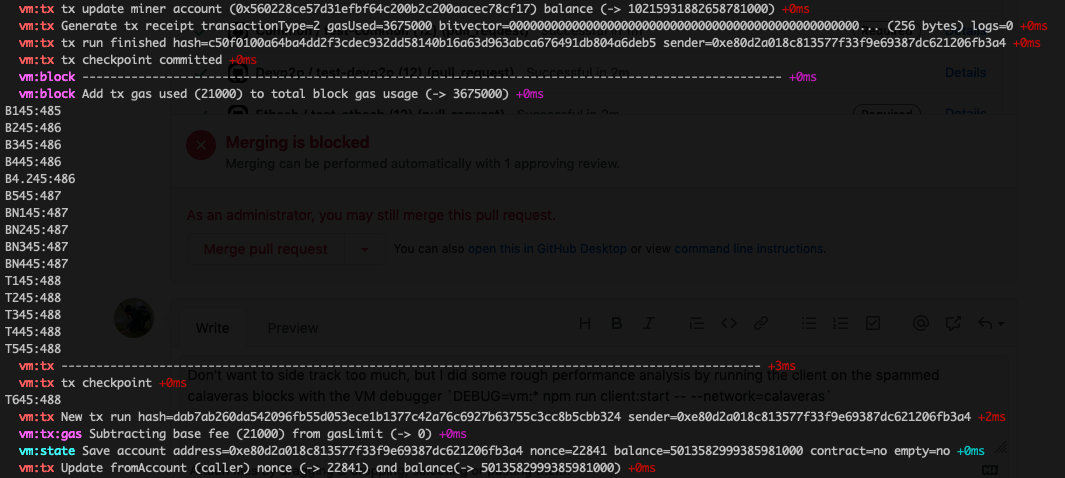
Don't want to side track too much, but I did some rough performance analysis by running the client on the spammed calaveras blocks with the VM debugger Here is a picture of some associated debug output where I then added some console.log() statements outputting time diffs for closer analysis.
This is the associated code in VM // Add to total block gas usage
gasUsed = gasUsed.add(txRes.gasUsed)
if (this.DEBUG) {
debug(`Add tx gas used (${txRes.gasUsed}) to total block gas usage (-> ${gasUsed})`)
}
console.log(`B1${(new Date()).getSeconds()}:${(new Date()).getMilliseconds()}`)
// Combine blooms via bitwise OR
bloom.or(txRes.bloom)
console.log(`B2${(new Date()).getSeconds()}:${(new Date()).getMilliseconds()}`)
// Add receipt to trie to later calculate receipt root
receipts.push(txRes.receipt)
console.log(`B3${(new Date()).getSeconds()}:${(new Date()).getMilliseconds()}`)
const encodedReceipt = encodeReceipt(tx, txRes.receipt)
console.log(`B4${(new Date()).getSeconds()}:${(new Date()).getMilliseconds()}`)
const encoded = encode(txIdx)
console.log(`B4.2${(new Date()).getSeconds()}:${(new Date()).getMilliseconds()}`)
await receiptTrie.put(encoded, encodedReceipt)
console.log(`B5${(new Date()).getSeconds()}:${(new Date()).getMilliseconds()}`)The large time diff is happening between I find this pretty interesting. On the one hand it is the So too things which might be drawn from this short experiment:
|
|
(side note: I have no idea why this stupid client integration test is failing 🙁) |
|
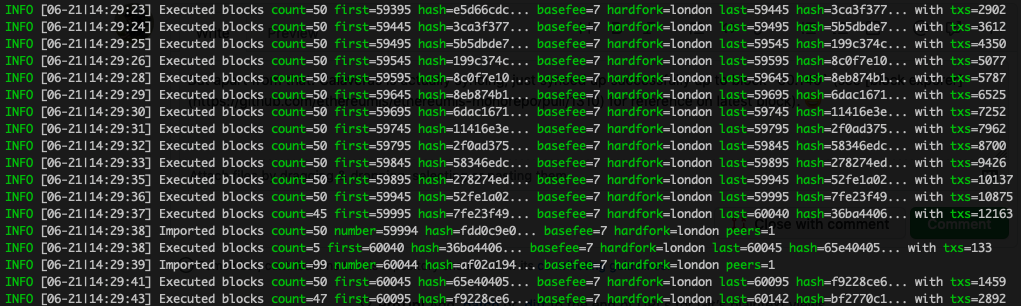
But apart from that: Calaveras is actually syncing, just synced up successfully up to block
|
|
Still not sure about the test failure though, this is happening between commit 3b8d315 and 2a00695, if someone wants to give it a try run: git checkout 3b8d315
npx tape -r ts-node/register test/integration/fullsync.spec.tsShould work. git checkout 2a00695
npx tape -r ts-node/register test/integration/fullsync.spec.tsShould fail. Really strange though, if I didn't miss something the extra |
I might be missing something but doesn't your screenshot show: Doesn't that show only :001 ms elapsed between them? |
|
Ok this failing integration test was definitely an interesting and tricky one. So it sets up two peers, one with 9 blocks and one with 10 blocks, and wants to ensure that it syncs all 10 blocks. In the code prior to this PR, it would reject the 9 block result since it requested 10. This is actually not really how we would have wanted the test to behave, so I'm happy we have some new and improved code here. The test fails because it receives the 'synchronized' result with 9 blocks first and fails expecting 10. I updated the integration test to wait to listen for a possible next event and check that the length is correct. I also cleaned up some of the Will rebase on master. |
…ith BlockFetcherBase version)
…requested job count in BlockFetcher and HeaderFetcher
Yes, I guess that's the time diff range we are operating in here. That's 1 ms and if you do the math that means for a single block with 1000 txs this makes a difference of 1s (or half a second if we would let's say double the performance). That's not nothing respectively substantial, if we catch 3-4 of such somewhat smaller bottlenecks and could improve here that would already mean a performance increase of some seconds per block. Correct me if I got something wrong here? 🤔 Thanks a lot for digging into this test issue, really grateful here 🙂 🌻, I guess I would likely not have found this myself. I also have the impression that these test code parts produced problems before occasionally, so would be great if we now have a structural improvement here which prevents this on future test runs. Since you commented on all the changes I've done and Calaveras is actually syncing successfully I guess I will just take this as an informal review and then just merge here. There are not really outstanding tasks and one benefit of this might be - if someone finds the time - that it would be a good occasion to test and improve on the on-tip-of-the-chain behavior from #1132 as long as Calaveras is still up and running. 😄 |
Related: #1306
Working branch to sync with the Calaveras network, also coming with some calaveras related improvements (feel free to directly push on this branch or in doubt make a PR towards the branch if you have got things to add).
First thing I added here is an official
maxPerRequestCLI option, then we don't always have to monkey-patch if running with a50maxPerRequest setting doesn't work but can just runnpm run client:start -- --network=calaveras --maxPerRequest=1.The option should be generally useful (so: not just a monkey-patch-ease option 🙂) since it will be likely useful for peopel to play a bit with this, this will likely allow to get to somewhat higher download rates if adjusted due to the specific network and ones own internet connection speed and things like that.