[lens] Datatable visualization and visualization switcher#39218
Closed
wylieconlon wants to merge 5 commits intoelastic:feature/lensfrom
Closed
[lens] Datatable visualization and visualization switcher#39218wylieconlon wants to merge 5 commits intoelastic:feature/lensfrom
wylieconlon wants to merge 5 commits intoelastic:feature/lensfrom
Conversation
Contributor
💔 Build Failed |
Contributor
|
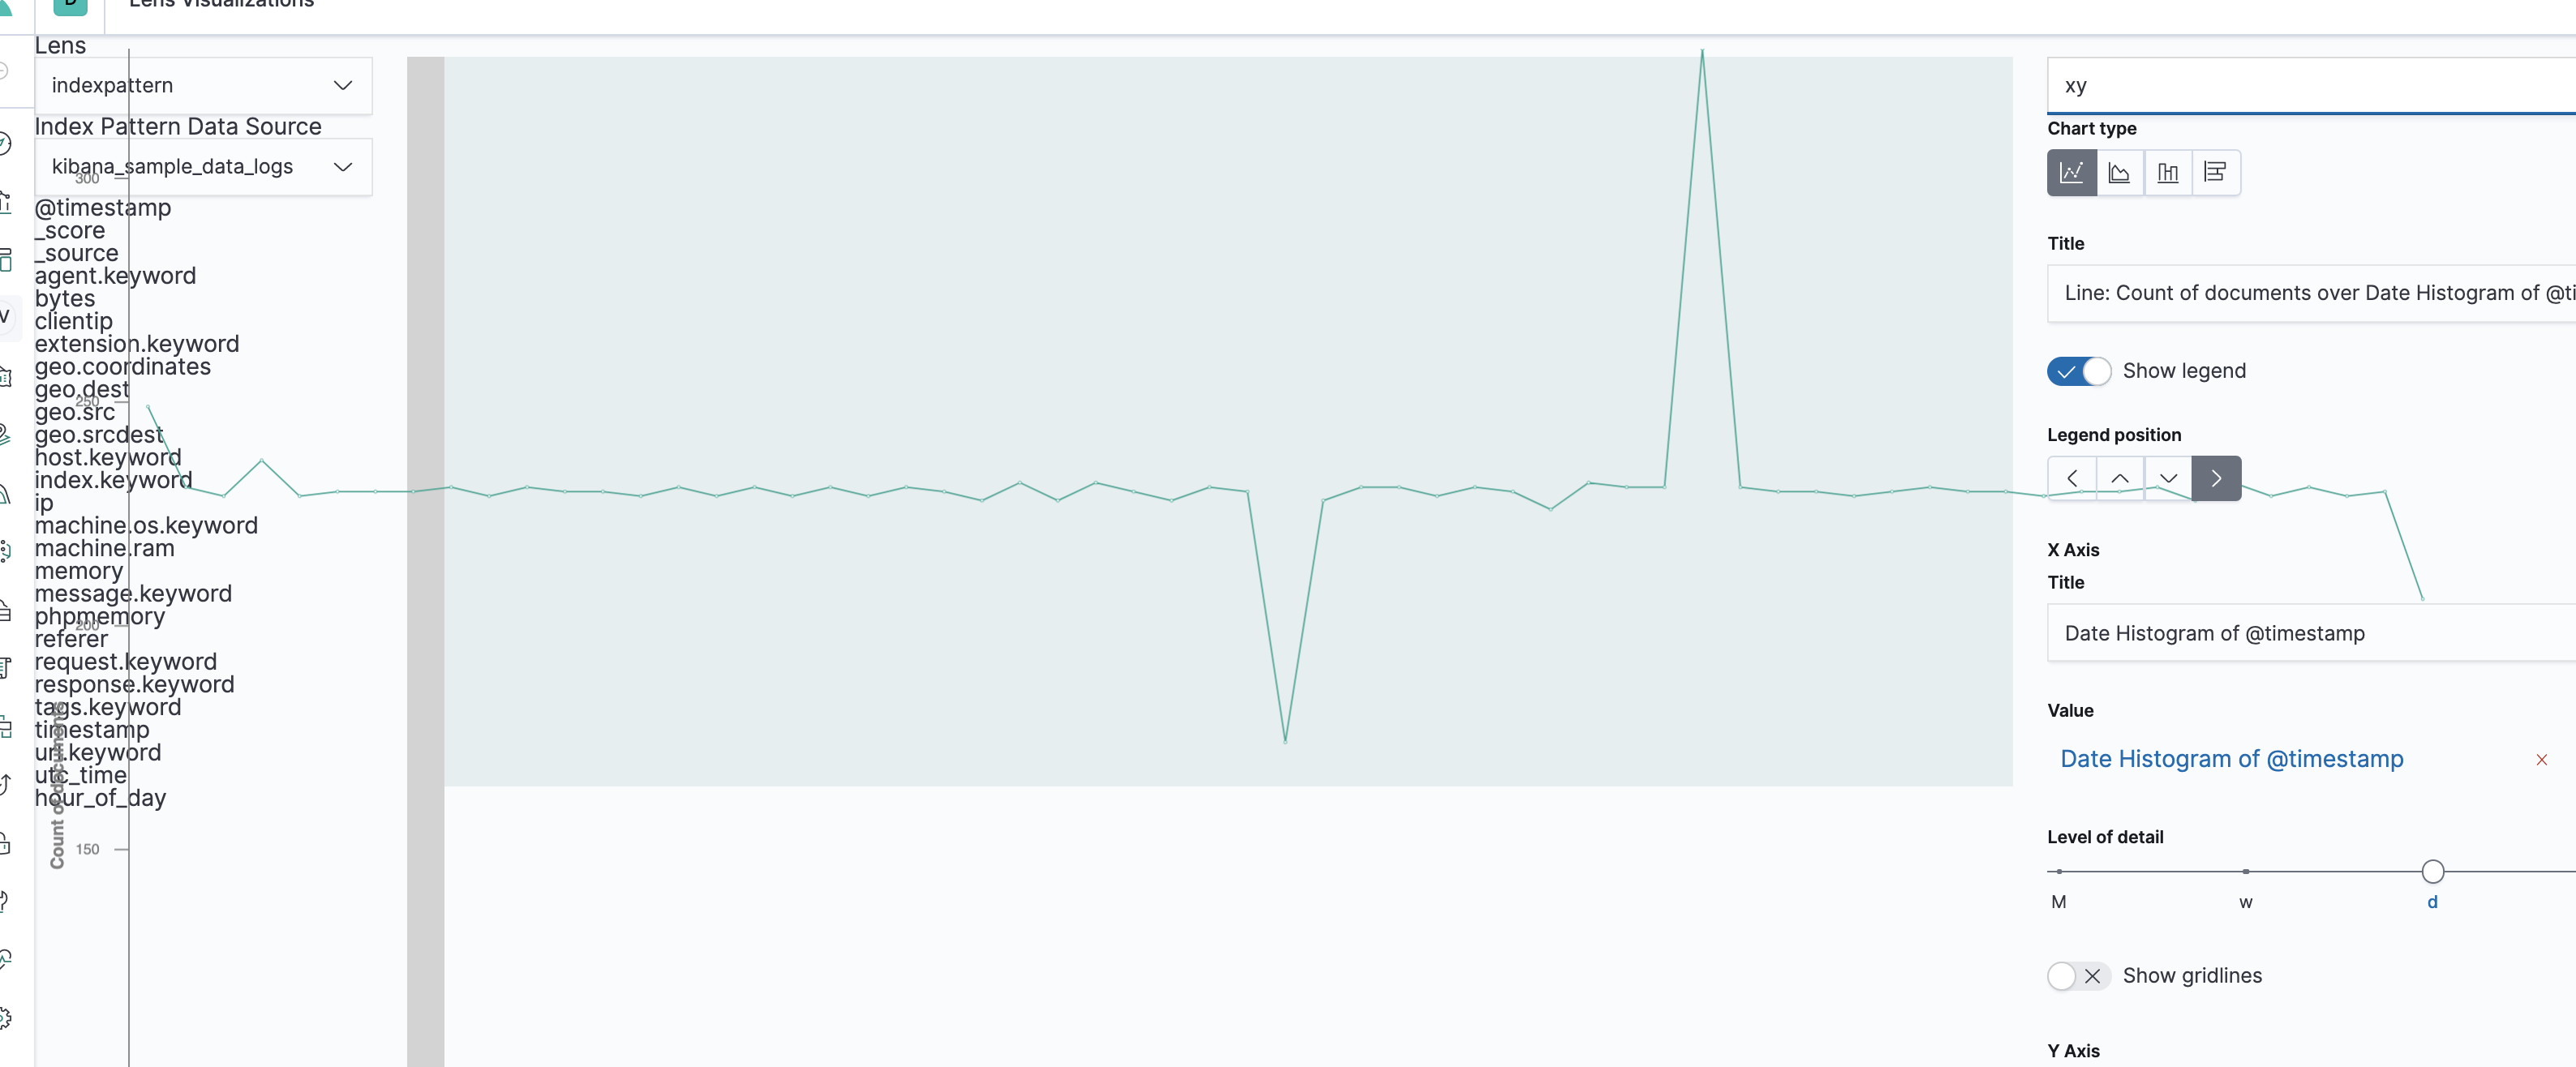
You've probably already seen this, but the xy chart layouting has some problems EDIT: This also happens on feature/lens, investigating... |
flash1293
reviewed
Jun 19, 2019
x-pack/plugins/lens/public/datatable_visualization_plugin/expression.tsx
Show resolved
Hide resolved
Contributor
Author
|
I'm probably going to split up this PR into two or three smaller PRs that should be reviewable in sequence. |
Contributor
💔 Build Failed |
This file contains hidden or bidirectional Unicode text that may be interpreted or compiled differently than what appears below. To review, open the file in an editor that reveals hidden Unicode characters.
Learn more about bidirectional Unicode characters
Sign up for free
to join this conversation on GitHub.
Already have an account?
Sign in to comment
3 participants
Add this suggestion to a batch that can be applied as a single commit.This suggestion is invalid because no changes were made to the code.Suggestions cannot be applied while the pull request is closed.Suggestions cannot be applied while viewing a subset of changes.Only one suggestion per line can be applied in a batch.Add this suggestion to a batch that can be applied as a single commit.Applying suggestions on deleted lines is not supported.You must change the existing code in this line in order to create a valid suggestion.Outdated suggestions cannot be applied.This suggestion has been applied or marked resolved.Suggestions cannot be applied from pending reviews.Suggestions cannot be applied on multi-line comments.Suggestions cannot be applied while the pull request is queued to merge.Suggestion cannot be applied right now. Please check back later.
Summary
This PR is currently doing two things that are somewhat related, but could be split, so this is a draft for now.
The two things are:
Related to the chart switching behavior is also generating better suggestions for alternative queries to run.
Summarize your PR. If it involves visual changes include a screenshot or gif.
Checklist
Use
strikethroughsto remove checklist items you don't feel are applicable to this PR.For maintainers