[Infrastructure UI] Filter out null bucket items from average calculation#152333
Conversation
d450c85 to
61a3dd9
Compare
| value: null, | ||
| max: 0.47105555555555556, | ||
| avg: 0.0672936507936508, | ||
| avg: 0.47105555555555556, |
There was a problem hiding this comment.
This is what the query returns:
[{ timestamp: 1562786355035, metric_0: null },
{ timestamp: 1562786415035, metric_0: null },
{ timestamp: 1562786475035, metric_0: null },
{ timestamp: 1562786535035, metric_0: null },
{ timestamp: 1562786595035, metric_0: null },
{ timestamp: 1562786655035, metric_0: 0.47105555555555556 },
{ timestamp: 1562786715035, metric_0: null }]
So, if we're filtering out null values from the average calculation, it makes sense for the expected result to be 0.47105555555555556
|
Pinging @elastic/infra-monitoring-ui (Team:Infra Monitoring UI) |
|
|
||
| const calculateAvg = (rows: MetricsAPIRow[]): number => { | ||
| return sum(rows.map(getMetricValue)) / rows.length || 0; | ||
| const values = rows.map(getMetricValue).filter(Boolean); |
There was a problem hiding this comment.
doubt: not sure if this scenario is possible, but in case the metric value is 0, this will be filtered out and wrongly compute as the expected value.
For example
[0, 0, 9] // expected (0 + 0 + 9) / 3 === 3 ✅
but with the current .filter(Boolean) it would result in
[0, 0, 9].filter(Boolean) // expected 9 / 1 === 9 ❌
It may be safer to only filter out only non-numeric values
[0, 0, 9].filter(isFinite)
There was a problem hiding this comment.
This is absolutely correct. Thanks for catching it.
[null,0, 0, 9].filter(Number.isFinite) -> [0,0,9]
 tonyghiani
left a comment
tonyghiani
left a comment
There was a problem hiding this comment.
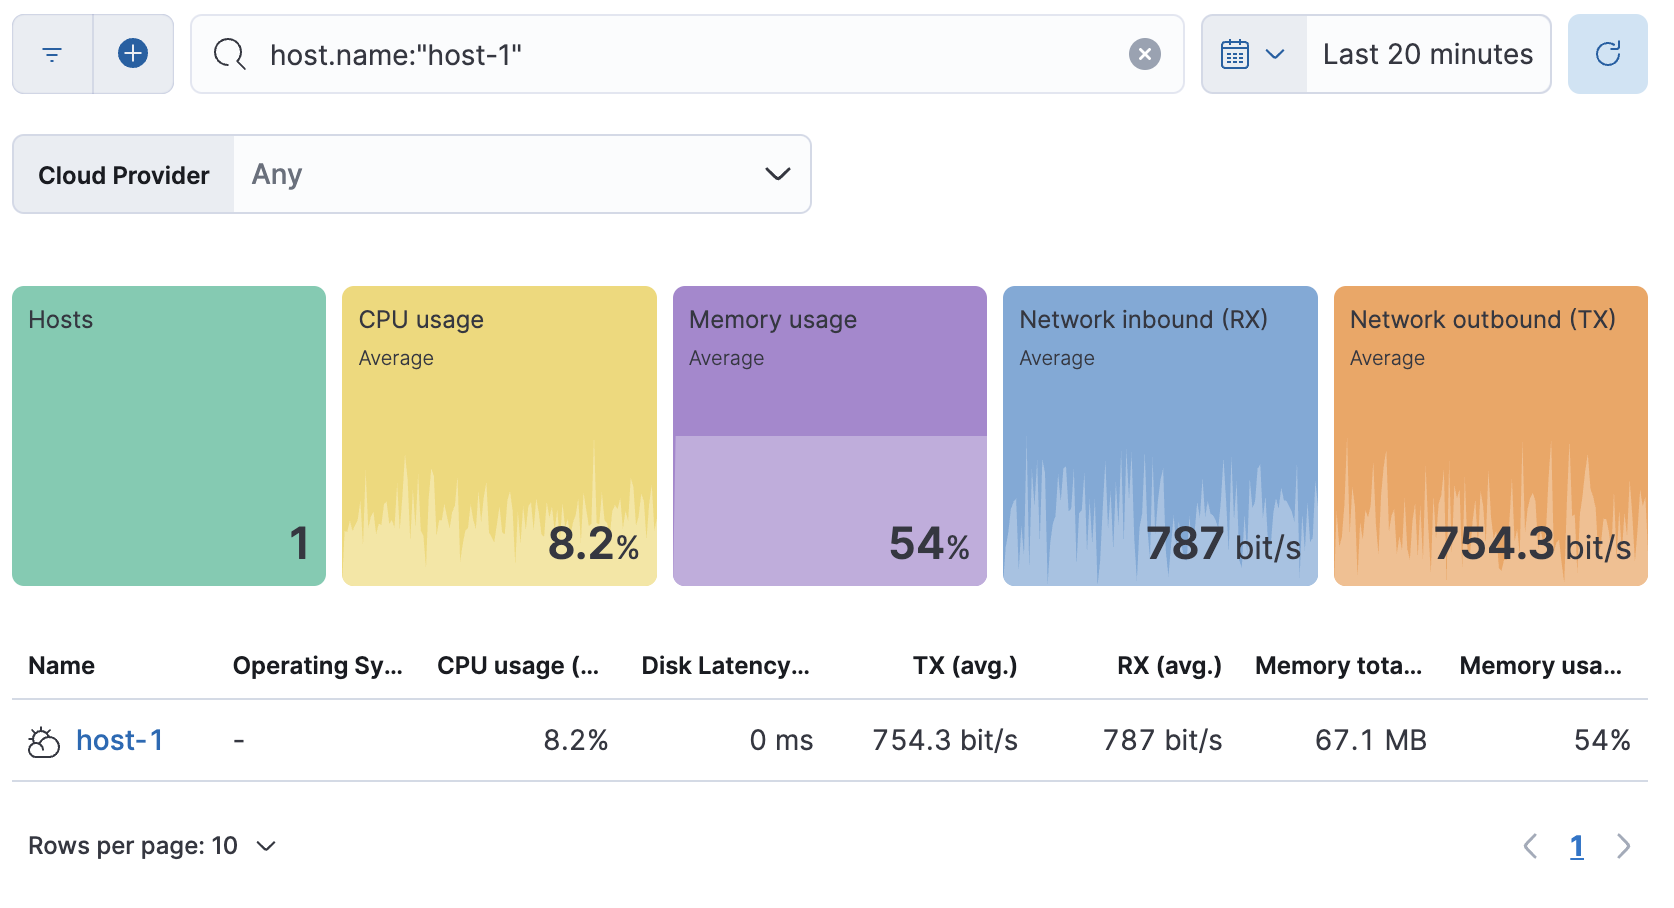
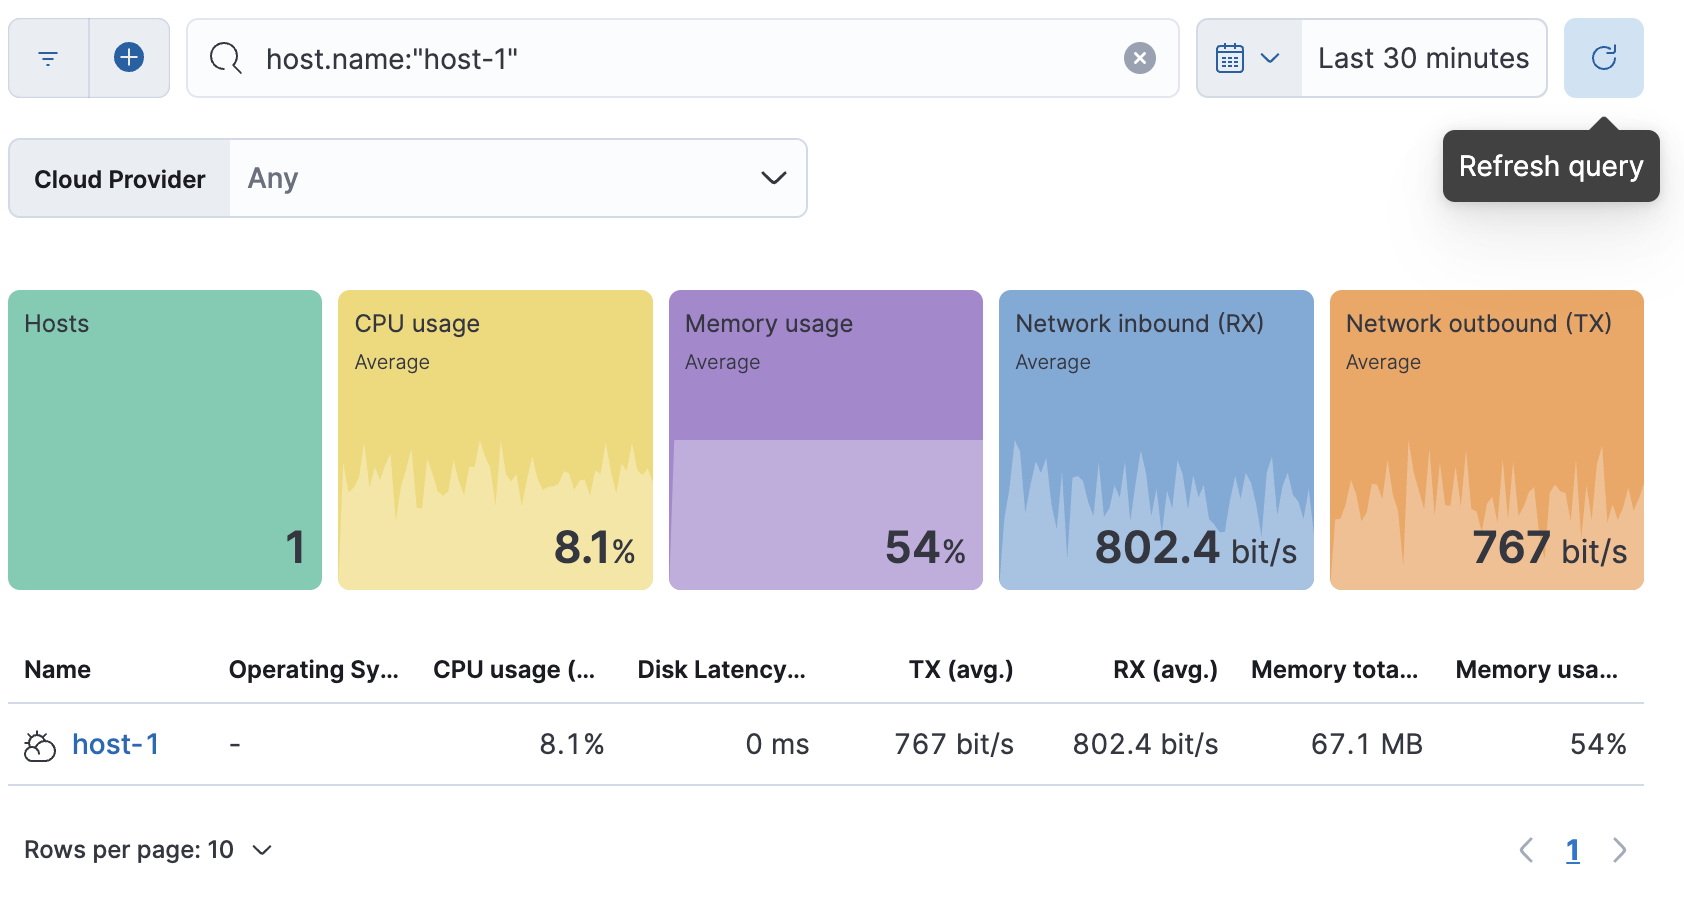
I'm not sure why, but it looks like the values between the KPI tiles and the table are still mismatching on different time-range selections, here are some examples:
| Time range | Screenshot | Avg RX matches? | Avg TX matches? |
|---|---|---|---|
| Last 5 mins | 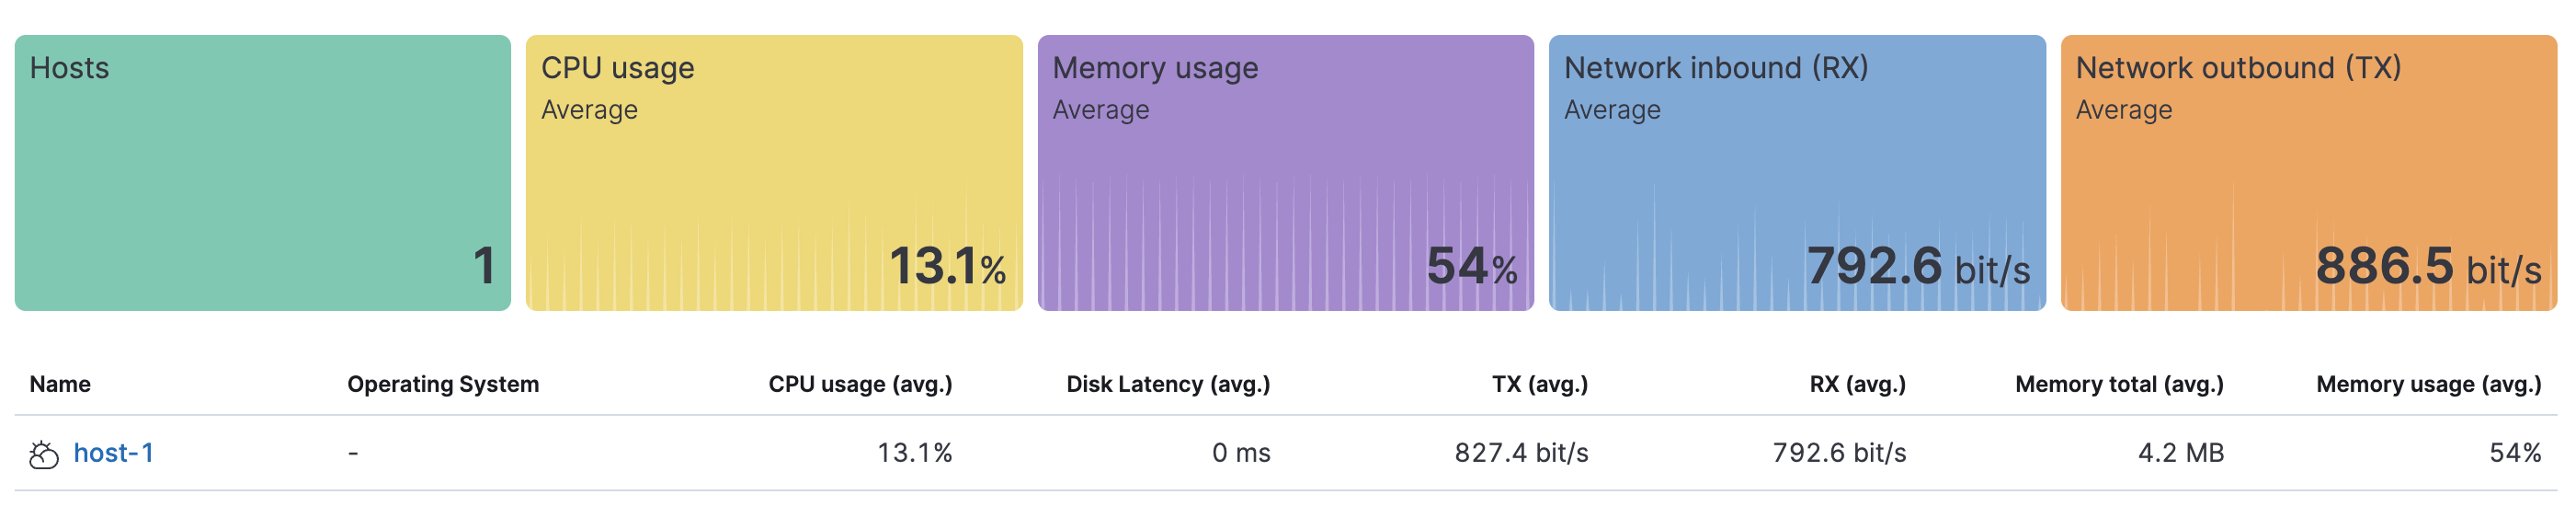 |
✅ | ❌ |
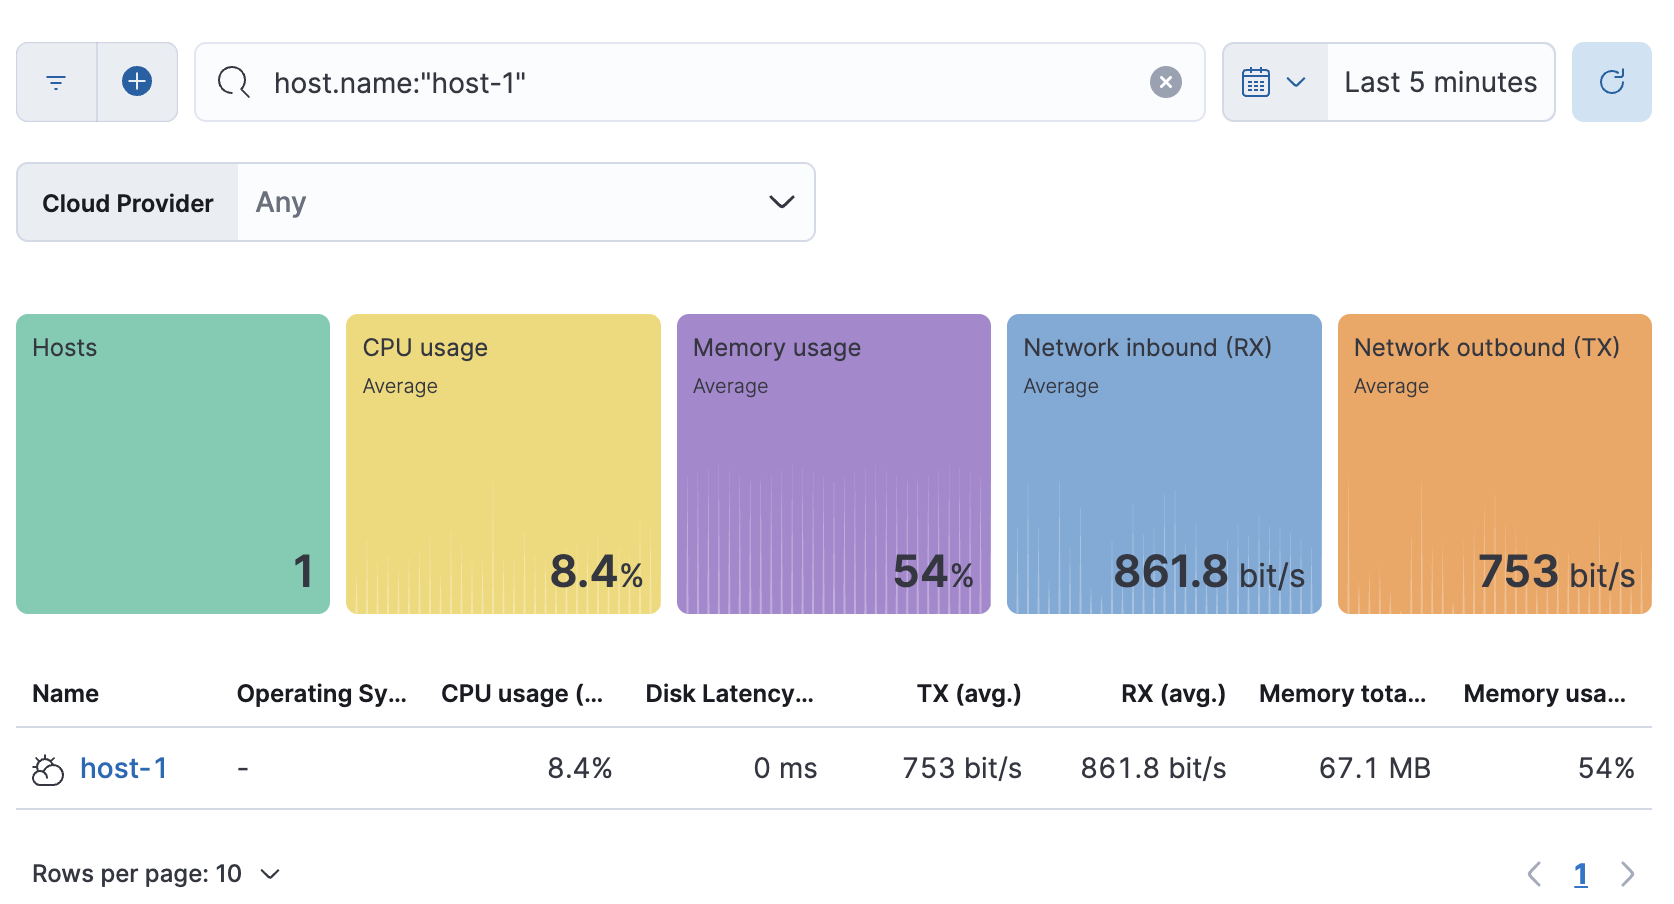
| Last 10 mins | 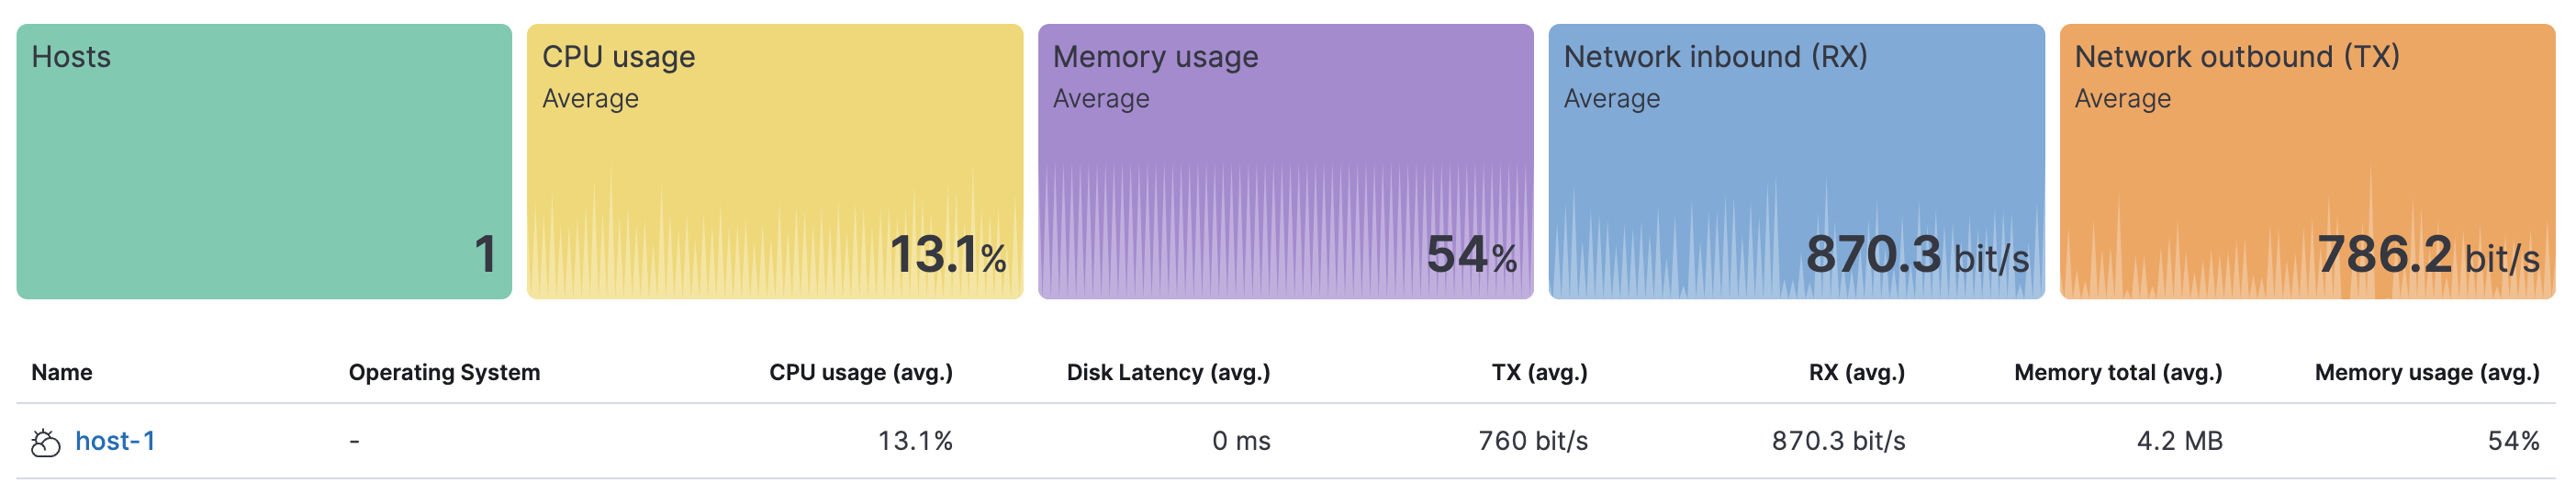 |
✅ | ❌ |
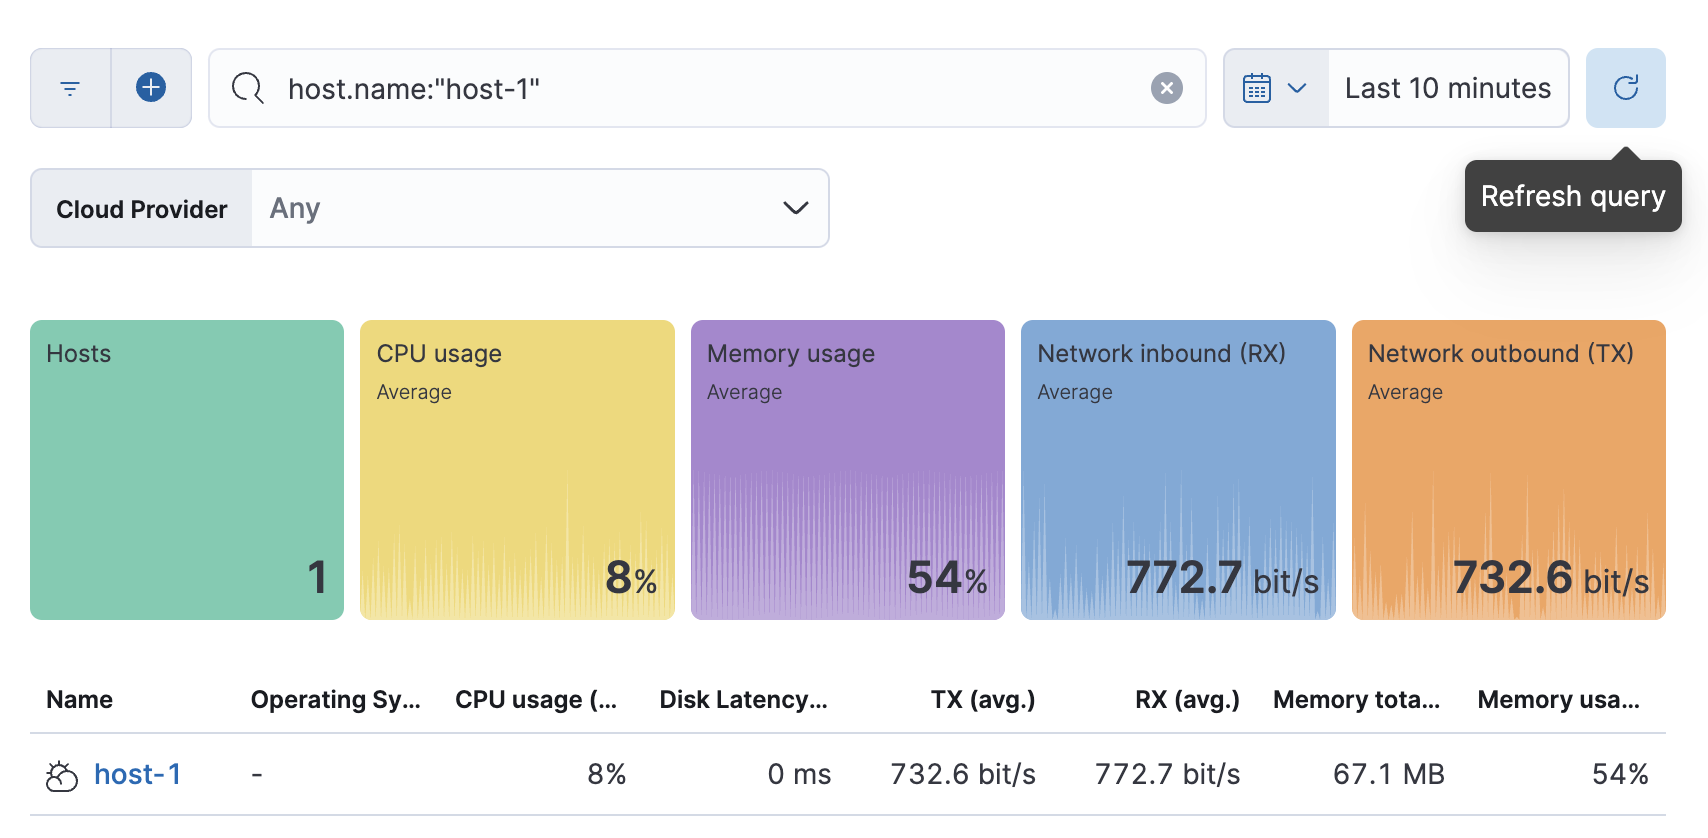
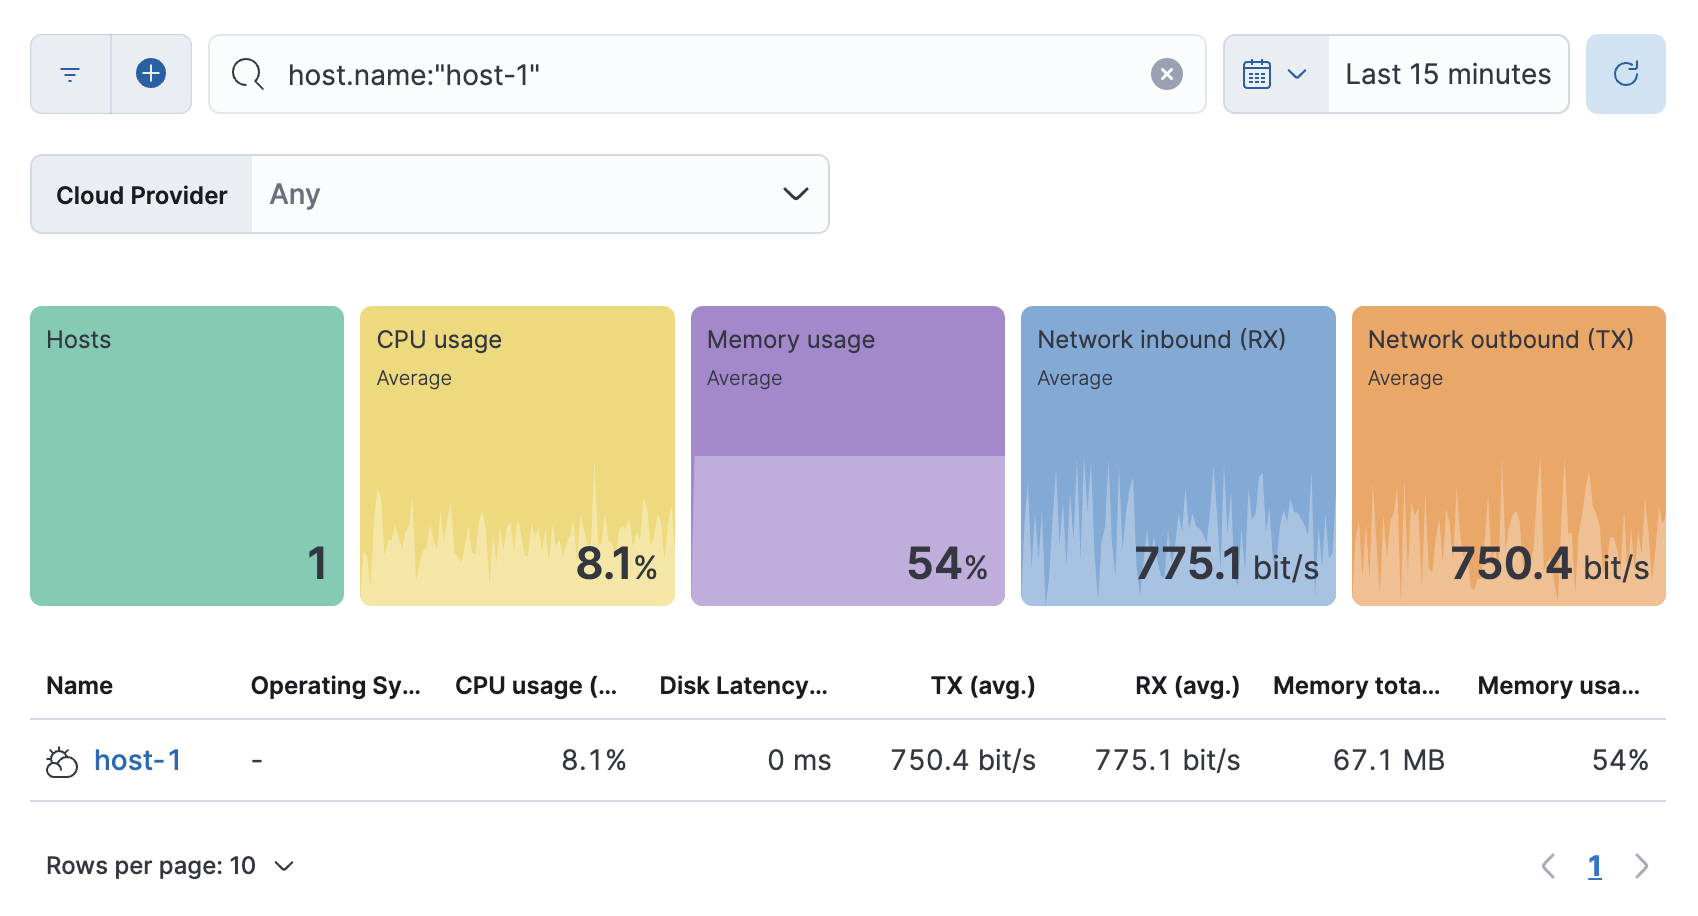
| Last 15 mins | 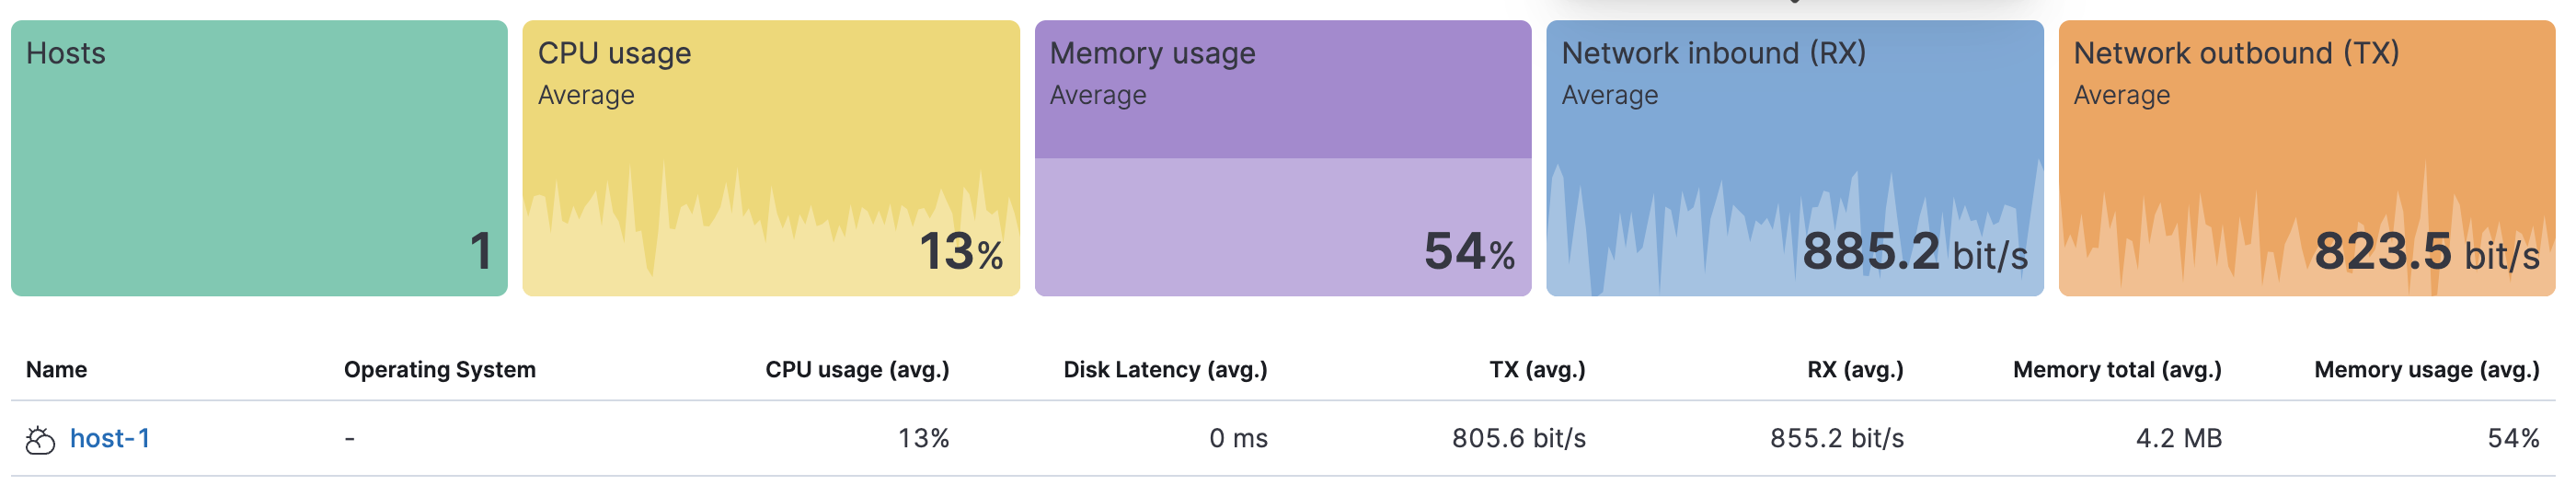 |
❌ | ❌ |
| Last 20 mins | 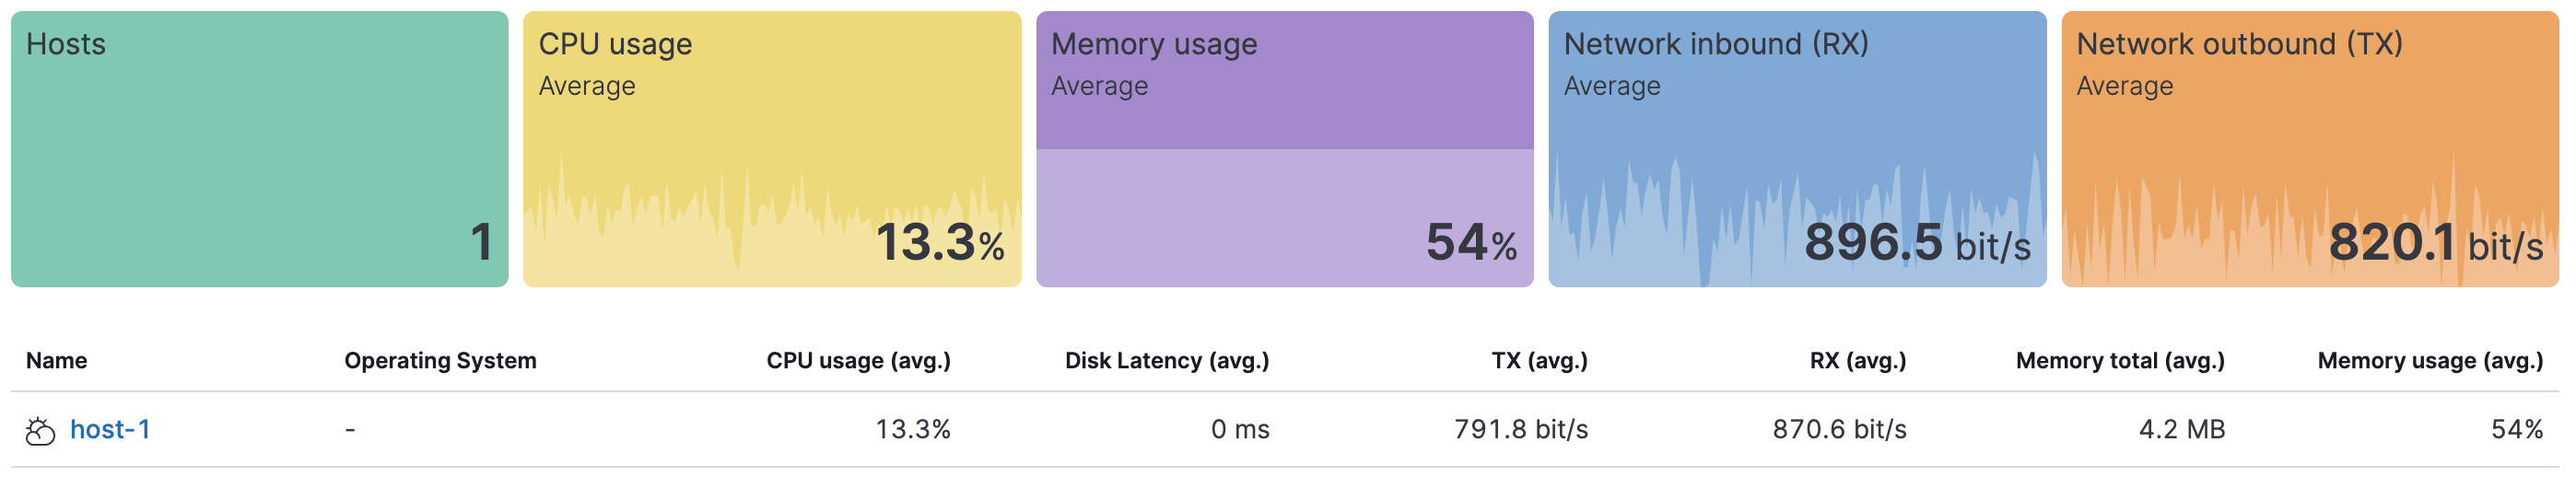 |
❌ | ❌ |
| Last 30 mins | 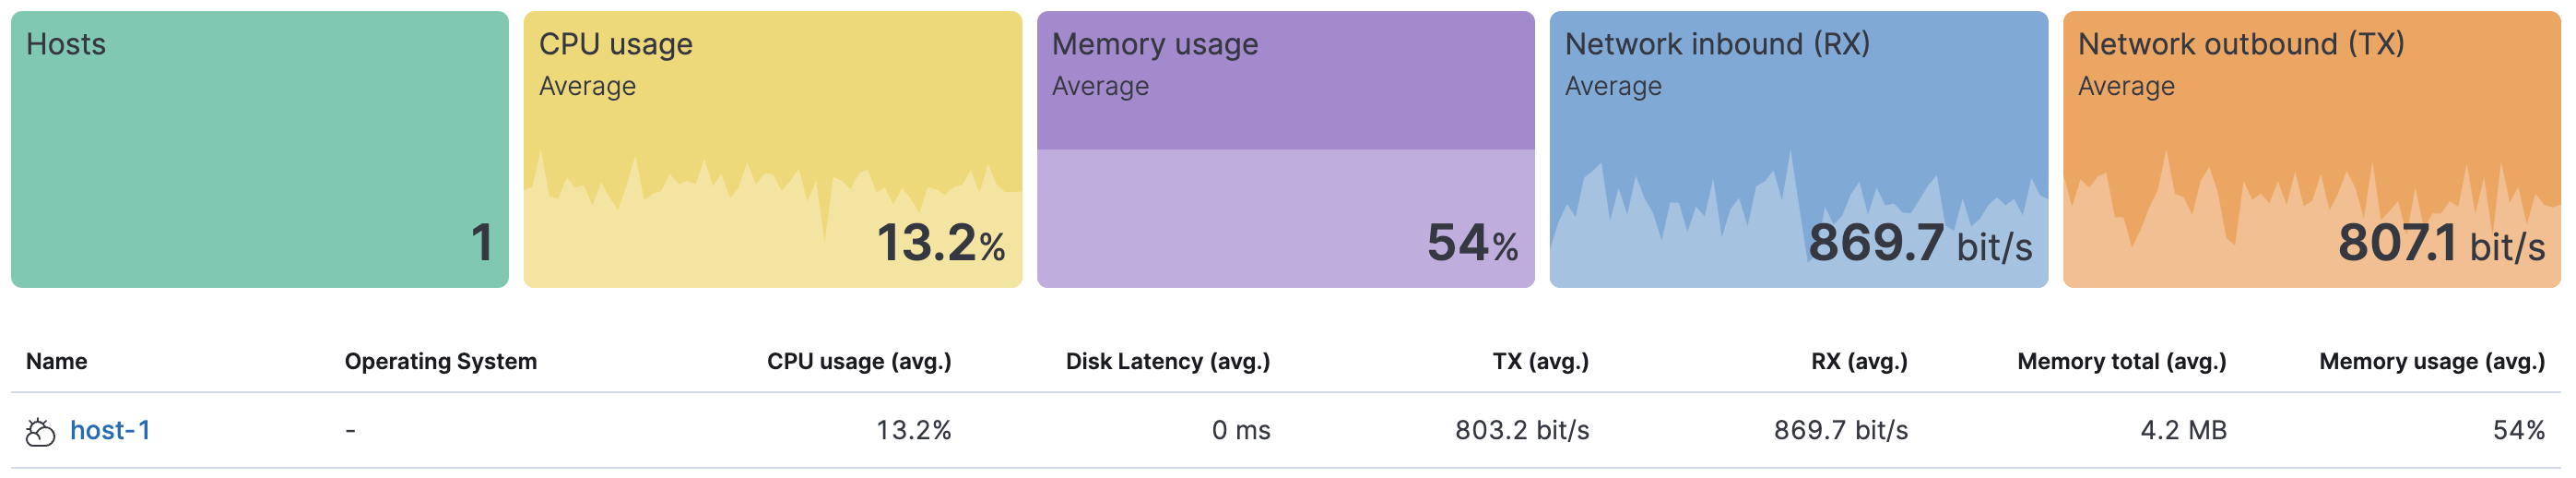 |
✅ | ❌ |
Yeah. My tests were clearly biased and didn't catch these big differences. Thanks for thoroughly testing this. Pushing another change to mitigate it:
I believe this fix won't solve all scenarios, though. e.g: querying for the last 15m in a real environment might possibly return different values because both KPI and table queries run at different times. Absolute time ranges should always return the same values, in theory. But they run different queries (one with a date histogram and another without it), so it's possible that small differences can be seen. |
|
@elasticmachine merge upstream |
tonyghiani
left a comment
There was a problem hiding this comment.
LGTM, thanks for applying the changes :)
💛 Build succeeded, but was flaky
Failed CI StepsTest Failures
Metrics [docs]Async chunks
Unknown metric groupsESLint disabled line counts
Total ESLint disabled count
History
To update your PR or re-run it, just comment with: |
…tion (elastic#152333)

## Summary

Closes [elastic#152328](elastic#152328)

This PR fixes the average calculation in the Snapshot API, filtering out
buckets with null values from it, which are more likely to appear with
queries that use small data ranges.

The results after this change are equal to what Elasticsearch would
calculate in the avg aggregation

### How to test

- Make sure you have metrics data (either through enabling the system
module in metricbeat or connecting your local kibana to an oblt-cli
cluster)
- Navigate to `Infrastructure` > `Hosts`
- Filter the results to see a single host
- Change the data range filter and compare the KPIs against the table.
- Validate other pages that use the Snapshot API (Inventory UI and
Metrics UI to see if the results there are still correct

---------

Co-authored-by: Kibana Machine <42973632+kibanamachine@users.noreply.github.com>
(cherry picked from commit f6a0b88)
💚 All backports created successfully
Note: Successful backport PRs will be merged automatically after passing CI. Questions ?Please refer to the Backport tool documentation |

…alculation (#152333) (#152461)

# Backport

This will backport the following commits from `main` to `8.7`:
- [[Infrastructure UI] Filter out null bucket items from average
calculation (#152333)](#152333)

<!--- Backport version: 8.9.7 -->

### Questions ?
Please refer to the [Backport tool
documentation](https://github.com/sqren/backport)

<!--BACKPORT [{"author":{"name":"Carlos
Crespo","email":"crespocarlos@users.noreply.github.com"},"sourceCommit":{"committedDate":"2023-03-01T14:31:35Z","message":"[Infrastructure
UI] Filter out null bucket items from average calculation
(#152333)\n\n## Summary\r\n\r\nCloses
[#152328](https://github.com/elastic/kibana/issues/152328)\r\n\r\nThis
PR fixes the average calculation in the Snapshot API, filtering
out\r\nbuckets with null values from it, which are more likely to appear
with\r\nqueries that use small data ranges.\r\n\r\nThe results after
this change are equal to what Elasticsearch would\r\ncalculate in the
avg aggregation\r\n\r\n\r\n### How to test \r\n\r\n- Make sure you have
metrics data (either through enabling the system\r\nmodule in metricbeat
or connecting your local kibana to an oblt-cli\r\ncluster)\r\n- Navigate
to `Infrastructure` > `Hosts`\r\n- Filter the results to see a single
host\r\n- Change the data range filter and compare the KPIs against the
table.\r\n- Validate other pages that use the Snapshot API (Inventory UI
and\r\nMetrics UI to see if the results there are still
correct\r\n\r\n---------\r\n\r\nCo-authored-by: Kibana Machine
<42973632+kibanamachine@users.noreply.github.com>","sha":"f6a0b886b143dea6b3b6f8101e21be5c1816558a","branchLabelMapping":{"^v8.8.0$":"main","^v(\\d+).(\\d+).\\d+$":"$1.$2"}},"sourcePullRequest":{"labels":["Feature:Metrics
UI","Team:Infra Monitoring
UI","release_note:skip","backport:prev-minor","v8.7.0","Feature:ObsHosts","v8.8.0"],"number":152333,"url":"https://github.com/elastic/kibana/pull/152333","mergeCommit":{"message":"[Infrastructure
UI] Filter out null bucket items from average calculation
(#152333)\n\n## Summary\r\n\r\nCloses
[#152328](https://github.com/elastic/kibana/issues/152328)\r\n\r\nThis
PR fixes the average calculation in the Snapshot API, filtering
out\r\nbuckets with null values from it, which are more likely to appear
with\r\nqueries that use small data ranges.\r\n\r\nThe results after
this change are equal to what Elasticsearch would\r\ncalculate in the
avg aggregation\r\n\r\n\r\n### How to test \r\n\r\n- Make sure you have
metrics data (either through enabling the system\r\nmodule in metricbeat
or connecting your local kibana to an oblt-cli\r\ncluster)\r\n- Navigate
to `Infrastructure` > `Hosts`\r\n- Filter the results to see a single
host\r\n- Change the data range filter and compare the KPIs against the
table.\r\n- Validate other pages that use the Snapshot API (Inventory UI
and\r\nMetrics UI to see if the results there are still
correct\r\n\r\n---------\r\n\r\nCo-authored-by: Kibana Machine
<42973632+kibanamachine@users.noreply.github.com>","sha":"f6a0b886b143dea6b3b6f8101e21be5c1816558a"}},"sourceBranch":"main","suggestedTargetBranches":["8.7"],"targetPullRequestStates":[{"branch":"8.7","label":"v8.7.0","labelRegex":"^v(\\d+).(\\d+).\\d+$","isSourceBranch":false,"state":"NOT_CREATED"},{"branch":"main","label":"v8.8.0","labelRegex":"^v8.8.0$","isSourceBranch":true,"state":"MERGED","url":"https://github.com/elastic/kibana/pull/152333","number":152333,"mergeCommit":{"message":"[Infrastructure
UI] Filter out null bucket items from average calculation
(#152333)\n\n## Summary\r\n\r\nCloses
[#152328](https://github.com/elastic/kibana/issues/152328)\r\n\r\nThis
PR fixes the average calculation in the Snapshot API, filtering
out\r\nbuckets with null values from it, which are more likely to appear
with\r\nqueries that use small data ranges.\r\n\r\nThe results after
this change are equal to what Elasticsearch would\r\ncalculate in the
avg aggregation\r\n\r\n\r\n### How to test \r\n\r\n- Make sure you have
metrics data (either through enabling the system\r\nmodule in metricbeat
or connecting your local kibana to an oblt-cli\r\ncluster)\r\n- Navigate
to `Infrastructure` > `Hosts`\r\n- Filter the results to see a single
host\r\n- Change the data range filter and compare the KPIs against the
table.\r\n- Validate other pages that use the Snapshot API (Inventory UI
and\r\nMetrics UI to see if the results there are still
correct\r\n\r\n---------\r\n\r\nCo-authored-by: Kibana Machine
<42973632+kibanamachine@users.noreply.github.com>","sha":"f6a0b886b143dea6b3b6f8101e21be5c1816558a"}}]}]
BACKPORT-->

Co-authored-by: Carlos Crespo <crespocarlos@users.noreply.github.com>
…tion (elastic#152333)

## Summary

Closes [elastic#152328](elastic#152328)

This PR fixes the average calculation in the Snapshot API, filtering out
buckets with null values from it, which are more likely to appear with
queries that use small data ranges.

The results after this change are equal to what Elasticsearch would
calculate in the avg aggregation


### How to test

- Make sure you have metrics data (either through enabling the system
module in metricbeat or connecting your local kibana to an oblt-cli
cluster)
- Navigate to `Infrastructure` > `Hosts`
- Filter the results to see a single host
- Change the data range filter and compare the KPIs against the table.
- Validate other pages that use the Snapshot API (Inventory UI and
Metrics UI to see if the results there are still correct

---------

Co-authored-by: Kibana Machine <42973632+kibanamachine@users.noreply.github.com>
Summary
Closes #152328
This PR fixes the average calculation in the Snapshot API, filtering out buckets with null values from it, which are more likely to appear with queries that use small data ranges.
The results after this change are equal to what Elasticsearch would calculate in the avg aggregation
How to test
Infrastructure>Hosts