Line chart can clip or fail to show point at the top of the range #13248
Description
Kibana version: 6.0.0-beta1
Elasticsearch version: 6.0.0-beta1
Server OS version: CentOS
Browser version: Chrome
Browser OS version: Windows 10
Original install method (e.g. download page, yum, from source, etc.): .rpm packages
Description of the problem including expected versus actual behavior:
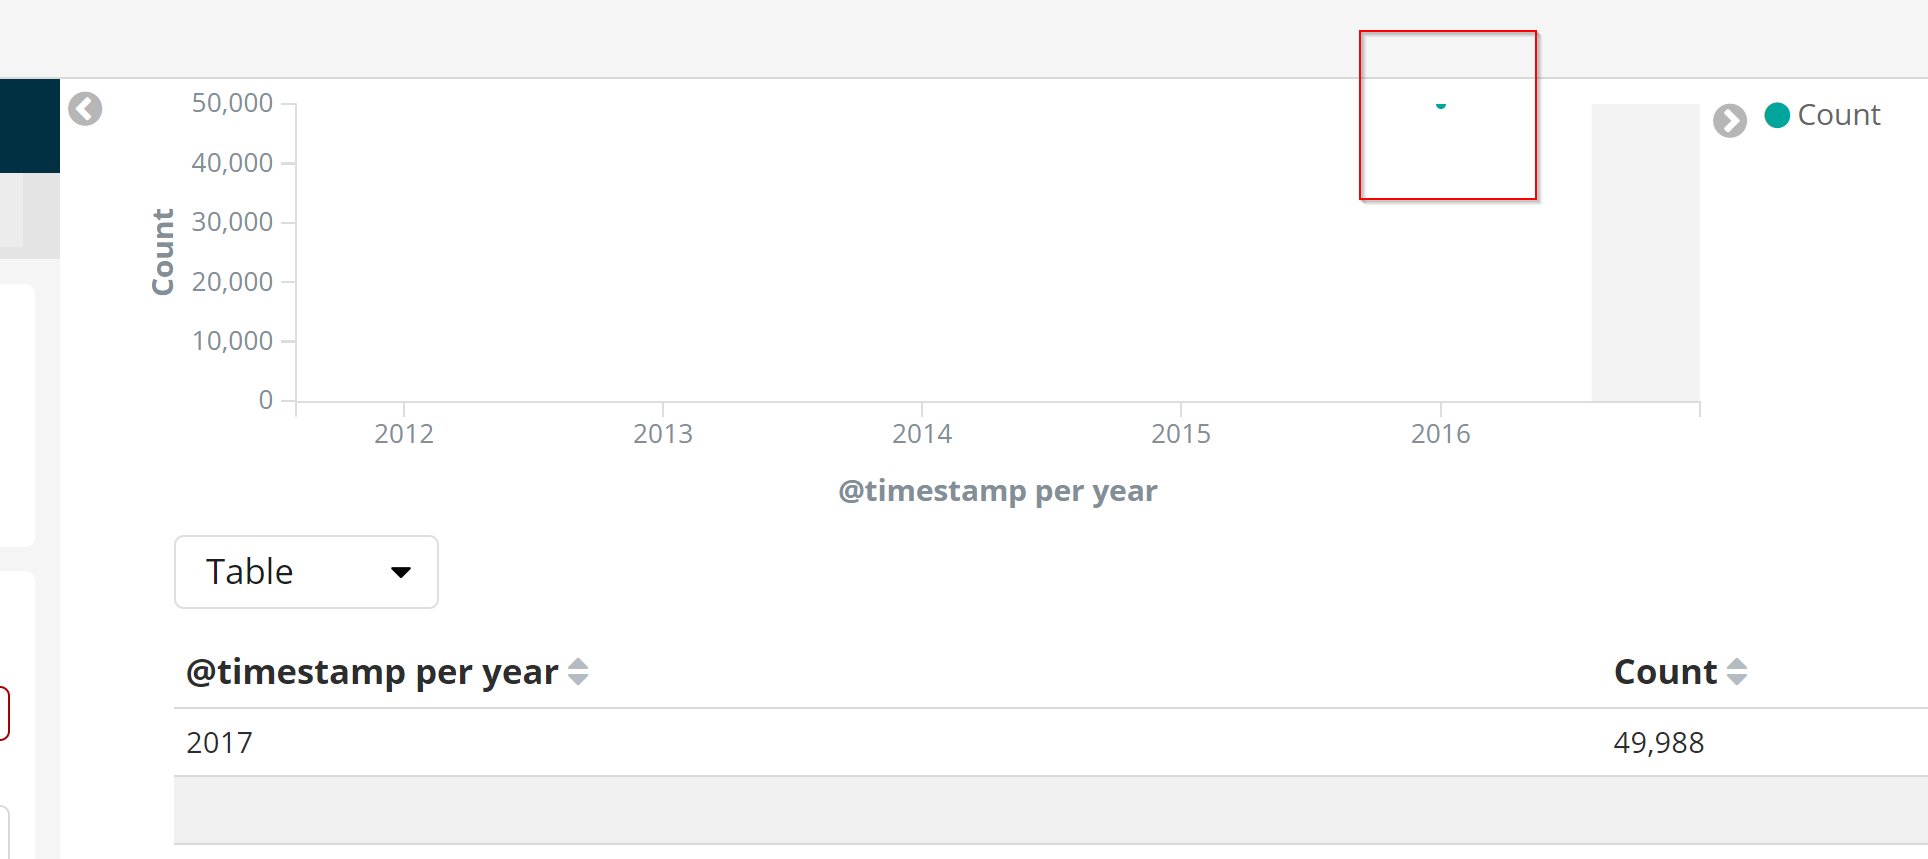
In my case I had selected a large timespan (Last 5 years) and large Interval for a Date Histogram (yearly) which resulted in 1 data point for my metricbeat data. The Count was 49,988 and the y-Axis scale was 0 - 50,000. So in this case the one data point is half cut off in the visualization (see screenshot).
@Rasroh had a very similar case where we couldn't even see the data point. We had to look at the data in the spy panel to figure out that the point was near the y-axis max value.
Steps to reproduce:
- Load some data for a short timespan
- Create a Line visualization on that data. Select a large timespan and large interval so you only have 1 data point. I don't know if this is really required. It might be that there can be multiple data points and the highest ones will be clipped or missing.
Here's the screenshot with the spy panel open showing the circle data point clipped in half. It looks the same when the spy pnel is closed.
Errors in browser console (if relevant):
Provide logs and/or server output (if relevant):