possible request handler memory leak in TransportService #72852
Description
We recently discovered a memory leak in the TransportService in a production use case of ES v2.4. Of course, v2.4 is old and EOL (and we're working on upgrading!), but we took a look at ES7 and believe it would have the same behavior as the relevant code paths are quite similar.
The problem lies in the ability to create unbounded growth in the requestHandlers map if certain requests never receive responses.
How request handlers are removed
From our understanding reading through the code, a requestHandler is removed when:
- Sending a request fails to be submitted to the network:
- A request times out, but this only applies if a transport timeout was specified:
elasticsearch/server/src/main/java/org/elasticsearch/transport/TransportService.java
Lines 1059 to 1065 in 694229f
- When a response for the given request is received:
elasticsearch/server/src/main/java/org/elasticsearch/transport/Transport.java
Lines 224 to 232 in 694229f
- The transport connection is closed:
elasticsearch/server/src/main/java/org/elasticsearch/transport/TransportService.java
Lines 1019 to 1023 in 694229f
What can go wrong
In our case, we saw the requestHandlers (called clientHandlers in v2.4) balloon to 50K+ entries, many of which were for requests that were days old. What happened was:
- A scroll request came in (which does not get a transport timeout by default, invalidating removal option (2))
- The scroll request was successfully submitted to the network (invalidating removal option (1))
- A network partition meant a response from the destination node was never received, but the overall connection stayed open (invalidating removal options (3) and (4))
These are screencaps from a v2.4 heap dump, but since it has the same 4 request handler removal options I believe they similarly apply to ES7:
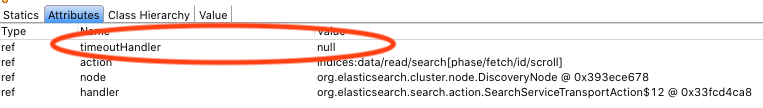
By default, client requests do not receive transport timeouts
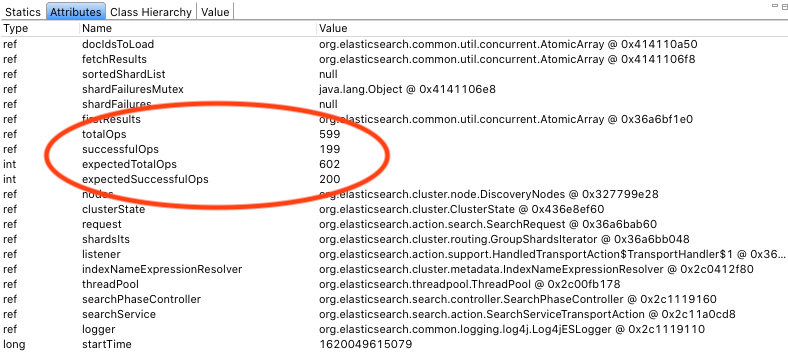
A request never received a response from a single destination node, causing the entire pending request+response to be permanently stuck in memory
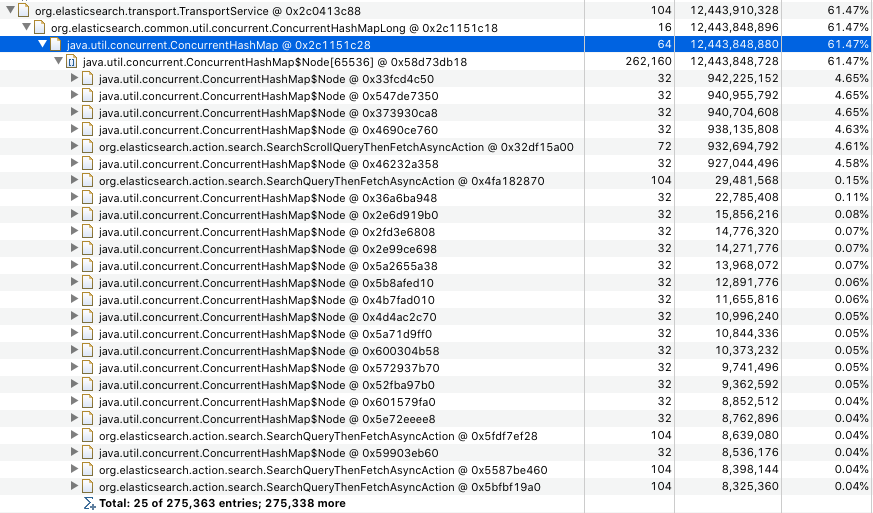
Over time this caused a huge buildup of stale handler entries, taking over 12GB of heap. (yes, we know those 1GB response entries aren't great, yes we're working on fixing them :) )
Possible solutions
Assuming our analysis of ES7 is sound and this could still be a problem in the latest builds, some possible solutions:
- Always set a transport timeout on requests, to ensure requests are eventually cleaned up. For known long-running requests this might need to be adapted to verify the requests are still making forward progress and re-schedule the timeouts.
- Use a reaper thread to comb through the
requestHandlersmap with some frequency to see if any requests are stuck - Retrying a request if no response is received after a certain period of time
This issue for v6.2.4 also seems quite relevant and is very similar to the heap dumps we pulled from v2.4: https://discuss.elastic.co/t/heap-memory-leak-in-elasticsearch-6-2-4/214419