Swim lane visualization #752
Description
Is your feature request related to a problem? Please describe.
Currently, we have a custom swim lane visualization in the Kibana ML plugin that covers a particular use-case for anomalous data over time.
Besides, there is an external kibana-swimlane-vis plugin supported by @peteharverson which a user can install with Kibana up to 7.6.2 version to plot any metric data over time with some customization available. As our current Anomaly swim lane visualization requires some re-work and kibana-swimlane-vis can't be used with recent kibana versions, we come up with a decision of implementing a reusable visualization that covers both cases and potentially can be adopted by other solutions in Kibana. elastic-charts seems a perfect place for it.
Describe the solution you'd like
It would be great to get some assistance with defining a skeleton code so we can develop the actual implementation of the visualization.
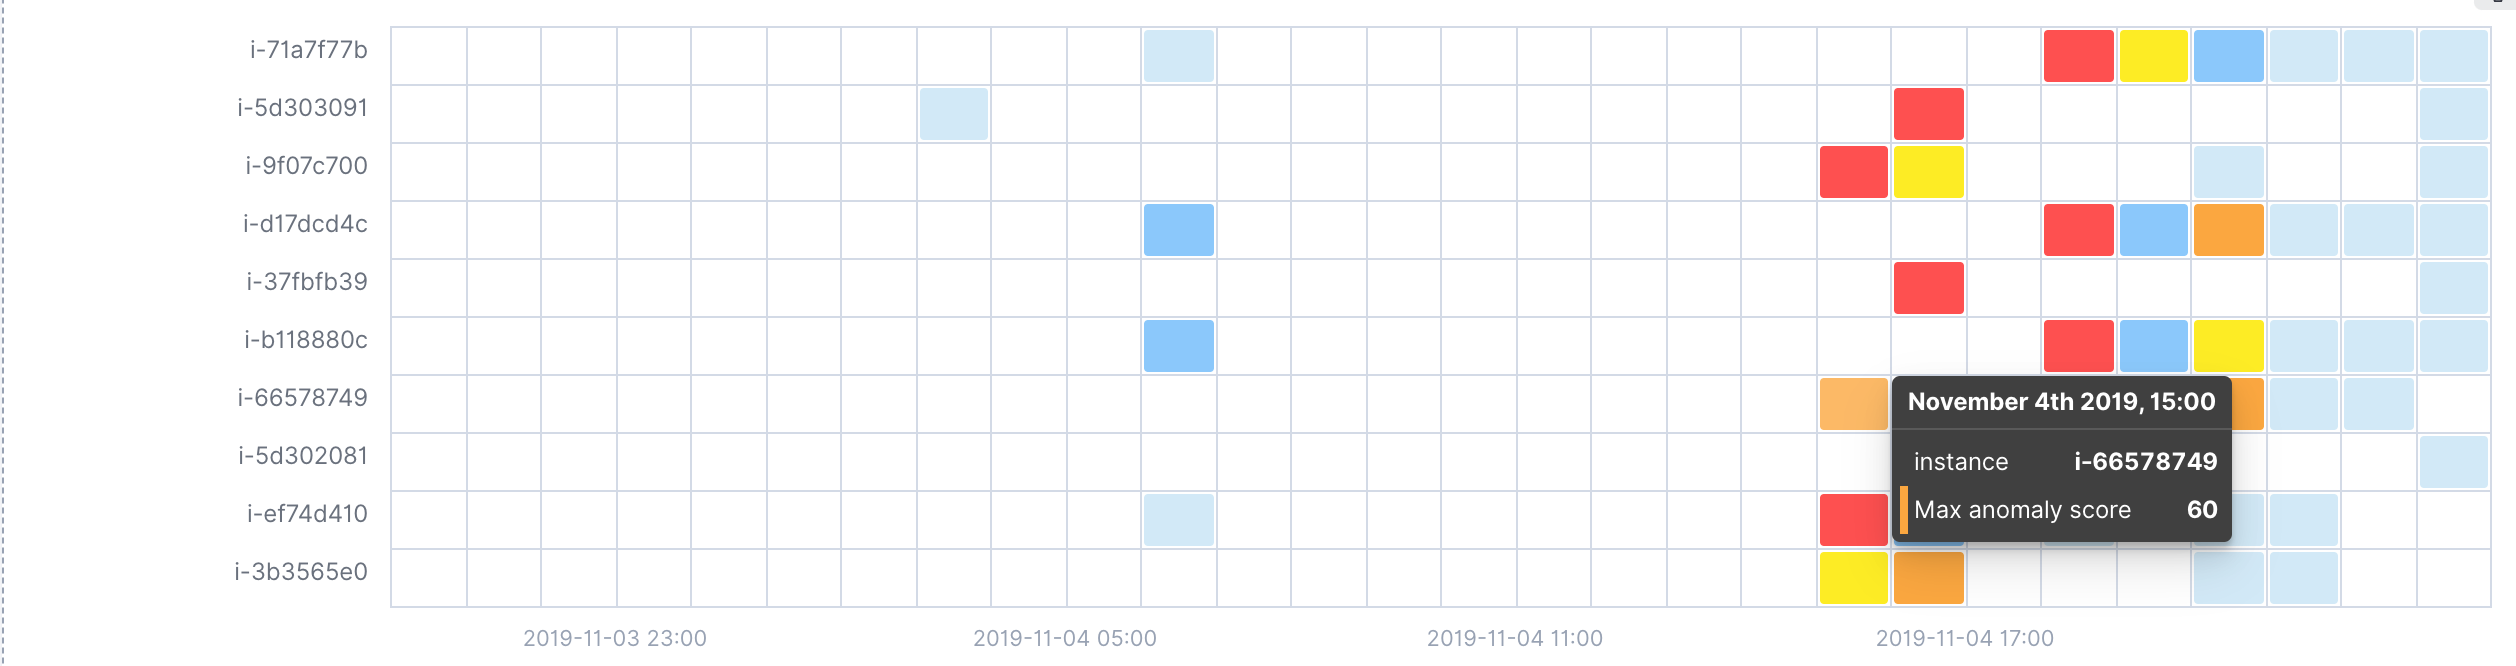
Required features:
- hover and click actions on each cell
- rectangular brush tool to select a subset area
- discrete color ranges
- color legend
Additional context
After swim lane visualization is released in elastic-charts it could become a part of the built-in Kibana visualizations included in the Basic distribution, so there is no need to maintain the kibana-swimlane-vis.
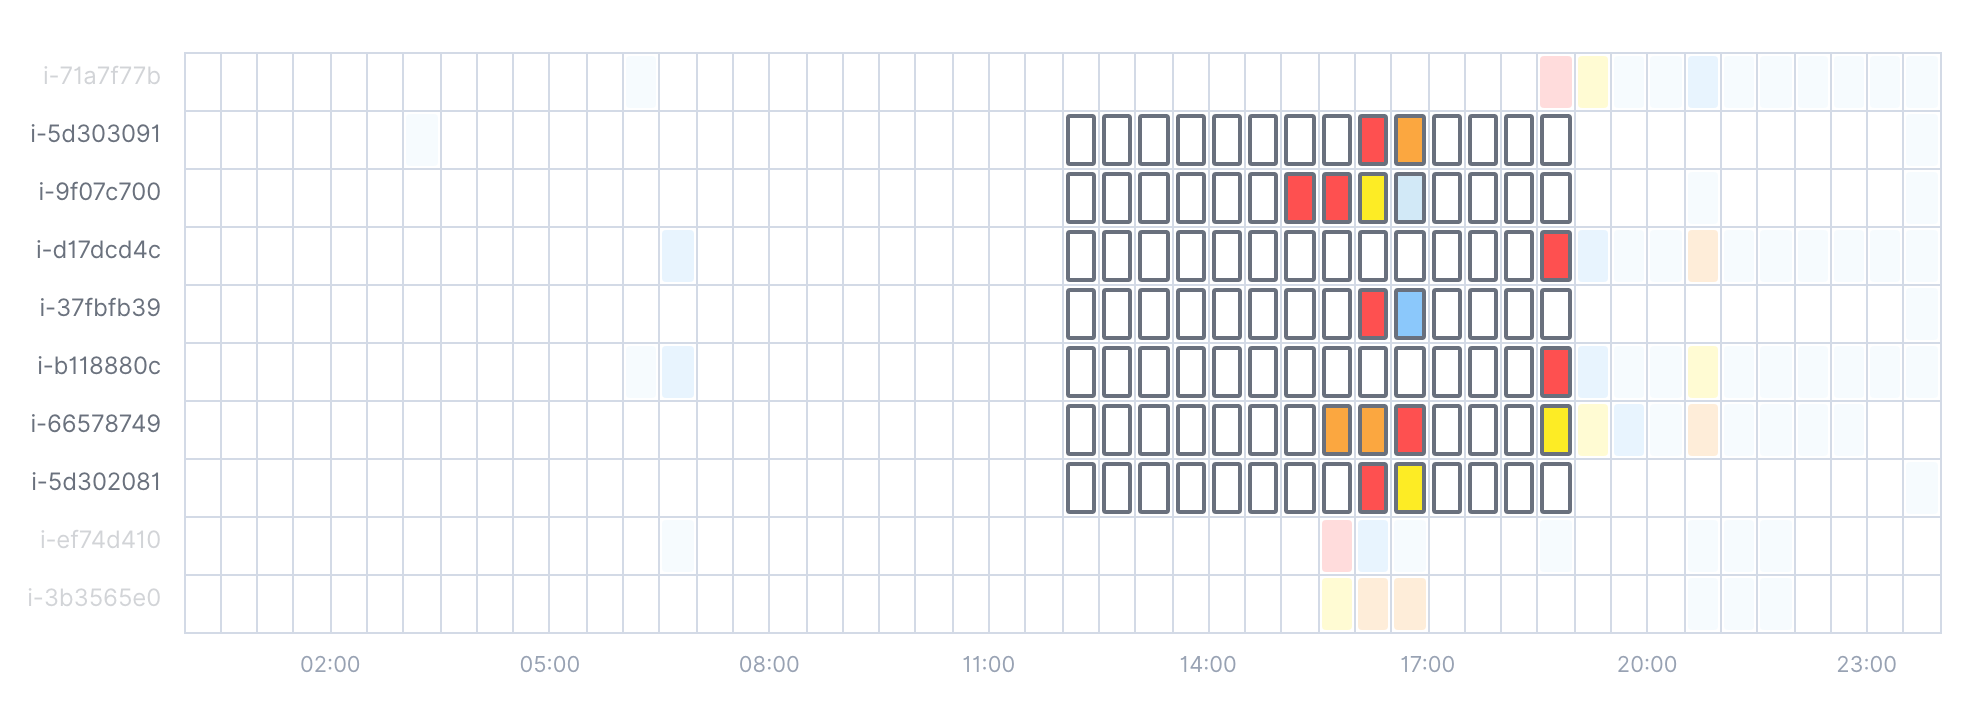
Brush control
Brush selection should support the following:
- Highlight selected cells
- Mask labels on the X and Y axis, and the cells itself that outside of the selection area
- Input props should support initial selection
Example:
Checklist
- this request is checked against already existing requests