-
Notifications
You must be signed in to change notification settings - Fork 358
New issue
Have a question about this project? Sign up for a free GitHub account to open an issue and contact its maintainers and the community.
By clicking “Sign up for GitHub”, you agree to our terms of service and privacy statement. We’ll occasionally send you account related emails.
Already on GitHub? Sign in to your account
Add DataFrame.plot.kde() (an alias of 'density') #784
Conversation
|
@itholic, can you show an example with more than two columns? |
|
@HyukjinKwon Sure, Here is and for each row as Series.plot.kde looks same like below: |
|
@itholic, looks good. Can you fix the tests? |
|
@HyukjinKwon i'm still working on it, but these tests are still failed, i'm trying to find out solution. |
|
@HyukjinKwon Let me share the question here, too. #767 (comment) which might relate to this PR. |
|
@itholic can you check ^? I'll check it tomorrow. |
|
@HyukjinKwon Sure, i'll check this out. sorry to late reply (it was very busy today 😭 ) |
|
@HyukjinKwon Thanks for review !! i just resolved all that you commented. |
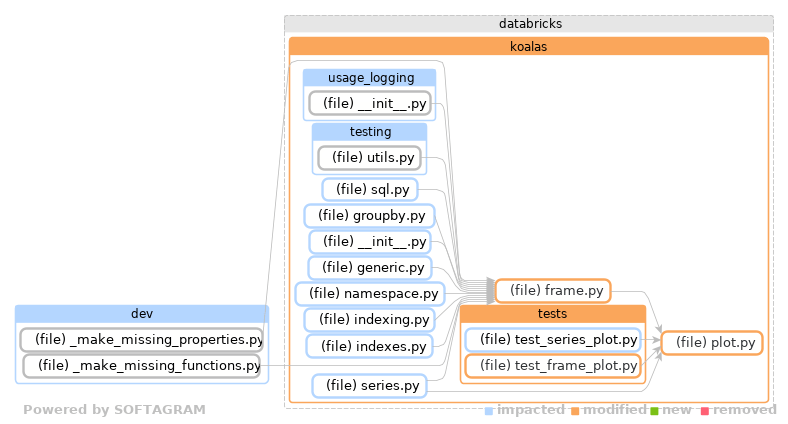
Softagram Impact Report for pull/784 (head commit: d8fbcb8)⭐ Change Overview
💡 Insights
📄 Full report
Impact Report explained. Give feedback on this report to [email protected] |
Codecov Report
@@            Coverage Diff             @@
##           master     #784      +/-   ##
==========================================
- Coverage   94.29%   94.26%   -0.04%
==========================================
  Files          32       32
  Lines        5911     5913       +2
==========================================
  Hits         5574     5574
- Misses        337      339       +2
Continue to review full report at Codecov.
|
|
@ueshin, I am going to rewrite the plot tests soon. Let me merge this for now. |
|
Sounds good, thanks! |
|
I made a PR #838 BTW, @itholic, can you add some examples for plot implementations in their docstrings? Basically we finished the rough implementation of all plots (except 2 in DataFrame). So it should be better to have some examples. Can you also check if we're able to post some images? e.g. https://pandas.pydata.org/pandas-docs/stable/reference/api/pandas.DataFrame.plot.box.html#pandas.DataFrame.plot.box |
|
@HyukjinKwon sure, I'm going to add & check them 😃 |
| @@ -243,4 +243,6 @@ specific plotting methods of the form ``DataFrame.plot.<kind>``. | |||
| DataFrame.plot.line | |||
| DataFrame.plot.pie | |||
| DataFrame.plot.scatter | |||
| DataFrame.hist | |||
| DataFrame.plot.hist | |||
There was a problem hiding this comment.
Choose a reason for hiding this comment
The reason will be displayed to describe this comment to others. Learn more.
Seems like DataFrame.plot.hist is listed twice.
I'm not sure we should keep DataFrame.hist, though.
There was a problem hiding this comment.
Choose a reason for hiding this comment
The reason will be displayed to describe this comment to others. Learn more.
@itholic can you fix this? DataFrame.hist seems in the pandas doc as an alias. Let's keep it for now.
There was a problem hiding this comment.
Choose a reason for hiding this comment
The reason will be displayed to describe this comment to others. Learn more.
sure, fixed in #851
Thanks for comment !!


This PR implements kde in DataFrame. It reuses Series' implementation. at #767
like Series's kde plot, Since DataFrame's also uses MLlib's KernelDensity API to calculate KDE , so slightly different from pandas but seems good enough either:
And also kde is an alias of 'density', you can get exactly same result when you use 'density' rather than 'kde' like below:
Multiple columns examples:
and for each row as Series.plot.kde looks same like below: