ENH: Add scatter plot for Frame #719
Conversation
 charlesdong1991
commented
charlesdong1991
commented
Aug 29, 2019
•


|
ideally, should use docstring with is identical to what pandas have, however, i encountered quite annoying linting error issue with docstring which I have no idea how to fix, so for now, i keep |
Codecov Report
@@            Coverage Diff             @@
##           master     #719      +/-   ##
==========================================
- Coverage   94.18%   92.43%   -1.76%
==========================================
  Files          32       32
  Lines        5559     5567       +8
==========================================
- Hits         5236     5146      -90
- Misses        323      421      +98
Continue to review full report at Codecov.
|

databricks/koalas/plot.py
Outdated
| @@ -509,6 +509,17 @@ def _make_plot(self): | |||
| super(KoalasBarhPlot, self)._make_plot() | |||
|
|
|||
|
|
|||
| class KoalasScatterPlot(ScatterPlot, TopNPlot): | |||
| max_rows = 1000 | |||
There was a problem hiding this comment.
I think we can remove this.
There was a problem hiding this comment.
ahh, yeah, removed. and added pics in description, i thought i did it yesterday. my bad
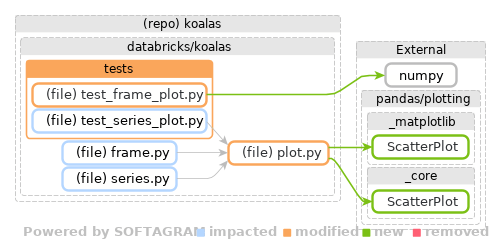
Softagram Impact Report for pull/719 (head commit: cc87273)⭐ Change Overview
📄 Full report
Impact Report explained. Give feedback on this report to [email protected] |
|
@charlesdong1991, before we merge, can you check if Koalas plot adds "showing top 1,000 elements only" in the output chart when the rows are larger than 1000? |
|
@HyukjinKwon good call! cannot really read it because font size is a bit too small to me 😅 but we probably can tell from density of points that
|

|
Thanks for testing it out, @charlesdong1991. |
|
How to use all the rows for the plot? |
|
|
|
|
@HyukjinKwon I am trying to make subplots using Koalas Dataframe but it comes blank. Any suggestions or help on this? |
|
@Ankurneural can you create a new ticket with the full codes and output? |