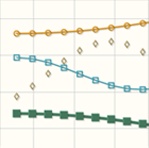
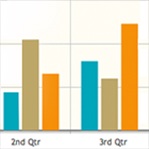
jqPlot is a plotting and charting plugin for the jQuery Javascript framework. jqPlot produces beautiful line, bar and pie charts with many features:
- Numerous chart style options.
- Date axes with customizable formatting.
- Up to 9 Y axes.
- Rotated axis text.
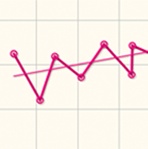
- Automatic trend line computation.
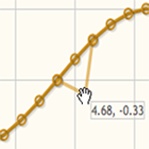
- Tooltips and data point highlighting.
- Sensible defaults for ease of use.
- Large number of plugins renderers.
Last builded files are generated in the build directory.
- To build from sources file you need nodejs
- Type:
npm run distto build all distribution.
- Import into your web page:
<script src="<directory_jqplot_dist>/core/jquery.min.js"></script>
<script src="<directory_jqplot_dist>/core/jquery.jqplot.min.js"></script>
- Import plugins if any
- Call jqplot building system:
$(function(){
  $.jqplot(<ID_HTML>, <DATAS>, <OPTIONS>);
});
