Near-real-time, interactive, self-contained, non-proprietary implementation of the Cloude Decomposition [1] by Shane R Cloude for:
- rapid exploration of quad-polarized SAR data such as from nisar, uavsar, palsar, or radarsat2 and for
- inspiring new PolSAR applications.
Sample data included.
This July 26 2002 presentation is a companion resource accompanying the article below [1].

"In this paper [1] we show how to develop the idea of orthogonality in radar polarimetry for enhanced target detection and land-use classification of POLSAR data. It is well known that every elliptical polarization has its orthogonal partner, uniquely defined as the antipodal point on the Poincaré sphere. Here we show that for scatterers, we can extend this idea so that every scattering matrix has a corresponding multi-dimensional orthogonal space [2]. We give a geometrical interpretation of this approach using a generalized Poincaré sphere representation. We then derive an algorithm for finding the peak signal in this ortho-space. We derive this optimum for both monostatic and bistatic radar systems, to illustrate how bistatic polarimetry offers great potential benefits in future POLSAR studies."
[1] "Generalized Poincaré Orthogonality: A New Approach to POLSAR Data Analysis" SR Cloude, A Richardson, https://arxiv.org/abs/2109.09093
[2] "Target Detection Using Rank-1 Polarimetric Processing" SR Cloude, IEEE Geoscience and Remote Sensing Letters (2020)
Inputs: A) fully-polarimetric SAR data in standard PolSARPro "T3 coherency matrix" format with config.txt file B) an RGB encoding such as the well-known Pauli encoding, used for selection of a target location C) image coordinates of user-selected target to be "cancelled". Output: optimised radar cross section (a greyscale image)
The interactive version supports exploring fully-polarimetric SAR data quickly, by selecting a target location using the mouse, then viewing the resulting optimised radar cross section promptly
- Tested on Ubuntu 20 LTS and MacOS. Windows to be supported soon
Please open your terminal and run the following commands:
# 1) download the code:
curl -o cloude_decom.zip https://codeload.github.com/ashlinrichardson/cloude_decom/zip/refs/heads/master
unzip cloude_decom.zip
mv cloude_decom-master cloude_decom
cd cloude_decom # 2) enter the project folder
python3 cpp/compile.py # 3) build the project codes..
cd T3 # 4) enter the test data folder..
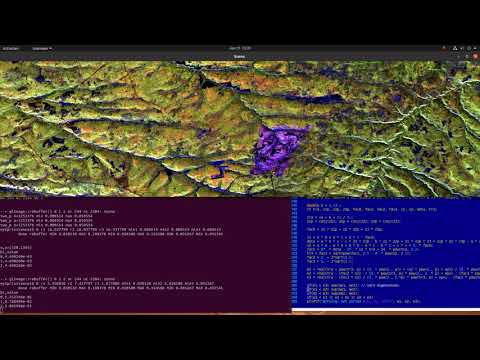
cloude_view # 5) run the interactive program!
If all goes well, you should see an interactive visualization of the test data (as below).
Notes:
- compile.py installs, provided you enter your super-user password:
- required dependencies g++ and freeglut3-dev (on ubuntu). Mac users need to install xcode "command line" development tools
- binaries to /usr/bin/cloude_decom and /usr/bin/cloude_view
- Alternate downloading method, you could use this instead of step "1)" above if you're already connected to github by ssh:
git clone [email protected]:ashlinrichardson/cloude_decom.git # 1) download the project..
and then proceed to "2) enter the project folder". This approach would make sense if you're experienced with GitHub and considering making code revisions
Assuming the mouse pointer is positioned somewhere over the image display:
- depressing the left button, restores the default visualization used (e.g. the pauli encoding)
- releasing the left button, runs the decomposition and displays the optimized radar cross section associated with the target area under the cursor, when the button was released
So it's necessary to engage and then release the left mouse button, to generate an output. Again the location where the mouse button is released, becomes the target area for processing
Depressing the right mouse botton, or the "esc" key on the keyboard, both close the program
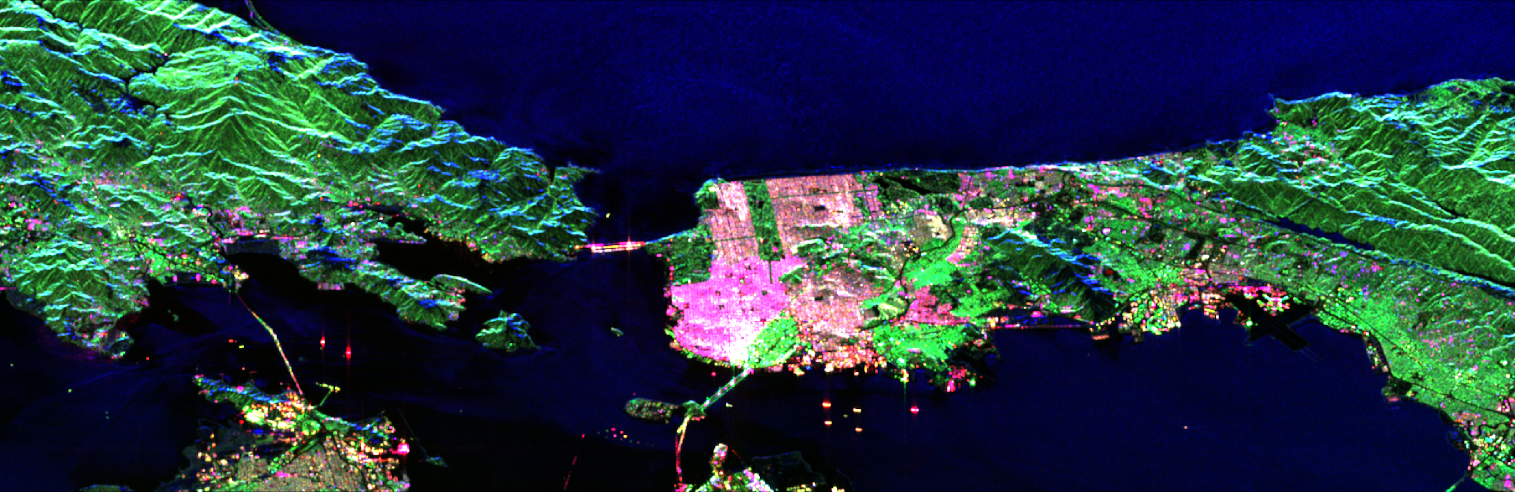
ALOS PALSAR data over SanFransisco, California in pauli encoding (r, g, b) = (T22, T33, T11):
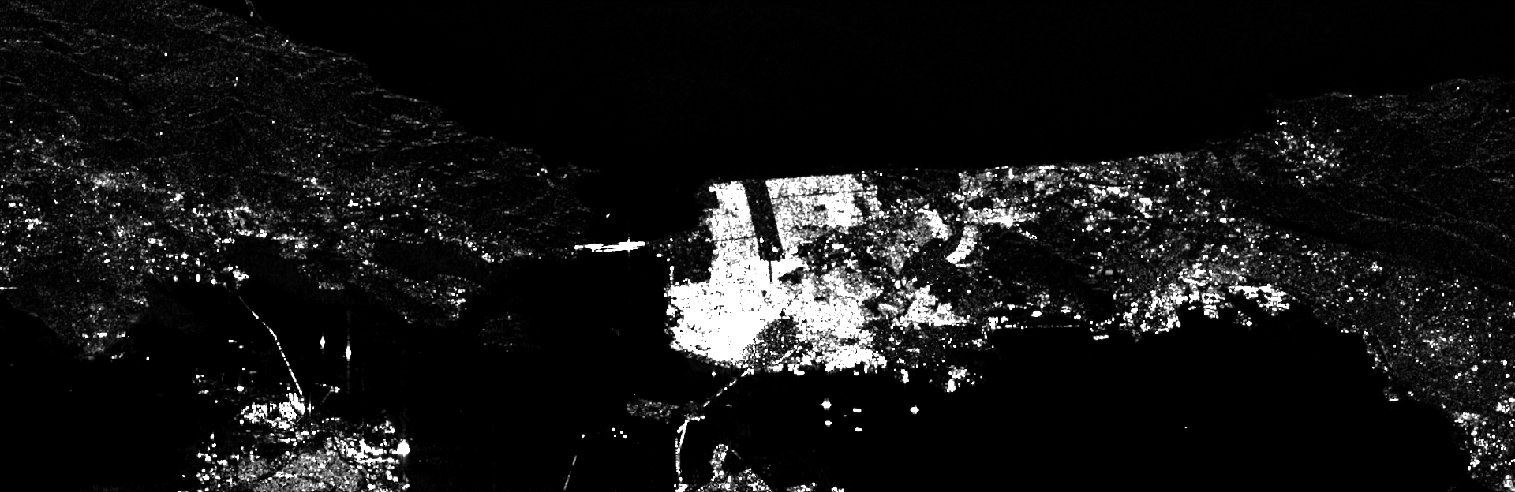
For example, triggering the processing by pointing at water, demonstrates (by "cancelling" water) the ability to pinpoint ships:
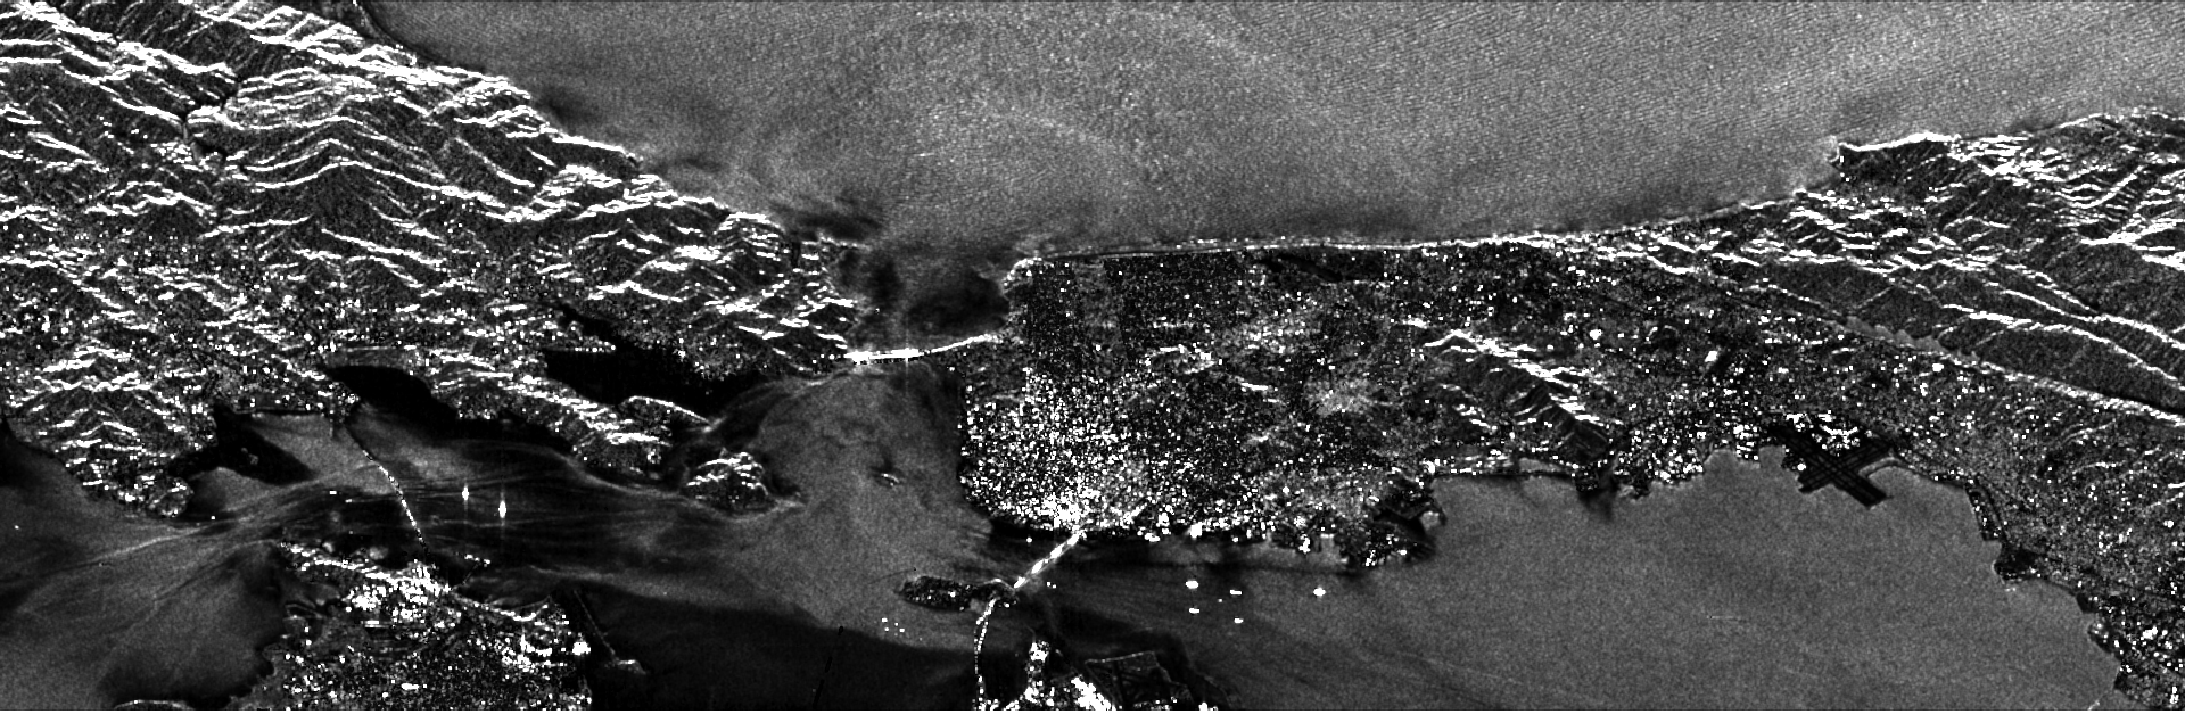
whereas cancelling an urban area highlights oceanographic and topographic features:
At your terminal and from within the cloude_decom folder:
python3 cpp/uninstall.py
Default target window size is 3. To run with a different window size, e.g. 5:
cd T3
cloude_view stack.bin 5
Thanks to Eric Pottier and JAXA for providing ALOS-1 quad-pol data over San Fransisco, California. Please click here to see other sample data generously provided by Dr. Pottier.
Thanks to:
- Hao Chen, Canadian Forest Service
- Subhadip Dey, Indian Institute of Technology Bombay
- Shane Cloude, AELc
for initial beta testing
At your convenience, please be welcome to:
- open an issue on this repository,
- submit a pull request, or
- provide feedback by email