Spark: Add custom metric for number of file splits read by a SparkScan #4395
Conversation
| @Override | ||
| public String description() { | ||
| return "IcebergScan " + super.description(); | ||
| } |
There was a problem hiding this comment.
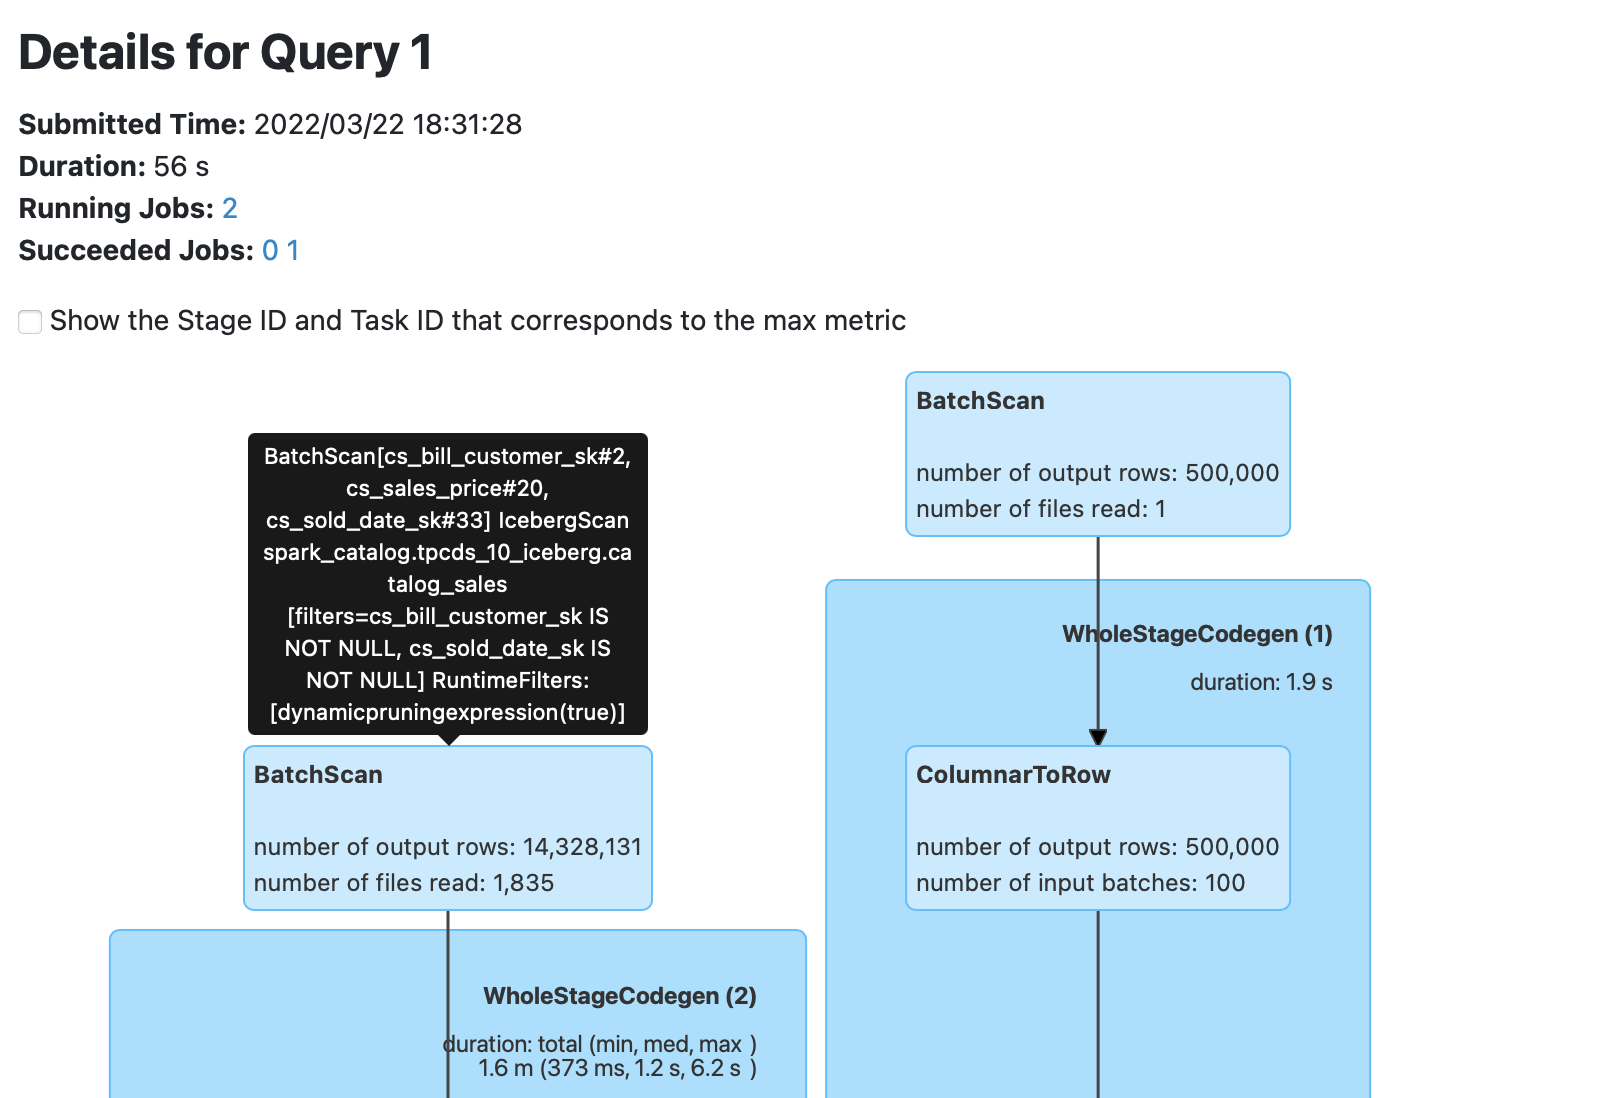
Unfortunately the label for the node in the SQL DAG in the Spark UI just says "BatchScan" (that is the nodeName for a BatchScanExec node, and we can't affect it from Iceberg), but the tool tip for the node contains this description.
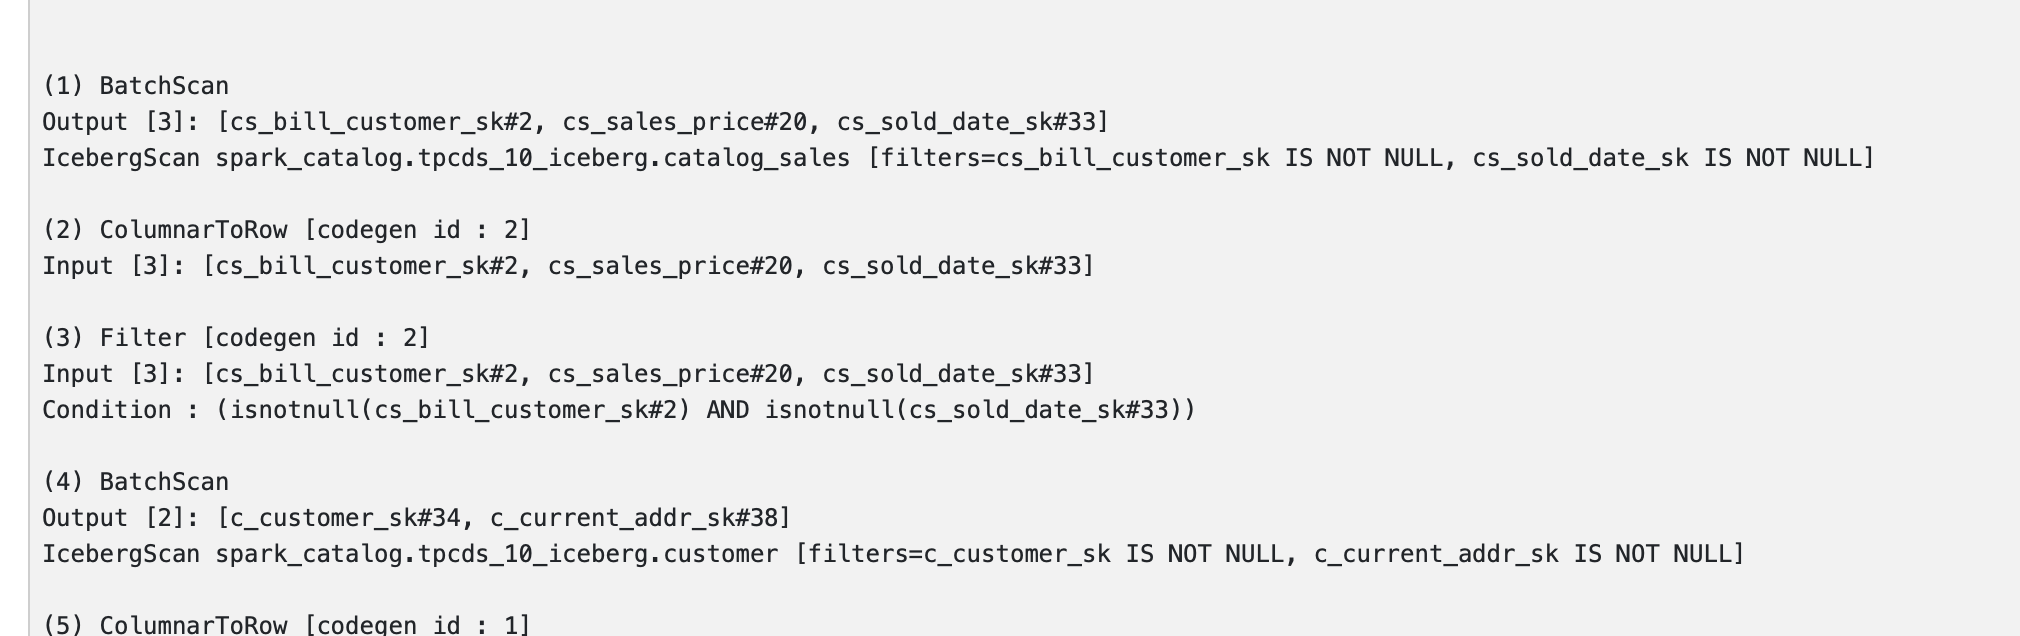
Also, the detailed Physical Plan shows this description. The toString method also uses "IcebergScan" (I followed its lead), but I don't see the toString being used in the Spark UI.
There was a problem hiding this comment.
This sounds good to me even outside the scope of this PR, although maybe we should write Iceberg Batch Scan, since we will probably be generating different descriptions for SparkFileScan and any other Scans we build
There was a problem hiding this comment.
Ah I see we have the other descriptions below, well at least let's match that pattern :) "IcebergBatchScan"?
There was a problem hiding this comment.
I was matching the pattern in the toString method for each of the subclasses of SparkScan. If you prefer, we can use "IcebergBatchScan" in both description and toString for SparkBatchQueryScan.
There was a problem hiding this comment.
I am +1 on BatchScan -> IcebergBatchScan for UI purposes.
I think that updating the toString method should be fine as well if need be, provided it passes tests etc. IcebergBatchScan is closer to the name of the class anyway than plain IcebergScan.
| @Override | ||
| public CustomTaskMetric[] currentMetricsValues() { | ||
| return new CustomTaskMetric[] { new TaskNumFiles(numFilesToRead) }; | ||
| } |
There was a problem hiding this comment.
Note: Spark calls this every 100 rows for each PartitionReader. The numFilesToRead can be computed up front and stored, and is. I wonder if it is worth caching the CustomTaskMetric[] as well.
There was a problem hiding this comment.
can it be a property of this RowReader then as numFilesToScan is already computed in the constructor, and we could just return that when ever asked.
There was a problem hiding this comment.
Yes, this is what I meant, is it worth caching the CustomTaskMetric[], so it can be constructed just once.
I'm undecided.
|
Note that in order for the Spark UI to show the value of the custom metric, the custom metric class must be available in the classpath of the Spark History Server. The simplest way to do this is to put the Iceberg Spark runtime JAR in the SHS classpath. Spark's |
Yeah I was very frustrated with this when i was messing with it. Makes it hard if your history server is not running the same Spark build as your apps :( |
|
@RussellSpitzer thank you for the interest. I just updated the PR to add debug logging on the |
| public String aggregateTaskMetrics(long[] taskMetrics) { | ||
| long sum = initialValue; | ||
| for (int i = 0; i < taskMetrics.length; i++) { | ||
| sum += taskMetrics[i]; | ||
| } | ||
| return NumberFormat.getIntegerInstance().format(sum); | ||
| } |
There was a problem hiding this comment.
[question] should we make this return "total(min, med, max)" we already have all the info required, this should give us even deeper insights on files distribution at task level. WDYT ?
There was a problem hiding this comment.
@singhpk234 thank you for your interesting suggesions!
I am open to presenting the min, median and max as well, but I wonder how useful those statistics really are. My impression is that Iceberg scan planning works well enough that the number of files to scan are usually very evenly distributed (except for cases like where there are two InputPartitions). Usually skew occurs with times (which can of course show great variation), or with number of records after a shuffle (rather than a BatchScan).
@rdblue, @aokolnychyi, @RussellSpitzer what do you think?
There was a problem hiding this comment.
I though the way these are shown in the UI are per task as well? Or am I remembering that wrong. IE we should have all these values (but not the calculated sum?) If not I think that would be good to report, I would suggest probably
min, 25percentile, median, 75percentile, max?
There was a problem hiding this comment.
@RussellSpitzer I think you may be thinking of task metrics that Spark itself collects (by default, Duration, GC Time, Input Size / Records, and Shuffle Size /Records are shown), and are shown with the min, 25th percentile, median, 75th percentile, and max.
For custom SQLMetrics, one implements the aggregateTaskMetrics and we'd need to do the calculation ourselves if we want such statistics. Spark doesn't do it for us. Spark sends all the values it collected from all the PartitionReaders for a given custom metric in a long[] to this aggregateTaskMetrics; that's all. It also doesn't separately calculate these statistics either.
| static long numFilesToScan(CombinedScanTask scanTask) { | ||
| long fileCount = 0L; | ||
| for (FileScanTask file : scanTask.files()) { | ||
| fileCount += 1L; |
There was a problem hiding this comment.
[quetion] should we incorporate delete's as well assosiated with the FileScanTask
| fileCount += 1L; | |
| fileCount += 1L + file.deletes().size(); |
There was a problem hiding this comment.
We could have a separate metric for number of delete files to read. Or rather, a sum of the number of delete files to apply, over the data files to be read; we won't actually track what the delete files are, if there is any overlap among them (can there be overlap?).
@rdblue @aokolnychyi what do you think?
There was a problem hiding this comment.
I think it's fair to count all the delete files, but definitely in another metric.
There will be duplicates in two cases
- It's an equality delete
- There is a position delete file for a data file which is split into being read in two different tasks (this is also a problem for duplicate files being read)
|
So one big issue I have here, and why I kind of gave up on this for the moment, is that we actually know all of this information on the driver before any executors run. Not only do we have it there but we can also eliminate duplicate counts for both delete files and for data files. In the current code we would get incorrect results for number of data files if our split size is smaller than our file size. Imagine we have a 512 mb file and 128 mb split size (and row group) this will generate 4 separate tasks for the same Data file. Counting the file 4 times. On the driver we have already materialized every single FileScanTask and know this information and can do the dedupe, our only problem is currently spark doesn't allow us to populate custom metrics at the Source itself on the driver. I think we should push for that capability in spark rather than doing this at the executor level. (Or do it in conjunction with the executor metrics) |
|
Something we could do with custom metrics that we don't know at planning time would be tracking for example, how many records are eliminated via delete files. That's a good metric to know and we wouldn't know it until a task completes. |
Yes, I realize that we know the number of files before the tasks are run. It would certainly be better if Spark had driver-side custom metrics. But this is something we can implement with what is Spark 3.2 now. It's not the best way, but I think it's still useful to provide this metric, and it can be implemented in a better way when we get driver-side custom metrics in Spark.
That is a good point. Even so, such a count is still a useful metric, in that it is a measure of amount of work to do, although "number of files" is not the correct name for it. Of course, the actual number of files is a metric we're interested in as well. |
This qualification for the history server would be a really good thing to call out in the docs somewhere if we merge this.
I also think there's value in this. Would it just be better to call it "number of splits read" or something? Provided we can give it a name that clearly delineates what is being measured, I think this has value. Though ideally metrics could be exported from the driver as well (which would need to be added to Spark). |
|
@kbendick thank you for the perspective. As @RussellSpitzer has pointed out, custom task metrics do not appear to be the right mechanism for getting a correct count for number of data files read, or number of delete files applied while reading data files. I think we need to wait for Spark support for driver-side custom metrics to implement those properly. In the meantime, I was thinking of renaming the custom metric that I have here "number of file splits read". I'll update the PR very soon. |
The metric is now "numSplits" and its description (what shows up in the
Spark UI) is "number of file splits read".
Also changed "IcebergScan" to "IcebergBatchScan" in the `description()`
and `toString()` of `SparkBatchQueryScan`.
|
I have updated the PR. I renamed the metric "numSplits" and its description is now "number of file splits read" (this is what appears in the Spark UI). I also changed "IcebergScan" to "IcebergBatchScan" in the |
|
@kbendick do you have any further feedback on this? |
|
I left a bunch of comments here that would also apply to the other PR. I'll do another pass on the custom metric pr for just file splits in a bit, but please take a look at my comments here in the mean time. |
spark/v3.2/spark/src/main/java/org/apache/iceberg/spark/source/SparkBatchQueryScan.java
Outdated
Show resolved
Hide resolved
spark/v3.2/spark/src/main/java/org/apache/iceberg/spark/source/SparkCopyOnWriteScan.java
Outdated
Show resolved
Hide resolved
spark/v3.2/spark/src/main/java/org/apache/iceberg/spark/source/SparkFilesScan.java
Outdated
Show resolved
Hide resolved
spark/v3.2/spark/src/main/java/org/apache/iceberg/spark/source/SparkScan.java
Outdated
Show resolved
Hide resolved
spark/v3.2/spark/src/main/java/org/apache/iceberg/spark/source/SparkScan.java
Outdated
Show resolved
Hide resolved
| } | ||
| } | ||
|
|
||
| static long numFilesToScan(CombinedScanTask scanTask) { |
There was a problem hiding this comment.
Since this is now a one-liner, I have removed the function altogether.
| import java.text.NumberFormat; | ||
| import org.apache.spark.sql.connector.metric.CustomMetric; | ||
|
|
||
| public class NumSplits implements CustomMetric { |
There was a problem hiding this comment.
CustomSumMetric fits this a bit better and you will not need to reimplement the Aggregate
There was a problem hiding this comment.
I explained in #4588 why there is no benefit to extend CustomSumMetric.
|
|
||
| @Override | ||
| public String description() { | ||
| return "number of file splits read"; |
There was a problem hiding this comment.
Start with a Capital leter
There was a problem hiding this comment.
I explained in #4588 that I lowercase "number" to be consistent with the standard metrics shown in the Spark UI.
 RussellSpitzer
left a comment
RussellSpitzer
left a comment
There was a problem hiding this comment.
A few comments, Let's try to remove the changes to the descriptions, although I think those would be good as another PR.
The Metric could extend CustomSumMetric
There are some remaining "file" methods that should read as "split"
And some other minor changes, Looks good though!
|
One other thing, how are we going to test this? I'm not sure of any ways to get to this new metric programmatically but we should definitely investigate that. |
|
@RussellSpitzer thank you for reviewing again! |
Remove changes to description.
|
@RussellSpitzer I have addressed your feedback. I think this one should be ready. |
|
@RussellSpitzer this can go in first, or together with #4588 when that proves satisfactory. Thanks. |
spark/v3.2/spark/src/main/java/org/apache/iceberg/spark/source/SparkScan.java
Outdated
Show resolved
Hide resolved
spark/v3.2/spark/src/main/java/org/apache/iceberg/spark/source/SparkScan.java
Outdated
Show resolved
Hide resolved
|
|
||
| @Override | ||
| public String name() { | ||
| return "numSplits"; |
There was a problem hiding this comment.
Should we say numFileSplits? I'm always worried about how overloaded the term "split" is especially in Spark. I believe you used this in the debug statement above.
There was a problem hiding this comment.
This name is internal. The name in the CustomTaskMetric (in this case TaskNumSplits) needs to match the name in the CustomMetric (in this case NumSplits).
The user facing part is the description in the CustomMetric, in this case "number of file splits read". This appears in the Spark UI.
The debug logging does not use the name. (It uses the value of a numSplits variable.) It would log something like
"Reading 1835 file split(s) for table spark_catalog.tpcds_iceberg.catalog_sales using RowReader".
I had previously changed the numFiles/NumFiles in names to numSplits/NumSplits at your suggestion. Do you really think it is necessary to change all those names again?
RussellSpitzer
left a comment
There was a problem hiding this comment.
One little nit on the name but other than that I think we are good to go! Sorry it took me so long get to this
|
The changes here were part of #4588 which has been merged. Closing. |
…read by a SparkScan apache#4395
Spark 3.2 added support for custom
SQLMetrics which are shown in the Spark UI.Here we add a custom metric for the number of files read by a SparkScan.
Attached are screenshots of the Spark UI for a query after this change.