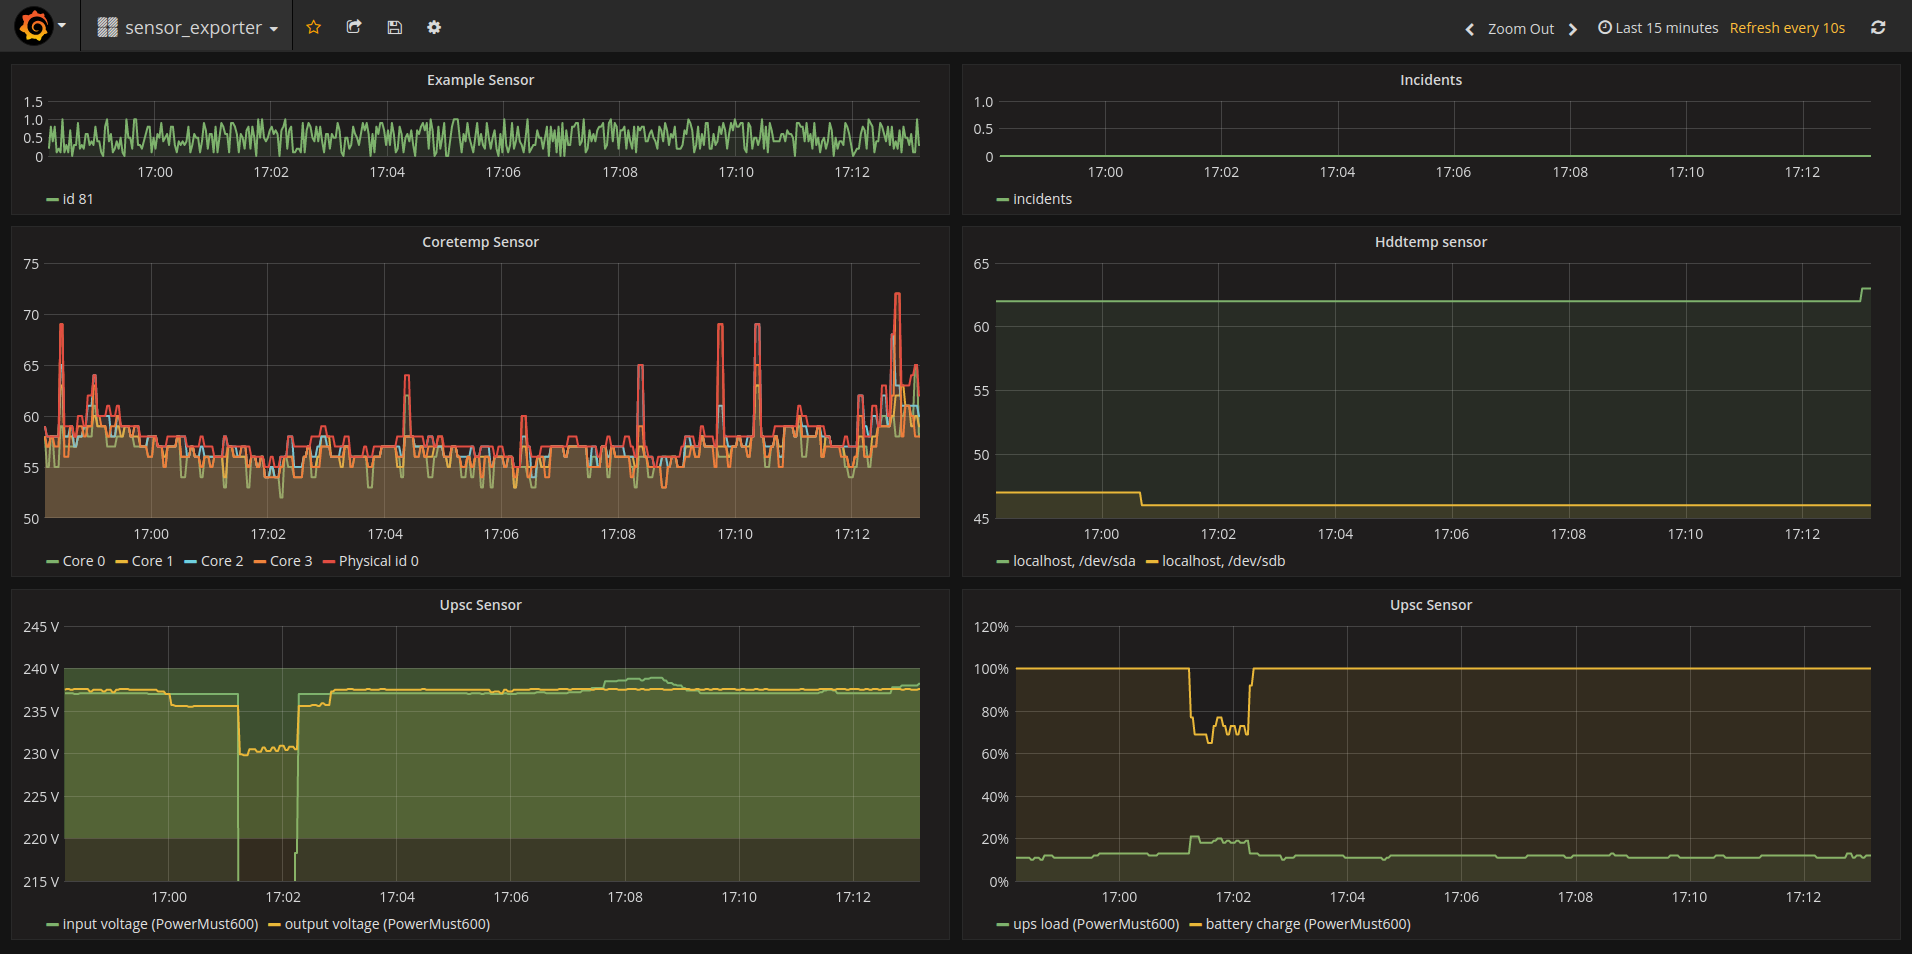
sensor_exporter is a simple sensor exporter for Prometheus.
It is still work in progress.
sensor_exporter currently supports Linux coretemp drivers exposed under
/sys, hddtemp in TCP/IP daemon mode and NUT's upsd daemon. To run with
coretemp and hddtemp:
go get github.com/andmarios/sensor_exporter
sensor_exporter coretemp hddtemp
To list available sensors:
sensor_exporter -list-sensors
To set a sensor you have to specify a string like sensor_name,interval,opts.
If you do not set an interval, the default will be used. If the sensor doesn't
have any opts you can omit them.
Current sensors are log, coretemp, hddtemp, upsc, example.
The log sensors reports a counter of the serious incidents for the current run
of sensor_exporter. If you see this counter increasing by a significant amount,
check your logs. It may be a scrape that takes too long, a server that we can't
connect to, etc.
The coretemp sensor doesn't take any opts.
The hddtemp sensor takes as opts the url to hddtemp daemon. If ommited it will
default to localhost:7634. If the port is ommited, it will default to 7634.
The upsc sensor takes as opts a upsc string (UPSNAME@HOST, UPSNAME —if on
localhost—, UPSNAME@HOST:PORT).
A realistic usage example would be:
sensor_exporter log coretemp hddtemp,,localhost:7634 upsc,,MYUPS@localhost
Which since we use default ports and localhost, could be shortened to:
sensor_exporter log coretemp hddtemp upsc,,MYUPS
You can easily add your own sensor, please have a look at
sensor_example/main.go. Your main task is to create a
Scrape() (string, error) which reads your sensor and returns a
Prometheus compatible formatted string
or an error. An error will lead to sensor_exporter stopping, so if you feel a
failed scrape shouldn't be catastrophic, log it and return an empty string
instead.
I wanted to expose my CPU's temperatures to prometheus and grafana. The basic coretemp reading work existed on my i7tt, so I only needed to convert it for prometheus.
I started with the excellent prometheus' golang_client lib, alas it is targeted for application instrumentation, thus it exposed 37 metrics for the exporter. My metrics were only 3 or 5, so it seemed like a waste to store 40 - 42 metrics just for this.
I started simple, by exposing only the coretemp. Then I added the hddtemp and then thought there are many sensors I would like to expose at some time, thus I build this small framework.
GPLv3 or greater.
