A high-availability prometheus stack for Docker Swarm
As a recommendation, you should only have Prometheus deployed per Docker Swarm Cluster.
Before you start, you need to carefully plan your deployment.
- Consider how many instances you want to deploy.
- Node placement for each instance.
- etc...
You might need to create swarm-scoped overlay network called dockerswarm_monitoring for all the stacks to communicate if you haven't already.
$ docker network create --scope swarm --driver overlay --attachable dockerswarm_monitoringWe provided a base configuration file for Prometheus. You can find it in the config folder.
Please make a copy as configs/prometheus.yml, make sure to change the following values:
# configs/prometheus.yml
global:
  external_labels:
      cluster: demo
      namespace: demo
      __replica__: replica-{{ env "TASK_SLOT"}}

remote_write:
  - url: http://mimir:3200/api/v1/push
    headers:
      "X-Scope-OrgID": demo

alerting:
  alertmanagers:
    # Remote alertmanager
    - url: http://alertmanager:9093
And add any additional configuration you need to configs/prometheus.yml.
This setup uses Docker Metrics API to collect metrics from the Docker daemon.
See https://docs.docker.com/config/daemon/prometheus/ for more information.
Adding a new service to monitor
# docker-compose.yml
services:
  cadvisor:
    image: gcr.io/cadvisor/cadvisor:latest
    # ...
    networks:
      - dockerswarm_monitoring
    deploy:
      labels:
        io.prometheus.enabled: "true"
        io.prometheus.scrape_port: "8080" # optional
        io.prometheus.scrape_scheme: "http" # optional
io.prometheus.metrics_path: "/metrics" # optionalThis stack is designed to be highly available.
You MUST enable remote_write in the configs/prometheus.yml file to make it work.
By default, it will deploy 2 replicas of Prometheus. Having more than 2 replicas is way too much for a small cluster.
If you want to change the number of replicas, you can do so by changing the replicas value in the docker-compose.yml file.

A node.labels.prometheus label is used to determine which nodes the service can be deployed on.
The deployment uses both placement constraints & preferences to ensure that the servers are spread evenly across the Docker Swarm manager nodes and only ALLOW one replica per node.
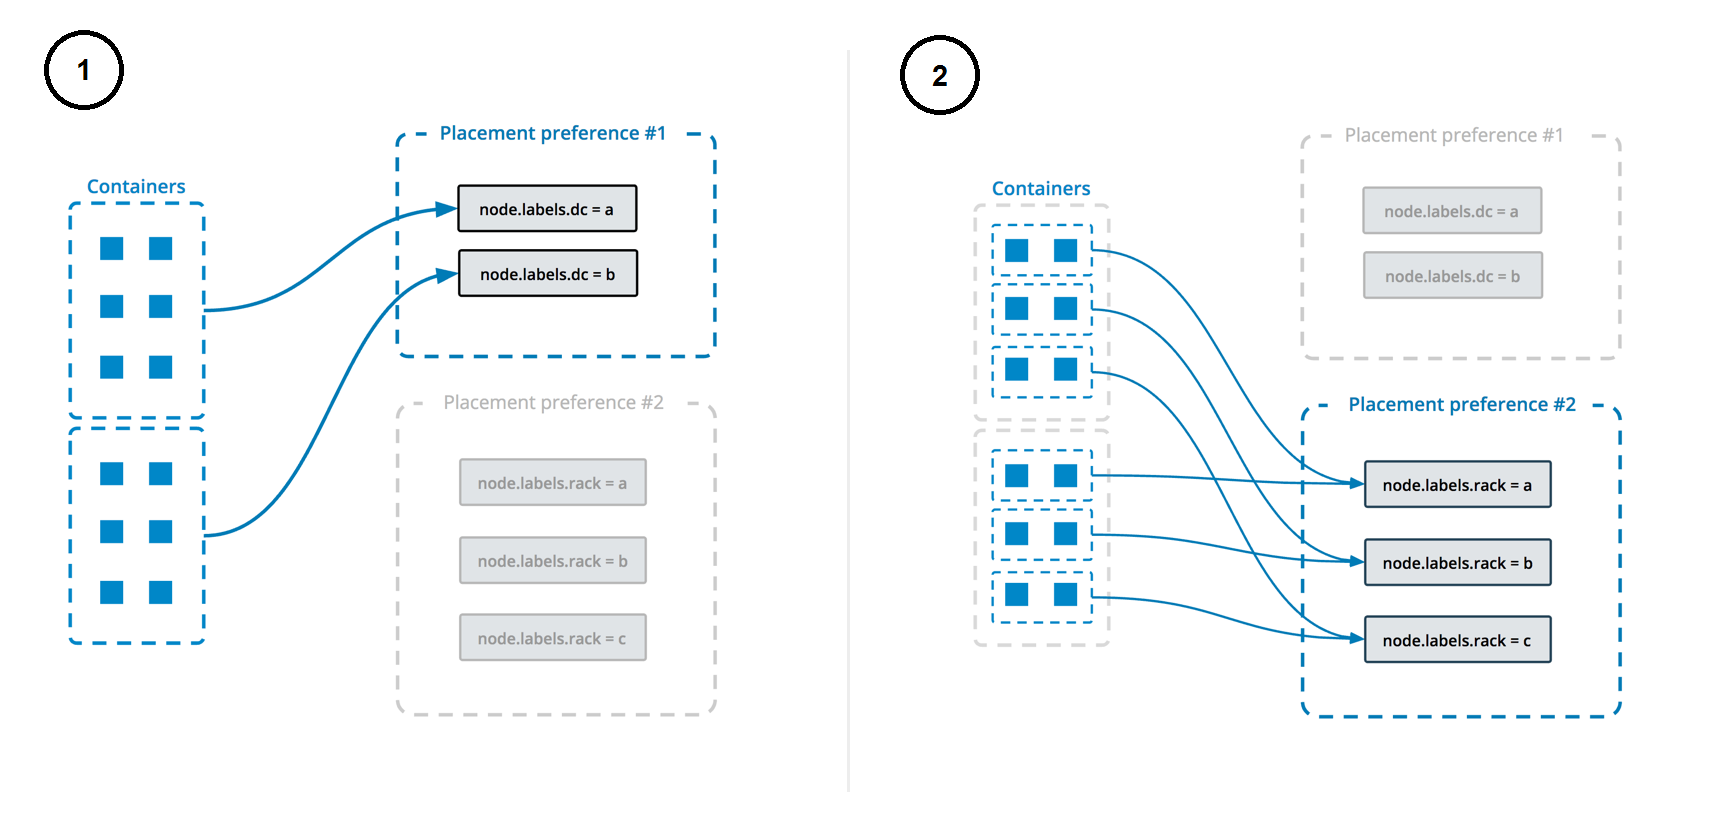
See https://docs.docker.com/engine/swarm/services/#control-service-placement for more information.
On the manager node, run the following command to list the nodes in the cluster.
docker node lsOn the manager node, run the following command to add the label to the node.
Repeat this step for each node you want to deploy the service to. Make sure that the number of node updated matches the number of replicas you want to deploy.
Example deploy service with 2 replicas:
docker node update --label-add prometheus=true <node-1>
docker node update --label-add prometheus=true <node-2>To deploy the stack, run the following command:
$ make deployTo destroy the stack, run the following command:
$ make destroy