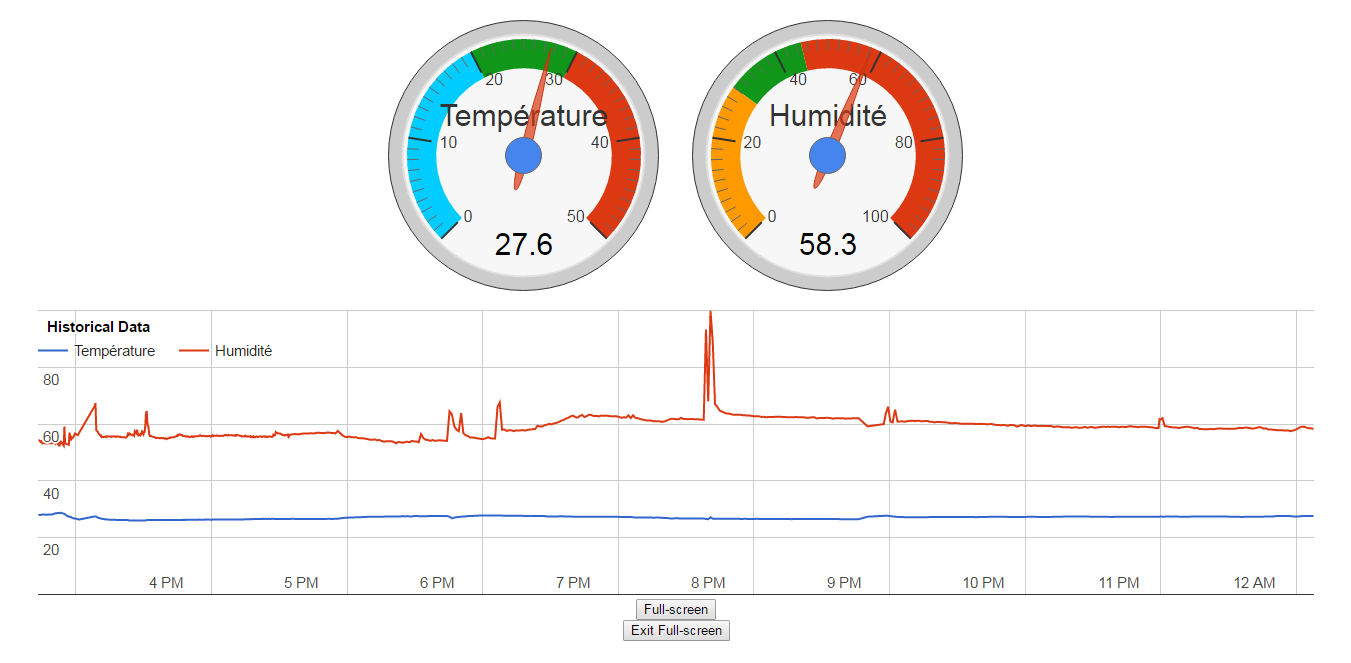
I struggled for a while to log my data to plot.ly by following this tutorial and debugging the hell out of it. I finally succeeded today but now they want me to pay 20$/month to keep using it. After searching for another solution, I found this interesting tutorial. I'm using an ethernet shield so I didn't go at it in the same exact way. And since I already had something that worked, I hacked on from what I had.
There's a lot of cleaning up to do, but here's what I have right now. There was a humidex calculation included, but I didn't realize it was included in the DHT library so it got nuked. I might include it again sometime.
(Links are provided for convenience, that's exactly what I have ordered.)
- Arduino Compatible Uno R3
- Power supply (The arduino description said 7-12V, I ordered a 5V power supply by mistake yet it works perfectly. It can also run straight from USB.)
- Ethernet Shield (Wifi module would work but require some minor mofidications to the sketch)
- DHT22 AM2302 Digital Temperature Humidity Sensor Module
- Latest Arduino software (I used 1.6.11)
- The DHT sensor library
- The index.html from this repository
Spare me some explanations, just plug everything in like they do in this tutorial.
Create a data stream on data.sparkfun.com. Give it a name, a description, make it public or private, and define two fields: "humidity, temp", just like they suggest. The other fields are at your discretion. Now take good note of your public URL, you public key and your private key. You don't want to lose them.
Install the Arduino IDE, clone the DHT library and load up the .ino from this repository. Replace "your_public_key" and "your_private_key" with guess what. Upload the sketch to your Arduino and let it go. It will send data once per minute.
Now open up the index.html file in a text editor and replace "your_public_key" once again. Save the file and open it in your browser. If all went well, it should work!
The arduino sends it sensor data to data.sparkfun.com via a query string once per minute. The index.html contains Javascript and CSS (I know, I should separate them...) that will query your output URL then draw two gauges and a chart from your data. When you query your output URL, you get all the results from the beginning of your recording. The initial example only queried for the first page of results, I somehow made it request for three pages of data and concatenated them together. I made some visual tweaks for it to fit perfecly on my cheap tablet, added full-screen mode and AJAX reload every minute.
If you want to help me clean this up, maybe redo some code here and there. I don't really know Javascript, I guess my code is pretty ugly. Improving the readme so that it can stand on its own would also be a welcome improvement. Feel free to fork the repo and to send me pull requests.
