Get code coverage metrics
This description is only valid for cxx plugin version 1.x
Talking about coverage the most important question is: what coverage your are talking about? There are different kinds of coverage measurement and each tool has a slightly different way doing it and displaying the results. If you are looking for a very good introduction read Code Coverage Analysis on the Bullseye page.
SonarQube API provides the possibility to set the covered lines (setHits) and covered conditions (setConditions). All other metrics are derived from these settings:
- Line coverage: On a given line of code, Line coverage simply answers the following question: Has this line of code been executed during the execution of the unit tests?
- Conditions by line / Covered conditions by line: These are the number of conditions by line and number of covered conditions by line.
- Branch coverage: On each line of code containing some boolean expressions, the branch coverage simply answers the following question: 'Has each boolean expression been evaluated both to true and false?'. This is the density of possible branches in flow control structures that have been followed during unit tests execution.
- Coverage: It is a mix of Line coverage and Branch coverage. Its goal is to provide an even more accurate answer to the following question: How much of the source code has been covered by the unit tests?
For more details and exact calculation see Metric Definitions on the SonarQube page.
To collect C++ test coverage metrics with cxx plugin, you have to:
- Create a coverage report with an external tool (or many of them). For some examples how to use your favorite coverage tracer see Coverage tracers.
- Configure your project to point to the report and rerun the analysis.
Three types of test coverage are supported: Unit test, Integration test and Overall coverage. Use one of the following configuration properties dependent of the coverage type (see also Supported configuration properties for details):
- sonar.cxx.coverage.reportPath for unit test coverage
- sonar.cxx.coverage.itReportPath for integration test coverage (until V0.9.8)
- sonar.cxx.coverage.overallReportPath for overall test coverage (until V0.9.8)
The cxx plugin handles the three coverage types independent from each other and will do no aggregation for e.g. overall test coverage. Your external tool suite is responsible for combining the different coverage reports and providing three reports.
The cxx plugin accepts three different formats for the test coverage reports, which will be recognized automatically:
- Cobertura XML: the format introduced by Cobertura.
- The XML format used by Bullseye.
- The XML format used by Microsoft Visual Studio.
SonarQube V6.7.x will assign zero line coverage to source files without coverage reports, which results in a more realistic overall Technical Debt value.
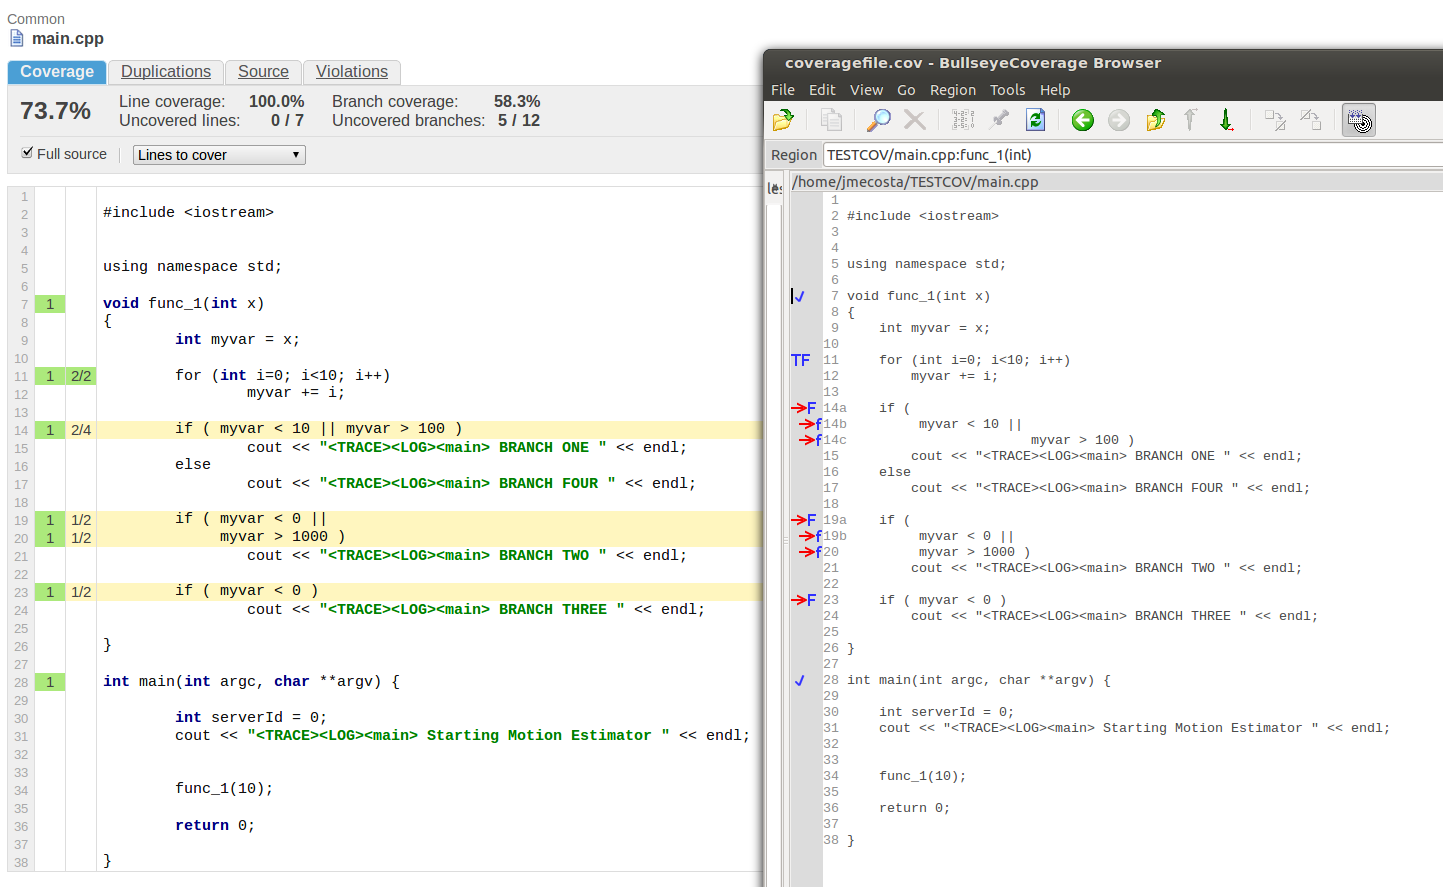
SonarQube <3.2 provides metrics for line coverage and branch coverage. Bullseye users have function and branch/decision coverage instead. The cxx plugin converts the branch/decision coverage directly into branch coverage however line coverage is far more complex and cannot be correlated directly into function coverage.
Line coverage imported from a bullseye report means than function coverage + line branch coverage (this second occurs since SonarQube will not display branch coverage if there isn't a line it associated with it). This means also that overall coverage will be affected in SonarQube and cannot be compared directly to Bullseye results. The following pictures illustrates this for a small example project.
Prerequisites
- Visual Studio Premium or Visual Studio Ultimate 2010 to 2017 Enterprise edition.
- MSDN: Using Code Coverage to Determine How Much Code is being Tested The English version is here.
Visual Studio provides block or line coverage:
- block coverage: A block is a piece of code with exactly one entry and exit point. If the program’s control flow passes through a block during a test run, that block is counted as covered. The number of times the block is used has no effect on the result. The block coverage is only on function level available. Block coverage is not supported by SonarQube.
- line coverage: Counts the number of executed lines of code. A line could be covered (covered="yes"), not covered (covered="no") or partial covered (covered="partial").
Mapping this to the SonarQube model results in:
- Condition coverage within the code is not available.
- SonarQube does not support partial covered lines. Partial covered lines are marked as covered.
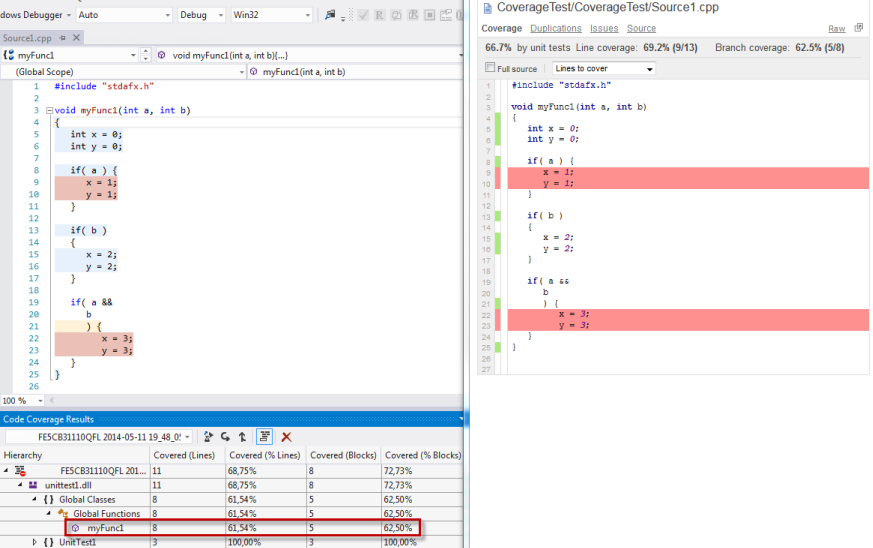
See below an example for coverage results calling with myFunc(0, 1): The partial covered line 21 is marked as covered in SonarQube. This results also in another line coverage:
- Visual Studio: covered [lines] 8; covered [%] 61,54%
- SonarQube: covered [lines] 9; covered [%] 69,2%
Resulting Visual Studio XML coverage file:
<?xml version="1.0" encoding="UTF-8" ?>
<results>
  <modules>
    <module name="unittest1.dll" path="unittest1.dll" id="93AA4138F7AFB24C91DC9614B700B83C07000000" block_coverage="72.73" line_coverage="68.75" blocks_covered="8" blocks_not_covered="3" lines_covered="11" lines_partially_covered="1" lines_not_covered="4">
      <functions>
        <function id="77200" name="myFunc1" type_name="" block_coverage="62.50" line_coverage="61.54" blocks_covered="5" blocks_not_covered="3" lines_covered="8" lines_partially_covered="1" lines_not_covered="4">
          <ranges>
            <range source_id="0" covered="yes" start_line="4" start_column="0" end_line="4" end_column="0" />
            <range source_id="0" covered="yes" start_line="5" start_column="0" end_line="5" end_column="0" />
            <range source_id="0" covered="yes" start_line="6" start_column="0" end_line="6" end_column="0" />
            <range source_id="0" covered="yes" start_line="8" start_column="0" end_line="8" end_column="0" />
            <range source_id="0" covered="no" start_line="9" start_column="0" end_line="9" end_column="0" />
            <range source_id="0" covered="no" start_line="10" start_column="0" end_line="10" end_column="0" />
            <range source_id="0" covered="yes" start_line="13" start_column="0" end_line="13" end_column="0" />
            <range source_id="0" covered="yes" start_line="15" start_column="0" end_line="15" end_column="0" />
            <range source_id="0" covered="yes" start_line="16" start_column="0" end_line="16" end_column="0" />
            <range source_id="0" covered="partial" start_line="21" start_column="0" end_line="21" end_column="0" />
            <range source_id="0" covered="no" start_line="22" start_column="0" end_line="22" end_column="0" />
            <range source_id="0" covered="no" start_line="23" start_column="0" end_line="23" end_column="0" />
            <range source_id="0" covered="yes" start_line="25" start_column="0" end_line="25" end_column="0" />
          </ranges>
        </function>
      </functions>
      <source_files>
        <source_file id="0" path="x:\coveragetest\source1.cpp" checksum_type="MD5" checksum="8A4EC27BE0FE2BCE77401F836581836D">
        </source_file>
      </source_files>
    </module>
  </modules>
</results>- Testwell CTC++ Version 7.2 and later.
- only textural reports are supported
Suppose we have the following source files that form a complete program: prime.c io.c calc.c. This program can be compiled and linked in many ways, one way being the following
cl –Feprime.exe prime.c io.c calc.c
or
gcc -o prime prime.c io.c calc.c
which results in the prime.exe / prime program.
Now, we wish to apply CTC++ on our program, that is, we want to measure the files prime.c, io.c and calc.c and find out how thoroughly they were exercised in our test runs. First we need to instrument the files we wish to measure. Assume we wish to measure multicondition coverage. This can be done as follows:
ctc -i m cl –Feprime.exe prime.c io.c calc.c
or
ctc -i m gcc -o prime prime.c io.c calc.c
As a result we get the instrumented prime.exe program. Here 'ctc' is the CTC++ Preprocessor utility, which makes the instrumentation on the given C and C++ source files and drives compiling/linking of the new instrumented target. The '-i m' command-line options to ctc mean "instrument for multicondition".
When ctc instruments source files, it maintains descriptions what the files contain (what interesting code there is to ctc, on what lines, etc.). This file is called symbolfile, and when it is not specified (like here) it will be MON.sym in current directory.
All right, now prime.exe is the instrumented version of the program. Let's do one test run.
After this test run we notice that the file MON.dat has born in the current directory (same directory as the symbolfile MON.sym was created to). It is a datafile, containing the collected execution counters when the code in the instrumented files was executed.
Now we wish to see the results of our test, i.e. what parts of the program the above run has executed. We use the CTC++ Postprocessor utility as follows:
ctcpost MON.sym MON.dat -p profile.txt
What we are asking here is that ctcpost takes the symbolfile MON.sym and the datafile MON.dat as input and produces an Execution Profile Listing to the file profile.txt.
To get the results of our test to SonarQube we add the following line to configuration file sonar-project.properties:
sonar.cxx.coverage.reportPath=profile.txt