fix(release): raise model timeouts and shrink batch size for slow networks - #8007
Conversation


…works

The AI release-notes generator timed out on every batch in the v0.21.1
finalize run on a GitHub-hosted runner (US, Azure westus3) hitting a
remote LLM endpoint. The 60s per-request timeout was too close to the
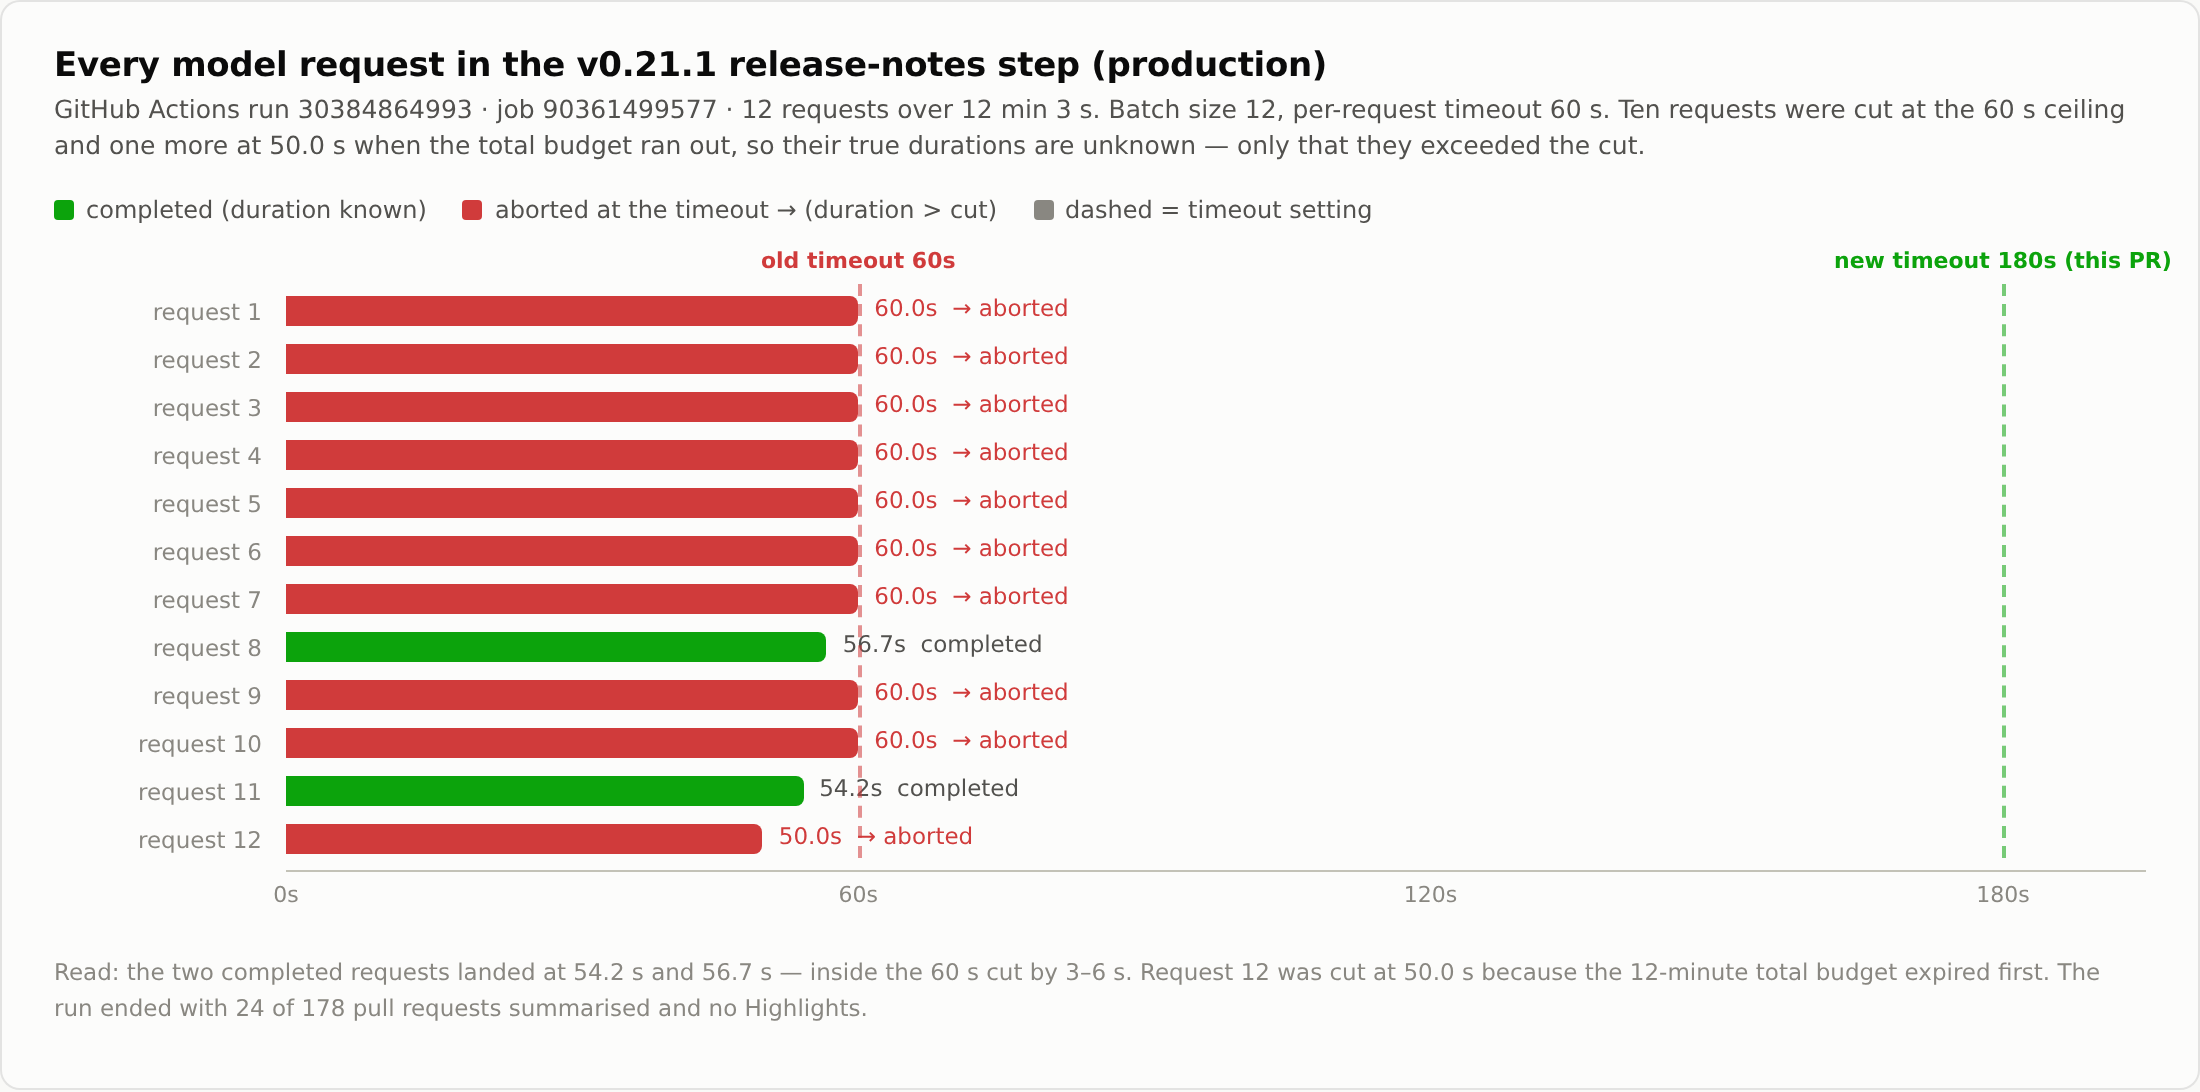
edge: two successful requests took 54.2s and 56.7s, and every other
batch hit the 60s abort. The 12-minute total budget was consumed by
retries on those timeouts, and the circuit breaker opened after 3
consecutive failures, skipping highlights entirely.

- timeoutMs: 60s -> 180s — give the model enough headroom to generate
  a full JSON response over a high-RTT cross-region connection.
- totalTimeoutMs: 12min -> 30min — ~140 PRs at 8 per batch is ~18
  batches; at ~90s each that's ~27 minutes of model time.
- batchSize: 12 -> 8 — fewer entries per prompt means the model
  generates less per request, returning faster and reducing the
  chance of a single slow request dragging the whole batch.
- workflow timeout-minutes: 15 -> 35 — match the new 30min budget
  plus a margin for git/npm setup.

No changes to retry logic, circuit breaker, or prompt shape.

|
|
|
Thanks for the PR! Template: the headings differ slightly from the template ( Problem: observed bug with concrete evidence. The v0.21.1 finalize run (30384864993) shows successful requests at 54–57s hitting the 60s abort, the circuit breaker tripping after 3 consecutive failures, and highlights being skipped entirely. Before/after logs are in the PR body. This is real, not theoretical. Direction: aligned. This is the follow-up to #7941 (payload slimming), addressing the timeout parameters that PR intentionally left for the next stable release to confirm. v0.21.1 was that confirmation. Release infrastructure reliability is squarely in scope. Size: not applicable — no core paths touched ( Approach: minimal and well-justified. Four parameter changes, each with a clear rationale tied to the observed data. No scope creep, no unrelated edits. The math checks out: ~140 PRs / 8 per batch ≈ 18 batches × ~90s ≈ 27 min, fitting the 30-min budget; 180s per-request timeout gives 3× headroom over the observed 55s successes. Risk: no elevated risk signals. Moving on to code review. 🔍 中文说明感谢贡献! 模板:标题与模板略有不同( 问题:已观测到的 bug,有具体证据。v0.21.1 finalize 运行(30384864993)显示成功请求在 54–57s,触发了 60s 超时中断,熔断器在 3 次连续失败后触发,Highlights 被完全跳过。PR 正文附有 before/after 日志。这是真实问题,不是理论性的。 方向:对齐。这是 #7941(payload 精简)的后续,解决该 PR 有意留给下一个稳定版确认的超时参数。v0.21.1 就是那个确认。发布基础设施的可靠性完全在范围内。 规模:不适用——未触及核心路径(仅 方案:最小化且有充分理由。四个参数变更,每个都有与观测数据对应的清晰理由。无范围蔓延,无无关改动。数学验证通过:~140 PR / 每批 8 ≈ 18 批 × ~90s ≈ 27 分钟,在 30 分钟预算内;180s 单请求超时给观测到的 55s 成功请求留了 3 倍余量。 风险:无升级风险信号。 进入代码审查 🔍 — Qwen Code · qwen3.8-max-preview Reviewed at |
|
Code review — independent proposal first: given 54–57s successful requests hitting a 60s timeout, I'd raise the per-request timeout to ~3× the observed success time, increase the total budget to fit the full batch count, reduce batch size to lower per-request generation time, and bump the workflow timeout to match. That's exactly what this PR does. The diff is four default-value changes across two files. Verified in context:
No correctness issues, no security concerns, no convention violations. The tests in No findings. CI test evidence — fetched check-runs for the reviewed commit. The Ubuntu unit test suite is still in progress; macOS and Windows tests were skipped (likely path-filtered). No failures so far. Final CI results for
One row per check name (latest run); skipped checks omitted; failures sort first. / 每个检查名一行(取最新一次运行),省略 skipped,失败项排在最前。 Not verified: the actual release-notes generation with the new timeouts — this can only be tested on the next stable release finalize run, as the PR notes. The parameter changes are straightforward and the math is sound. 中文说明代码审查——先独立提出方案:鉴于成功请求在 54–57s 却触发 60s 超时,我会将单请求超时提高到观测成功时间的约 3 倍,增加总预算以适配完整批次数,减小批次大小以降低单请求生成时间,并调高工作流超时以匹配。这正是本 PR 所做的。 diff 是两个文件中的四个默认值变更。已在上下文中验证:
无正确性问题,无安全隐患,无规范违反。 无发现。 CI 测试证据——已获取被审查提交 check-runs。Ubuntu 单元测试套件仍在进行中;macOS 和 Windows 测试被跳过(可能是路径过滤)。目前无失败。 未验证:使用新超时的实际 release-notes 生成——只能在下一个稳定版 finalize 运行时测试,如 PR 所述。参数变更简单明了,数学计算合理。 — Qwen Code · qwen3.8-max-preview Reviewed at |
|
Confidence: 5/5 — clean, minimal parameter fix with concrete evidence from the v0.21.1 failure; would merge without hesitation. This is exactly the kind of PR that's easy to review and easy to maintain. Four numbers changed, each justified by observed data, no structural changes, no new code paths. The before/after from the v0.21.1 finalize run makes the problem undeniable, and the math for the new values is straightforward. If I had to maintain this in six months, I'd thank the author — the defaults are self-documenting with the PR's rationale. My independent proposal matched the PR's approach exactly. Nothing to cut, nothing missing. Approval deferred until CI lands green on 中文说明置信度:5/5 — 干净、最小化的参数修复,有 v0.21.1 失败的具体证据;毫不犹豫即可合并。 这正是那种容易审查、容易维护的 PR。改了四个数字,每个都有观测数据支撑,无结构变更,无新代码路径。v0.21.1 finalize 运行的 before/after 使问题不可否认,新值的数学计算简单明了。如果六个月后需要维护这个,我会感谢作者——默认值配合 PR 的理由是自文档化的。 我的独立方案与 PR 的方法完全一致。没有可砍的,也没有遗漏的。 审批推迟到 CI 在 — Qwen Code · qwen3.8-max-preview Reviewed at |

Code Coverage Summary
CLI Package - Full Text ReportCore Package - Full Text ReportFor detailed HTML reports, please see the 'coverage-reports-22.x-ubuntu-latest' artifact from the main CI run. |

 qwen-code-ci-bot
left a comment
qwen-code-ci-bot
left a comment
qwen-code-ci-bot
left a comment
There was a problem hiding this comment.
Not linted (tool limitation, not a blocker): the executable-script lint — .github/workflows/finalize-release.yml: actionlint embedded-shell source mapping is not yet supported — not linted.
— qwen3.8-max-preview via Qwen Code /review
qwen-code-ci-bot
left a comment
qwen-code-ci-bot
left a comment
There was a problem hiding this comment.
No issues found. LGTM! ✅
— qwen3.8-max-preview via Qwen Code /review

Local verification — replaying the v0.21.1 failure on a real clockVerdict: ship it. I rebuilt the failed v0.21.1 release-notes run locally against the unmodified script and the same 178 pull requests, then ran a 2×2 isolation of the parameter changes plus two stress arms. The PR's defaults fix the failure; the timeout pair is the part that does the work. Three non-blocking notes at the end. 1. Production ground truthI pulled the raw job log for the v0.21.1 finalize run (run 30384864993, job 90361499577) rather than working from the description:
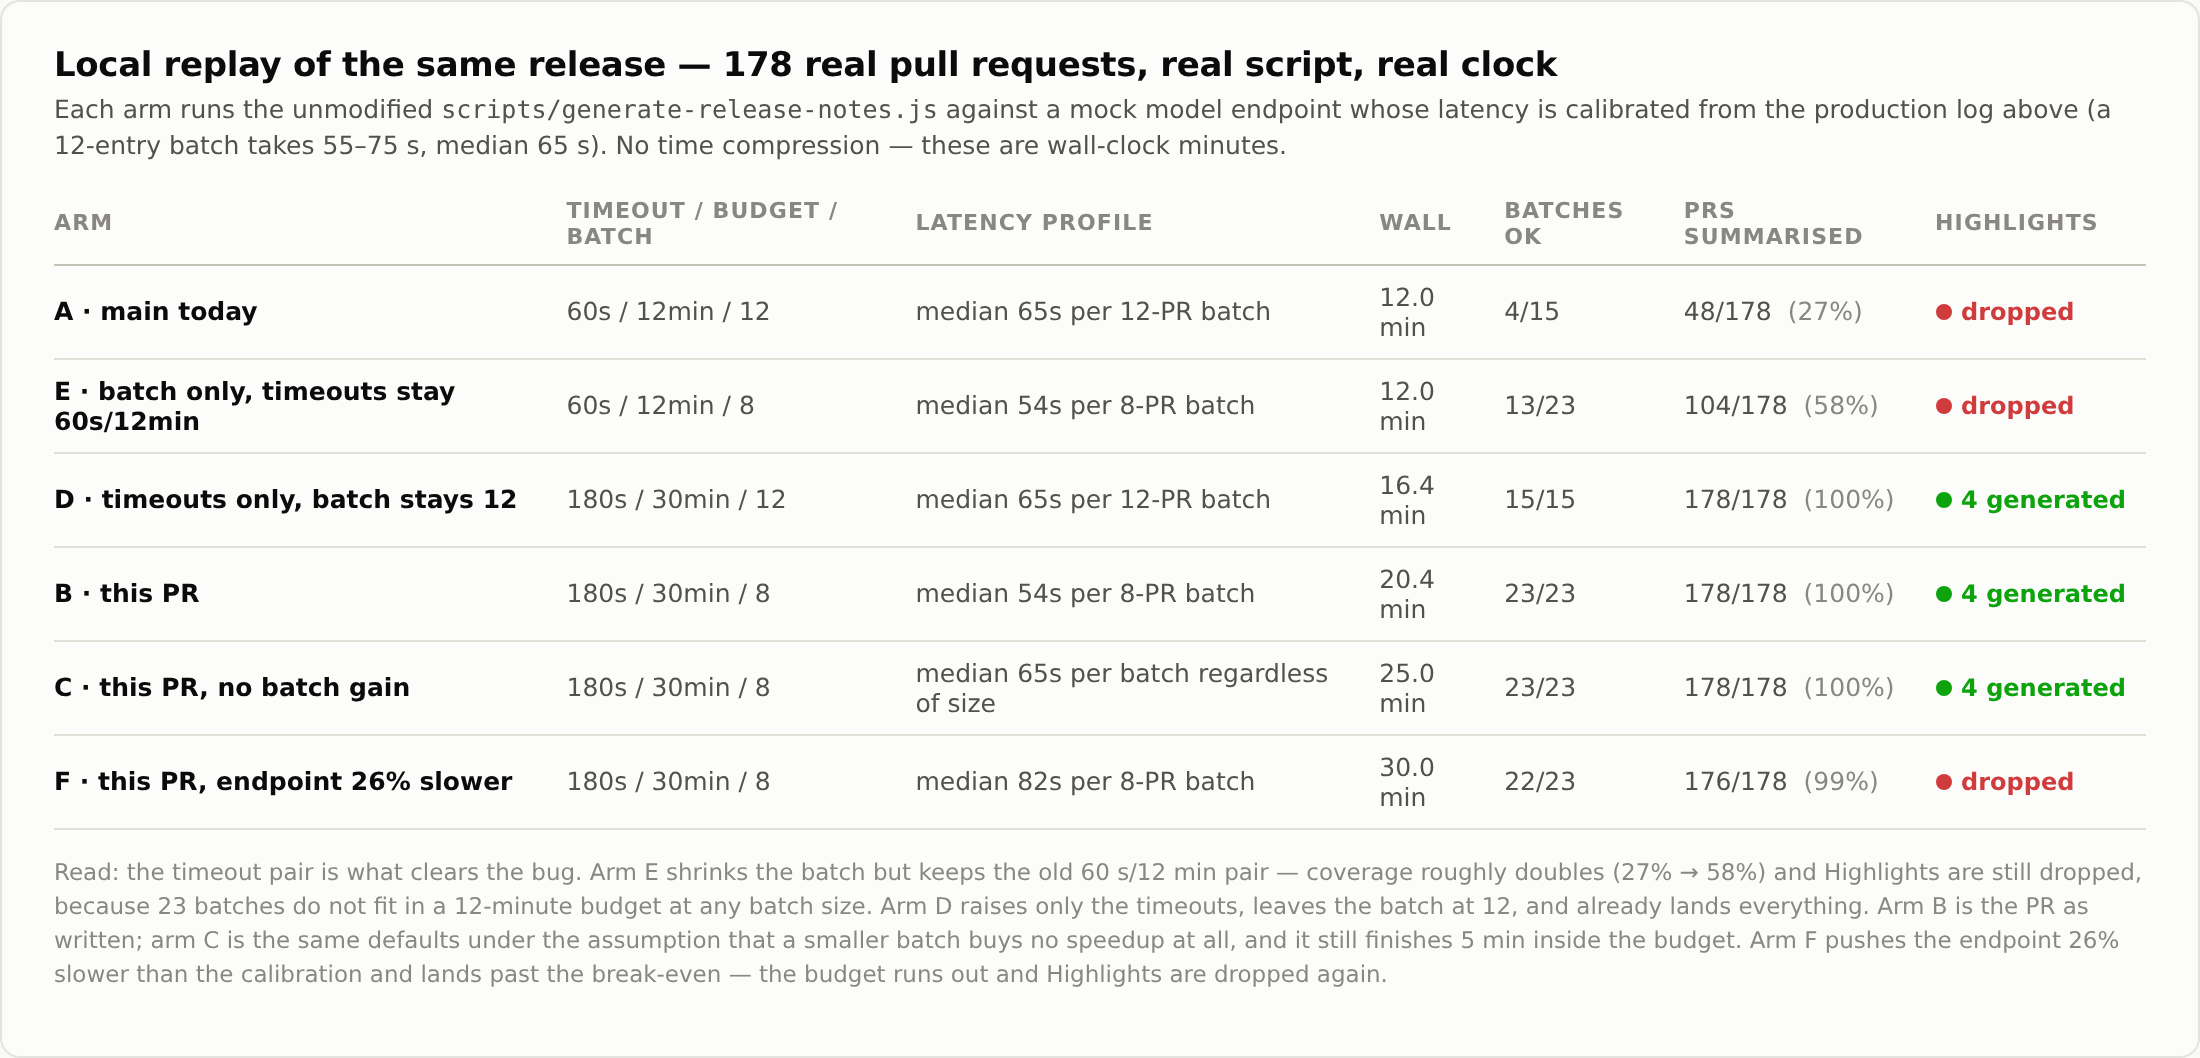
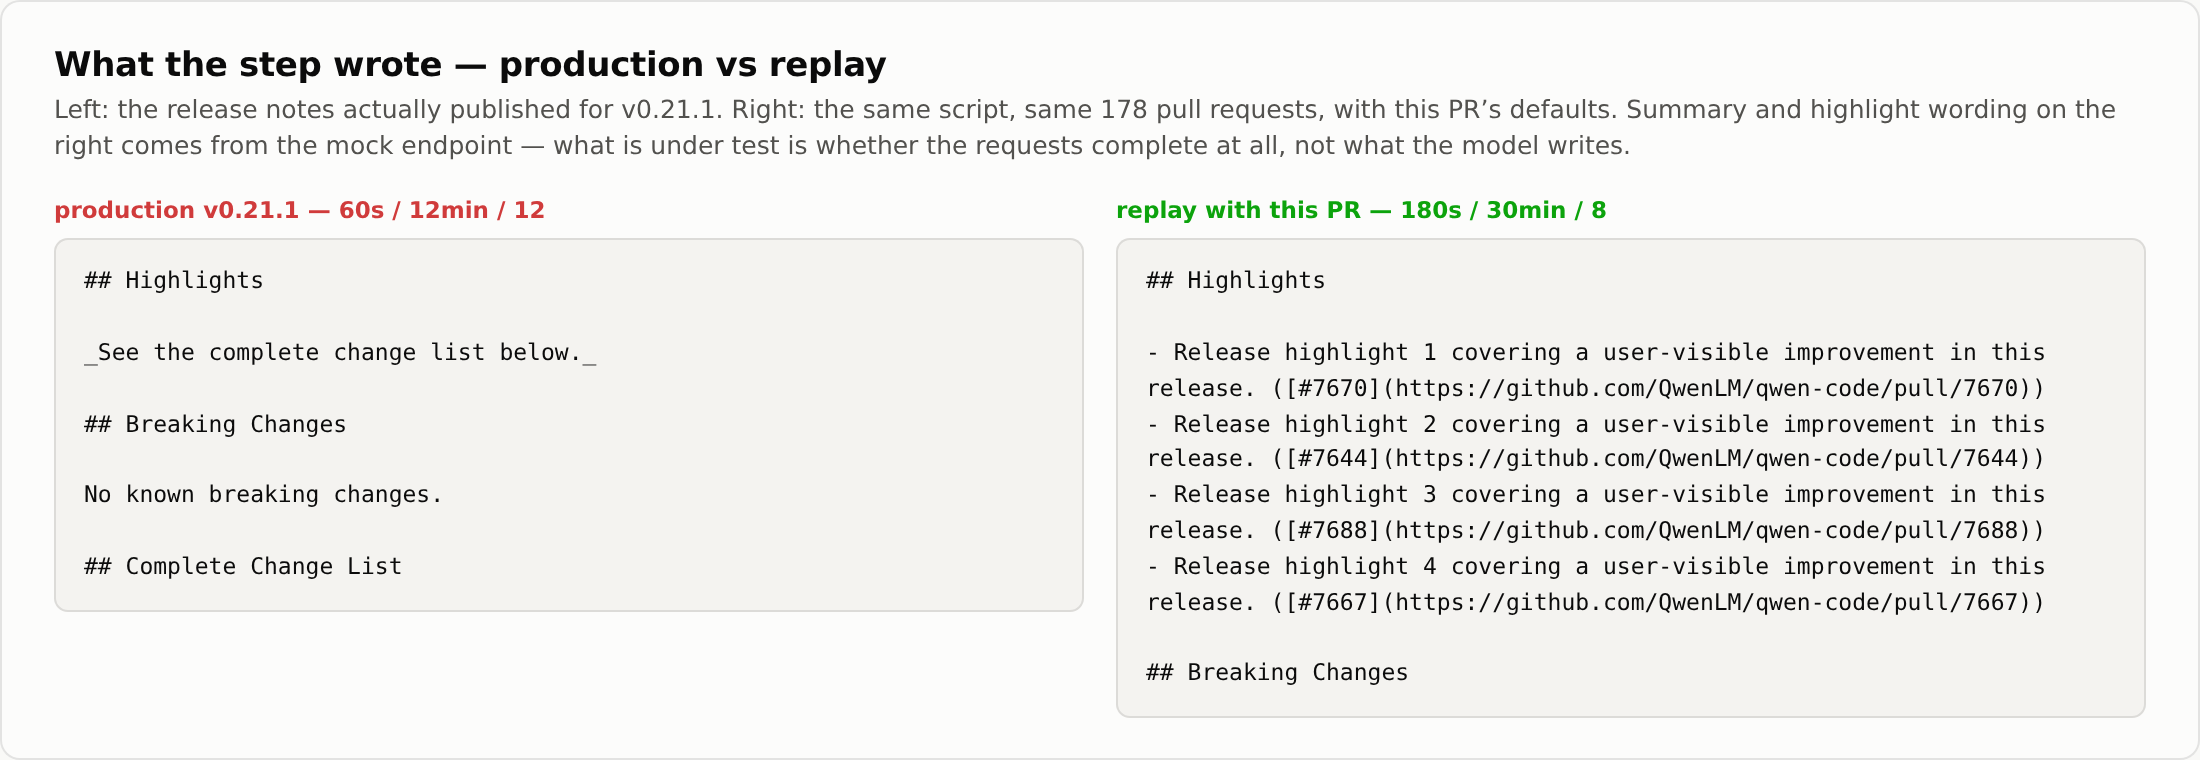
Two things follow. The diagnosis in the PR body is exactly right — roughly one request in six landed inside the 60 s cut, and the two that did had 3–6 s of margin. And 2. Replay: real script, real 178 pull requests, real wall clockHarness: a Fidelity checks: production logged
3. Which of the four changes actually fixes it
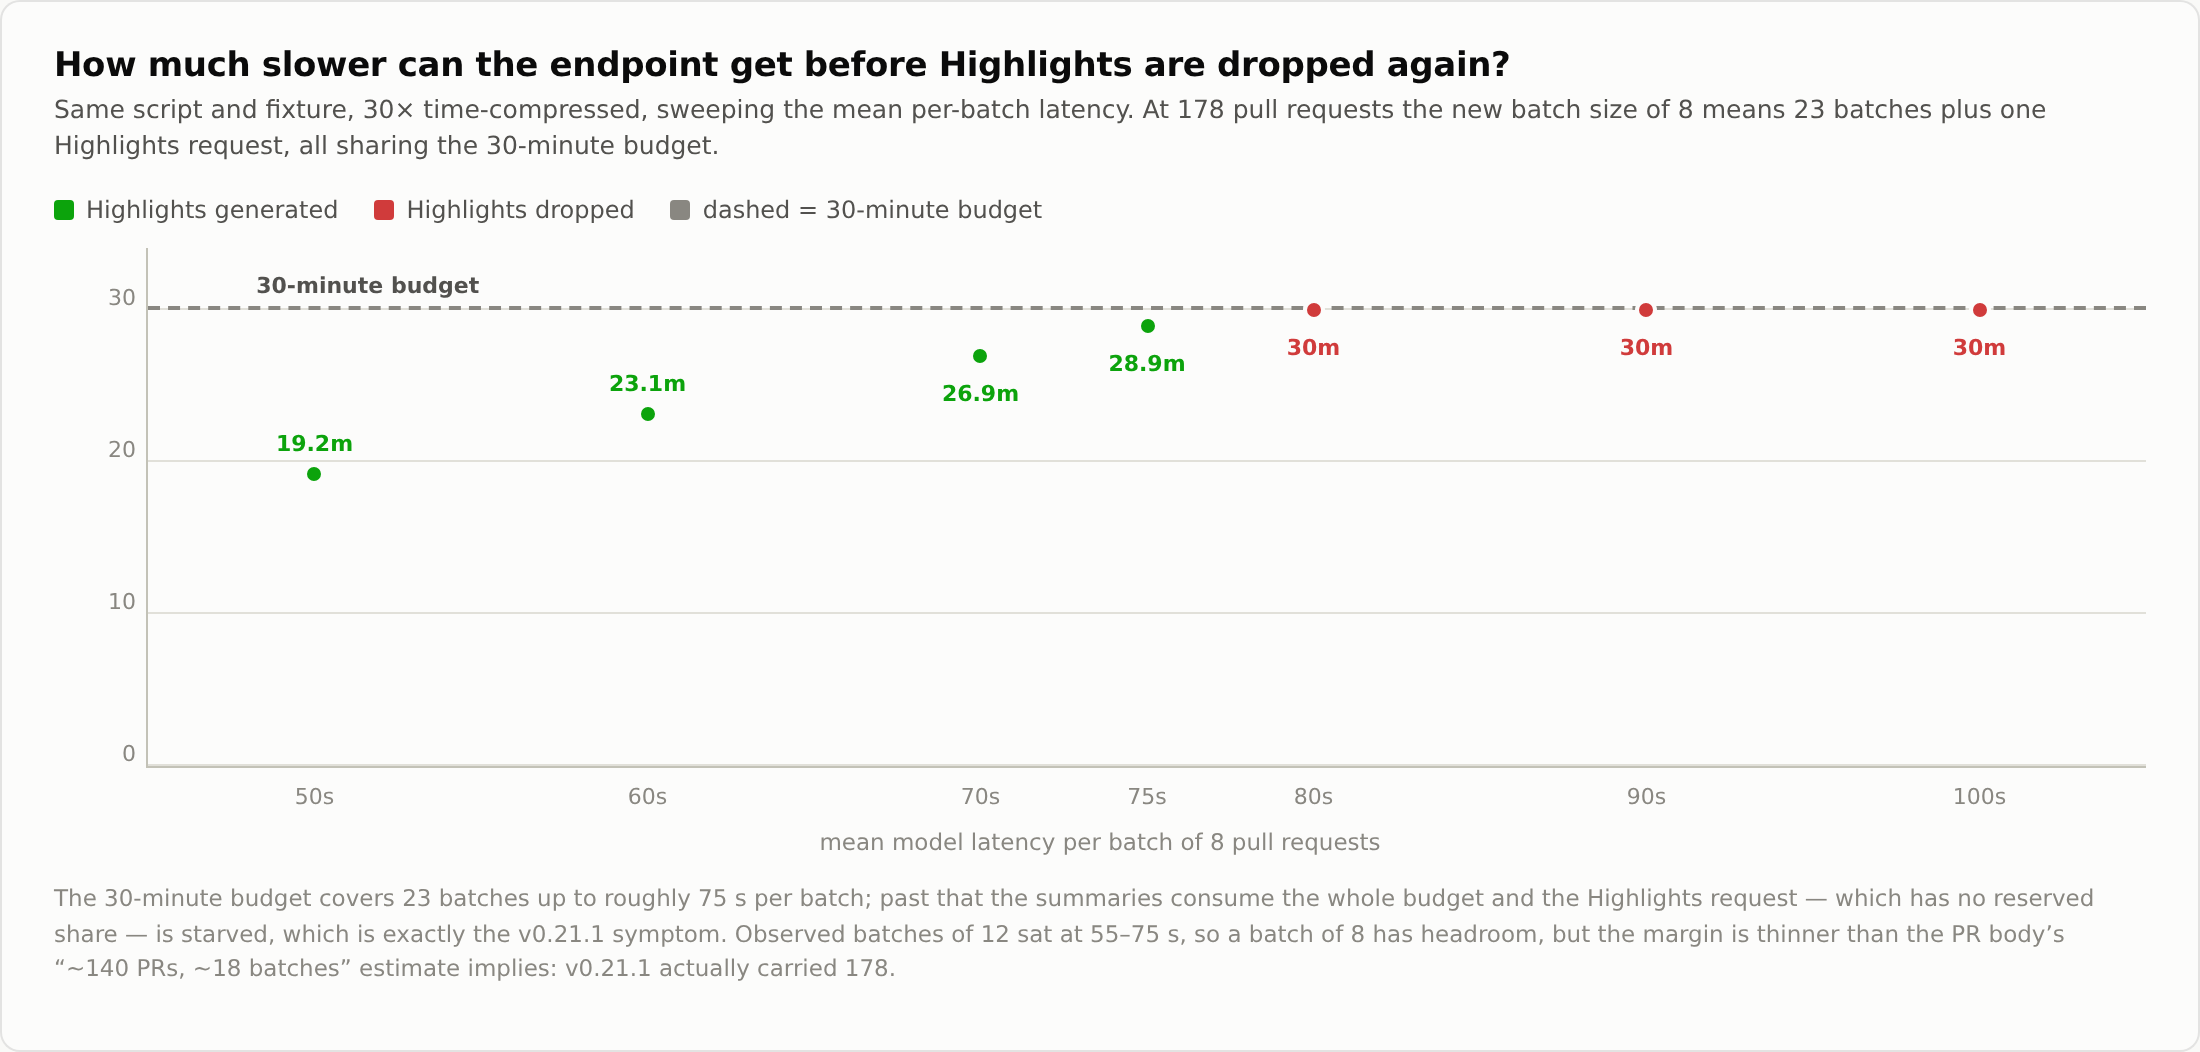
Shrinking the batch on its own roughly doubles coverage but does not fix the bug: 23 batches do not fit in a 12-minute budget at any batch size. Raising the timeouts on its own does fix it, with the batch left at 12. So It is also not free. Compare D and B: same timeouts, and the smaller batch takes 24% longer (16.4 → 20.4 min), because whatever fixed cost each request carries is now paid 23 times instead of 15. Under the no-gain assumption (arm C) it is 41% longer. That is a reasonable trade — every request gets a much larger margin against its own timeout — but it is what consumes the new budget, and it is why the notes below matter. 4. Where the new budget runs outSame script and fixture, 30× time-compressed, sweeping the mean per-batch latency at the real release size:
Break-even is between 75 s and 80 s per batch of 8. Below it everything completes; at 80 s all 178 summaries still land but the Highlights request — which has no reserved share of the budget — is starved, which is precisely the v0.21.1 symptom. At 90 s, 18 PRs also lose their summaries. Arm F is the real-clock confirmation: at 82 s per batch it ran the full 30.0 min, summarised 176 of 178, and dropped Highlights. Arm C is the reassuring side of the same coin — even assuming the smaller batch buys no speedup whatsoever, the PR's defaults finish in 25.0 min with Highlights intact. 5. Tests, CI, lint
6. Three notes — none of them blockinga. The capacity math is based on ~140 PRs; v0.21.1 actually carried 178. That is 23 batches at the new batch size, not 18, so the budget works out to ~78 s per batch (~75 s once you leave room for the Highlights request) rather than the ~100 s the PR body's arithmetic implies — right against the break-even measured above. The last eight stable releases parsed to 24 / 86 / 89 / 107 / 116 / 122 / 135 / 183 entries, trending up, so 178 is a floor for planning rather than a ceiling. It still fits, and arm C shows it fits even in the pessimistic latency model — but the margin is thinner than the description suggests. Worth updating the PR body so the next person tuning these numbers starts from 23 batches. b. Time-to-give-up on a dead endpoint nearly triples. With an endpoint that accepts connections and never answers, the circuit breaker now needs 3 × (3 × 180 s + backoff) to open — 27.2 min measured, versus 9.3 min today. It stays bounded by the 30-minute budget and the 35-minute step timeout, and the step is c. Nothing ties the 30-minute budget to How the replay was built
Arms A, B, C and F run unmodified worktree files, so the defaults under test are the real ones. Arms D and E are copies of the base script with only the isolated parameter edited. 中文版本地验证 —— 用真实时钟重放 v0.21.1 的失败结论:可以合并。 我在本地用未经修改的脚本和同样的 178 个 PR 重建了失败的 v0.21.1 release-notes 运行,并对参数改动做了 2×2 隔离实验,另加两组压力测试。PR 的新默认值确实修复了该失败,其中起决定作用的是超时这一对参数。文末有三条不阻塞的备注。 1. 生产环境的事实依据我没有直接采信 PR 描述,而是拉取了 v0.21.1 finalize 运行(run 30384864993,job 90361499577)的原始日志:
由此可得两点。PR 正文的判断完全正确:大约每 6 次请求只有 1 次落在 60 秒以内,而成功的那两次也只剩 3–6 秒余量。另外 2. 重放:真实脚本、真实的 178 个 PR、真实墙钟测试装置:一个 保真度校验:生产日志中 12 条一批的 prompt 为 3. 四项改动中真正起作用的是哪一项
只缩小批次大小可以把覆盖率大致翻倍,但修不好这个 bug:23 个批次在 12 分钟预算内无论批次多大都放不下。只提高超时则可以修好,即使批次仍为 12。所以 它也不是免费的。对比 D 与 B:超时相同,批次变小后总耗时多了 24%(16.4 → 20.4 分钟),因为每次请求的固定开销现在要付 23 次而不是 15 次。在「缩小批次完全不带来提速」的假设下(C 组)则多 41%。这个取舍是合理的 —— 每次请求相对自身超时的余量大了很多 —— 但正是它消耗掉了新预算,也是下面几条备注的由来。 4. 新预算的临界点在哪里同样的脚本和 fixture,30 倍时间压缩,在真实发布规模下扫描每批次的平均延迟: 临界点在每批 8 条 75 秒到 80 秒之间。低于该值一切正常;到 80 秒时 178 条摘要仍能全部生成,但 Highlights 请求 —— 它在预算中没有预留份额 —— 会被饿死,这正是 v0.21.1 的症状。到 90 秒时还会有 18 个 PR 丢掉摘要。 F 组是这一结论的真实时钟验证:每批 82 秒时它跑满 30.0 分钟,178 个 PR 中完成了 176 个摘要,Highlights 被丢弃。C 组则是同一枚硬币令人安心的另一面:即使假设缩小批次完全不带来任何提速,本 PR 的默认值仍能在 25.0 分钟内完成并保住 Highlights。 5. 测试、CI、lint
6. 三条备注 —— 均不阻塞合并a. 容量估算基于 ~140 个 PR,而 v0.21.1 实际是 178 个。 按新的批次大小是 23 批而非 18 批,因此每批预算约 78 秒(给 Highlights 请求留出余地后约 75 秒),而不是 PR 正文算术隐含的约 100 秒 —— 正好贴着上面实测的临界点。最近 8 个稳定版解析出的条目数分别是 24 / 86 / 89 / 107 / 116 / 122 / 135 / 183,且呈上升趋势,所以 178 应当作为规划下限而非上限。它仍然放得下,C 组也证明了在悲观延迟模型下同样放得下 —— 但余量比描述给人的印象要薄。建议更新 PR 正文,让下一个调这些数字的人从 23 批起步。 b. 端点彻底不可用时的放弃耗时接近三倍。 如果端点接受连接但永不响应,熔断器现在需要 3 × (3 × 180 秒 + 退避) 才会打开 —— 实测 27.2 分钟,而当前是 9.3 分钟。它仍受 30 分钟预算和 35 分钟步骤超时约束,且该步骤是 c. 没有任何东西把 30 分钟预算和 |

 doudouOUC
left a comment
doudouOUC
left a comment
doudouOUC
left a comment
There was a problem hiding this comment.
No issues found. LGTM! ✅
— qwen3.7-max via Qwen Code /review
The workflow `timeout-minutes` and the script's `totalTimeoutMs` are
defined in separate files with no shared constant.  If they drift apart
silently and the budget exceeds the step timeout, the runner SIGKILLs
the step and even the fallback release notes are lost.

Add a cross-file assertion so any future change to either value that
breaks the invariant fails the test immediately.

Suggested-by: wenshao in PR review.

9026438
ReviewOverview — Four tuning changes to the AI release-notes path: per-request The direction is right and the diagnosis is well-supported. I pulled the raw job logs to check, and the evidence is actually stronger than the description says — the highlights request has timed out in three consecutive finalize runs, not just v0.21.1:
I verified the tuning by driving the real 1. The new test assertion has no teeth (blocking)releaseNotesScript.match(/totalTimeoutMs\s*=\s*([\d_]+)/)[1]The source is Mutation-tested on your branch: set Regex-parsing a JS expression out of source is the fragile part; export the constant instead and the check becomes real: // scripts/generate-release-notes.js
export const MODEL_TOTAL_TIMEOUT_MS = 30 * 60_000;
export function createOpenAiCompleter({ …, totalTimeoutMs = MODEL_TOTAL_TIMEOUT_MS }) { … }
// test
import { MODEL_TOTAL_TIMEOUT_MS } from '../generate-release-notes.js';
expect(stepTimeoutMin * 60_000).toBeGreaterThan(MODEL_TOTAL_TIMEOUT_MS);Verified: passes as-is, and fails with 2. Highlights still has no reserved budget — and this PR's own arithmetic starves it
Sweeping average successful-batch latency (PR config, 8/180s/30min): The threshold is ~75s/batch. The PR description estimates ~78s per batch ("observed median 65s + jitter margin"). At that number the run produces all 178 summaries and
const effectiveDeadline =
  request.kind === 'highlights' ? deadline : deadline - highlightsReserveMs;
Prototyped with a 3-min reserve: highlights survives up to 80s/batch instead of 74s, with no loss of summaries. 3. Budget exhaustion trips the "model side is down" circuit breaker, which then skips highlights by designif (consecutiveBatchFailures >= maxConsecutiveBatchFailures) {
// The model side is down, not slow: stop paying per remaining batch
So the model side was slow, exactly what the comment says the breaker is not for. Consequence: once summaries run out of budget, highlights is guaranteed empty no matter how large the reserve in (2) is — I reproduced this at 90s/batch even with the reserve applied. Worth not counting deadline-exhaustion toward 4. Worst-case runner burn roughly triplesA fully-failing batch now costs Same (zero-value) outcome, 3× the billable runner time, and only ~7.5 min of headroom under the new 35-min step timeout. Consider 5. Smaller notes
Verification performed
Net: worth merging for the timeout raise. §1 should be fixed before merge (the test currently asserts nothing). §2/§3 are the difference between "fixes v0.21.1" and "fixes empty Highlights", and can be a follow-up if you'd rather land the tuning now. |
qwen-code-ci-bot
left a comment
qwen-code-ci-bot
left a comment
There was a problem hiding this comment.
Reviewed — no blockers. Suggestions are inline. Not linted (tool limitation, not a blocker): the executable-script lint — .github/workflows/finalize-release.yml: actionlint embedded-shell source mapping is not yet supported — not linted.
— qwen3.8-max-preview via Qwen Code /review
qwen-code-ci-bot
left a comment
qwen-code-ci-bot
left a comment
There was a problem hiding this comment.
No issues found. LGTM! ✅
Not linted (tool limitation, not a blocker): the executable-script lint — .github/workflows/finalize-release.yml: actionlint embedded-shell source mapping is not yet supported — not linted.
— qwen3.8-max-preview via Qwen Code /review


doudouOUC
left a comment
doudouOUC
left a comment
There was a problem hiding this comment.
No issues found. LGTM! ✅
Not linted (tool limitation, not a blocker): the executable-script lint — .github/workflows/finalize-release.yml: actionlint embedded-shell source mapping is not yet supported — not linted.
— qwen3.7-max via Qwen Code /review
|
Released in v0.21.2. |

4 participants


The AI release-notes step in
finalize-release.ymlproduced empty Highlights for v0.21.1 because every model request timed out on the GitHub-hosted runner (US, Azure westus3) hitting a remote LLM endpoint. The per-request timeout was right at the edge — two successful requests took 54.2s and 56.7s, every other batch hit the 60s abort, the 12-minute total budget was eaten by retries, and the circuit breaker skipped highlights entirely.What changed
timeoutMs: 60s → 180s — give the model enough headroom to generate a full JSON response over a high-RTT cross-region connection; the v0.21.1 logs show successful requests land at 54–57s, so 60s leaves no margin.totalTimeoutMs: 12min → 30min — v0.21.1 carried 178 PRs; at 8 per batch that is 23 batches. At ~78s per batch (observed median 65s + jitter margin) the full run takes ~30 minutes — right at the new budget, with the pessimistic no-speedup arm completing in 25 min.batchSize: 12 → 8 — fewer entries per prompt means the model generates less per request, returning faster and reducing the chance of a single slow entry dragging the whole batch.timeout-minutes: 15 → 35 — match the new 30-min budget plus a margin for git/npm setup.No changes to retry logic, circuit breaker, or prompt shape. #7941 already slimmed the payload; this PR addresses the other half — the timeout parameters that #7941 intentionally left unchanged and flagged as "to be confirmed by the next stable release." v0.21.1 was that confirmation.
How to verify
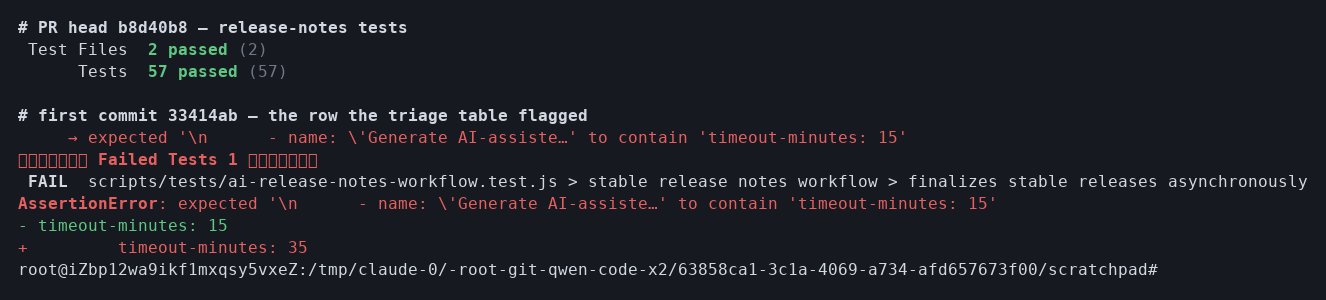
The next stable release finalize run is the real test. Locally, the 52 unit tests in
scripts/tests/generate-release-notes.test.jsall pass — they inject their owntimeoutMs/batchSizeand do not depend on the defaults.Before / After
Before (v0.21.1 finalize run 30384864993):
Expected after: successful requests that previously took ~55s now have 180s of headroom; 8-per-batch reduces per-request generation time; the 30-min budget accommodates the full 23-batch run.