Skip to content

test(cli): stamp the background-work duration fixture when the test runs, not when it loads (#10881) - #10889

Merged
wenshao merged 2 commits into
mainfrom
autofix/issue-10881
Sep 3, 2026
Merged

test(cli): stamp the background-work duration fixture when the test runs, not when it loads (#10881)#10889
wenshao merged 2 commits into
mainfrom
autofix/issue-10881

Conversation

@qwen-code-dev-bot

Copy link
Copy Markdown
Collaborator

What this PR does

Makes one unit-test fixture take its timestamp when the test runs instead of when the test file is collected, so the elapsed duration it asserts on is measured from the same phase as the code under test measures it from. The assertion is untouched and still exact.

It also sweeps the whole test tree for the same pattern and reports what it found, so the next release does not rediscover it one flake at a time.

Why it's needed

The v0.23.0 release failed on the aggregate quality gate. The lane that runs the workspace unit tests sharded spent 2260 seconds in vitest's collection phase on a contended host before executing any test.

That gap is fatal to a fixture whose clock reading is captured at collection but compared against a clock reading taken at execution. The background-work listing renders each blocking entry's elapsed duration from a read taken inside the function under test, while the fixture's 21-hour-old start time came from the enclosing describe body. The duration formatter floors to whole seconds, so the expected (running 21h) only holds while the collect-to-execute gap stays under one second — at 2260 seconds it renders (running 21h 37m 40s) and the test fails on every retry.

One instance of this class was already fixed on main for the same run, in the review session ledger. This is the second instance, still live, in the same lane; without it the next slow-collecting release reddens the same gate for the same reason.

Reviewer Test Plan

How to verify

The failure is deterministic once the collect-to-execute gap is reproduced, so no contended runner is needed.

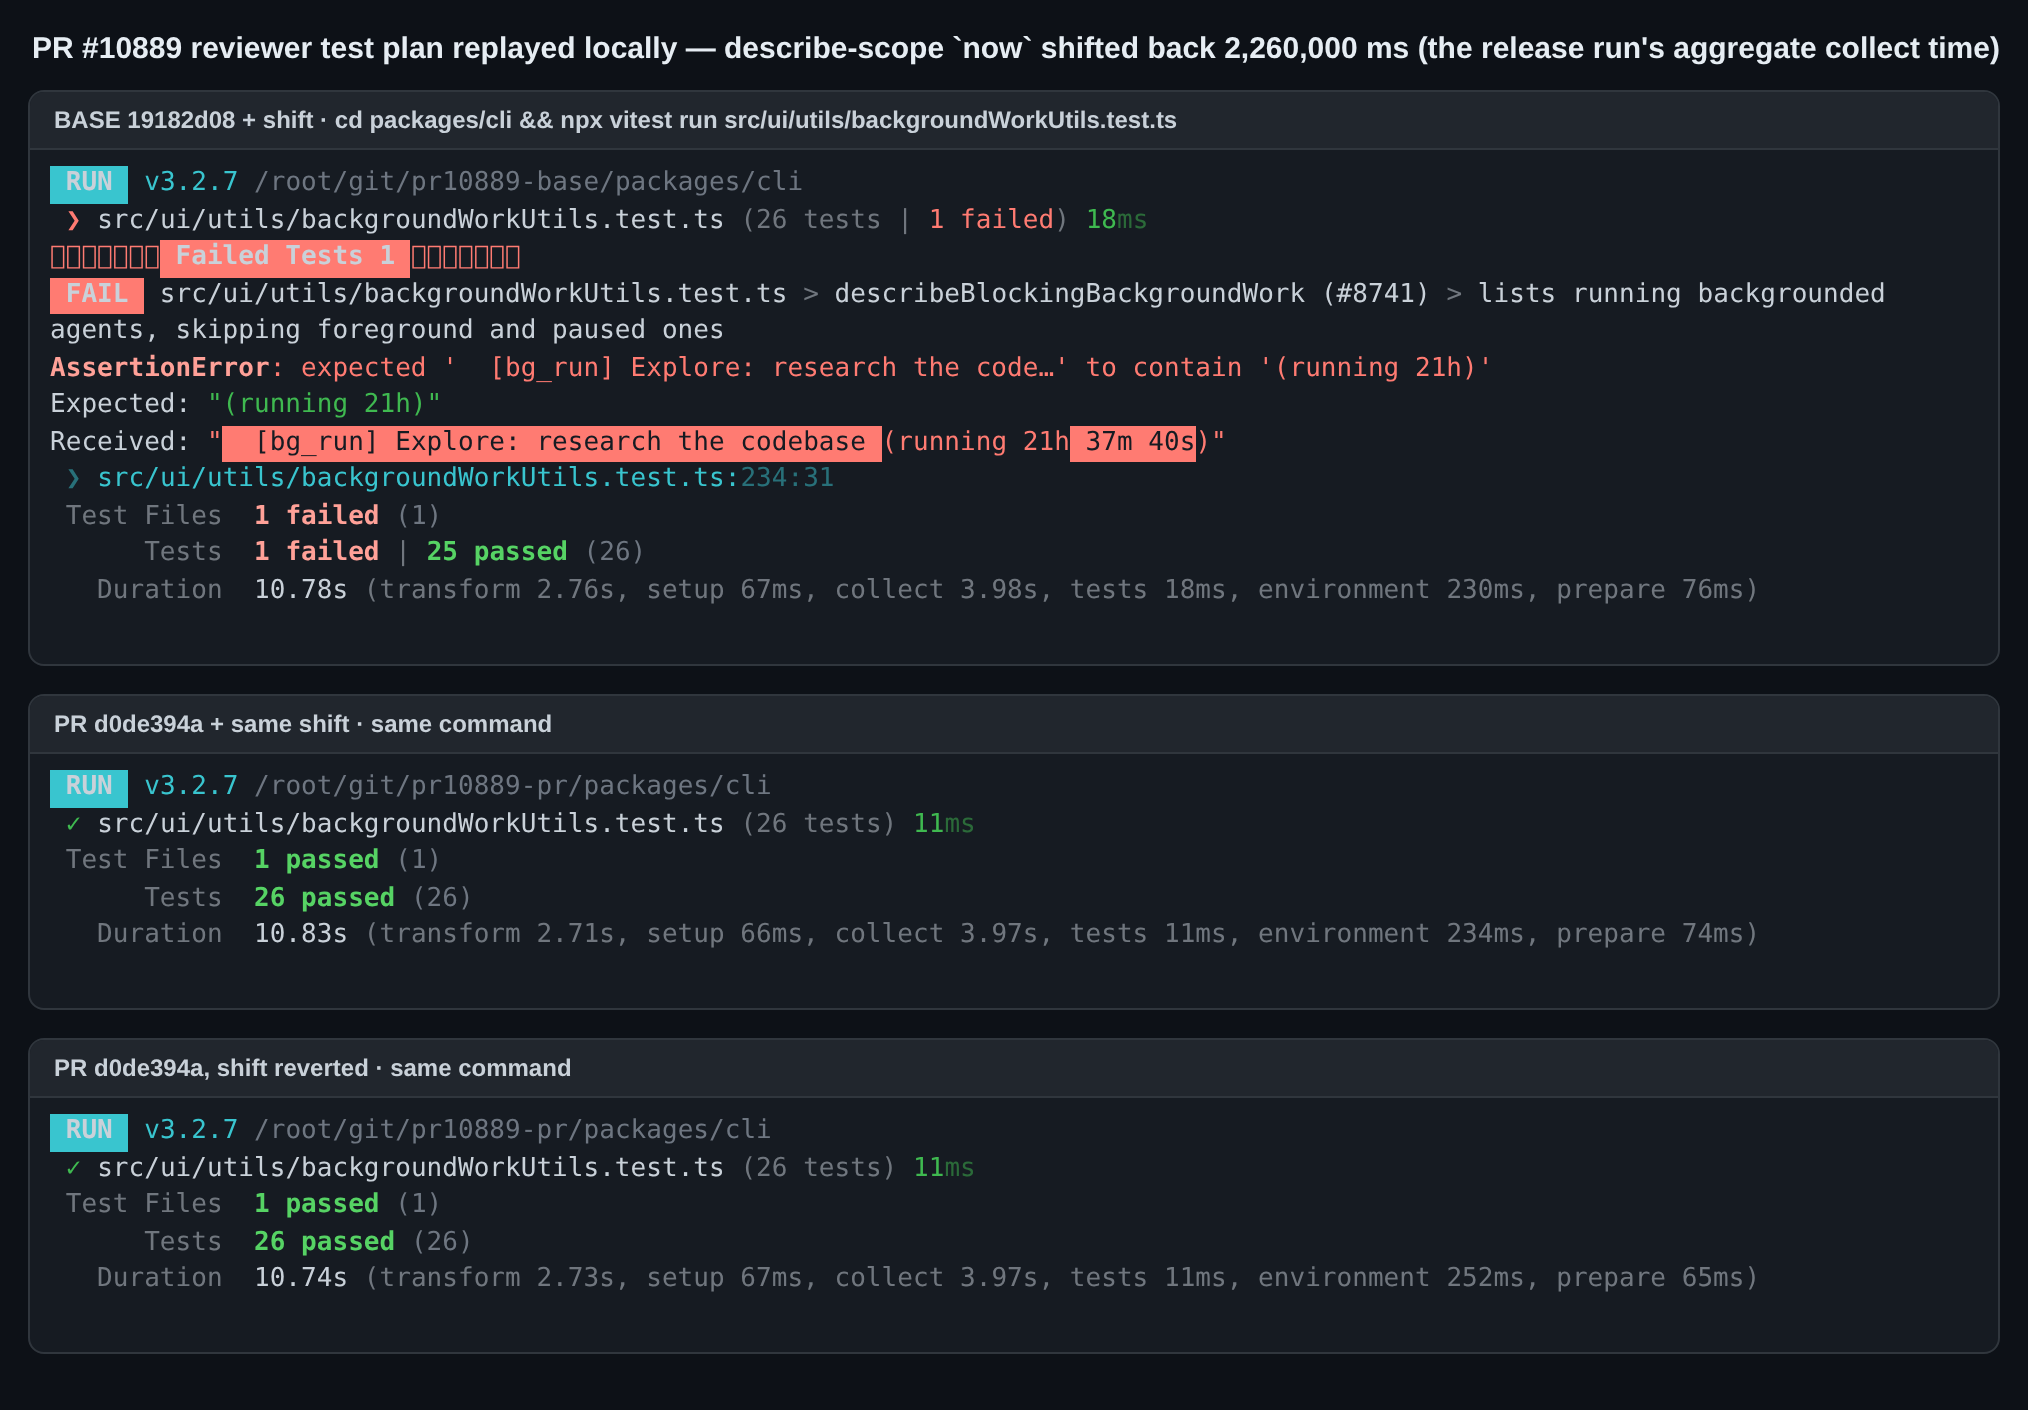
  1. On the base commit, simulate the release run's gap by shifting the collection-scope stamp in the describeBlockingBackgroundWork (#8741) block back by 2260 seconds — change const now = Date.now(); to const now = Date.now() - 2_260_000;.
  2. Run cd packages/cli && npx vitest run src/ui/utils/backgroundWorkUtils.test.ts. Expected: one failure, Expected: "(running 21h)" / Received: " [bg_run] Explore: research the codebase (running 21h 37m 40s)", 1 failed | 25 passed. The received value is 21h plus exactly the injected gap, which is the mechanism, not a coincidence.
  3. On this branch, apply the same shift and re-run. Expected: 26 passed — the fixture no longer reads the collection-scope stamp, so it is immune to the gap.
  4. Revert the shift and re-run. Expected: 26 passed.
  5. Confirm the only committed change is the fixture's stamp plus a comment recording why it cannot go back to the shared now.

A reviewer should also confirm the assertion was not relaxed: (running 21h) is asserted exactly as before, and the other fixtures in the block still use the shared collection-scope now because they only establish relative ordering, which a uniform shift preserves.

Evidence (Before & After)

N/A — no user-visible or TUI change. Test output for both directions is in the steps above and in the accompanying E2E report.

Tested on

OS Status
🍏 macOS ⚠️
🪟 Windows ⚠️
🐧 Linux

Environment (optional)

N/A — unit tests only, run directly on the Linux CI runner checkout.

Risk & Scope

  • Main risk or tradeoff: test-only, one line plus a comment. The residual exposure is the gap between the fixture's stamp and the function's own clock read — the time to build a three-entry object literal, against a one-second tolerance, where the exposure before was the entire shard collection phase (2260s observed).
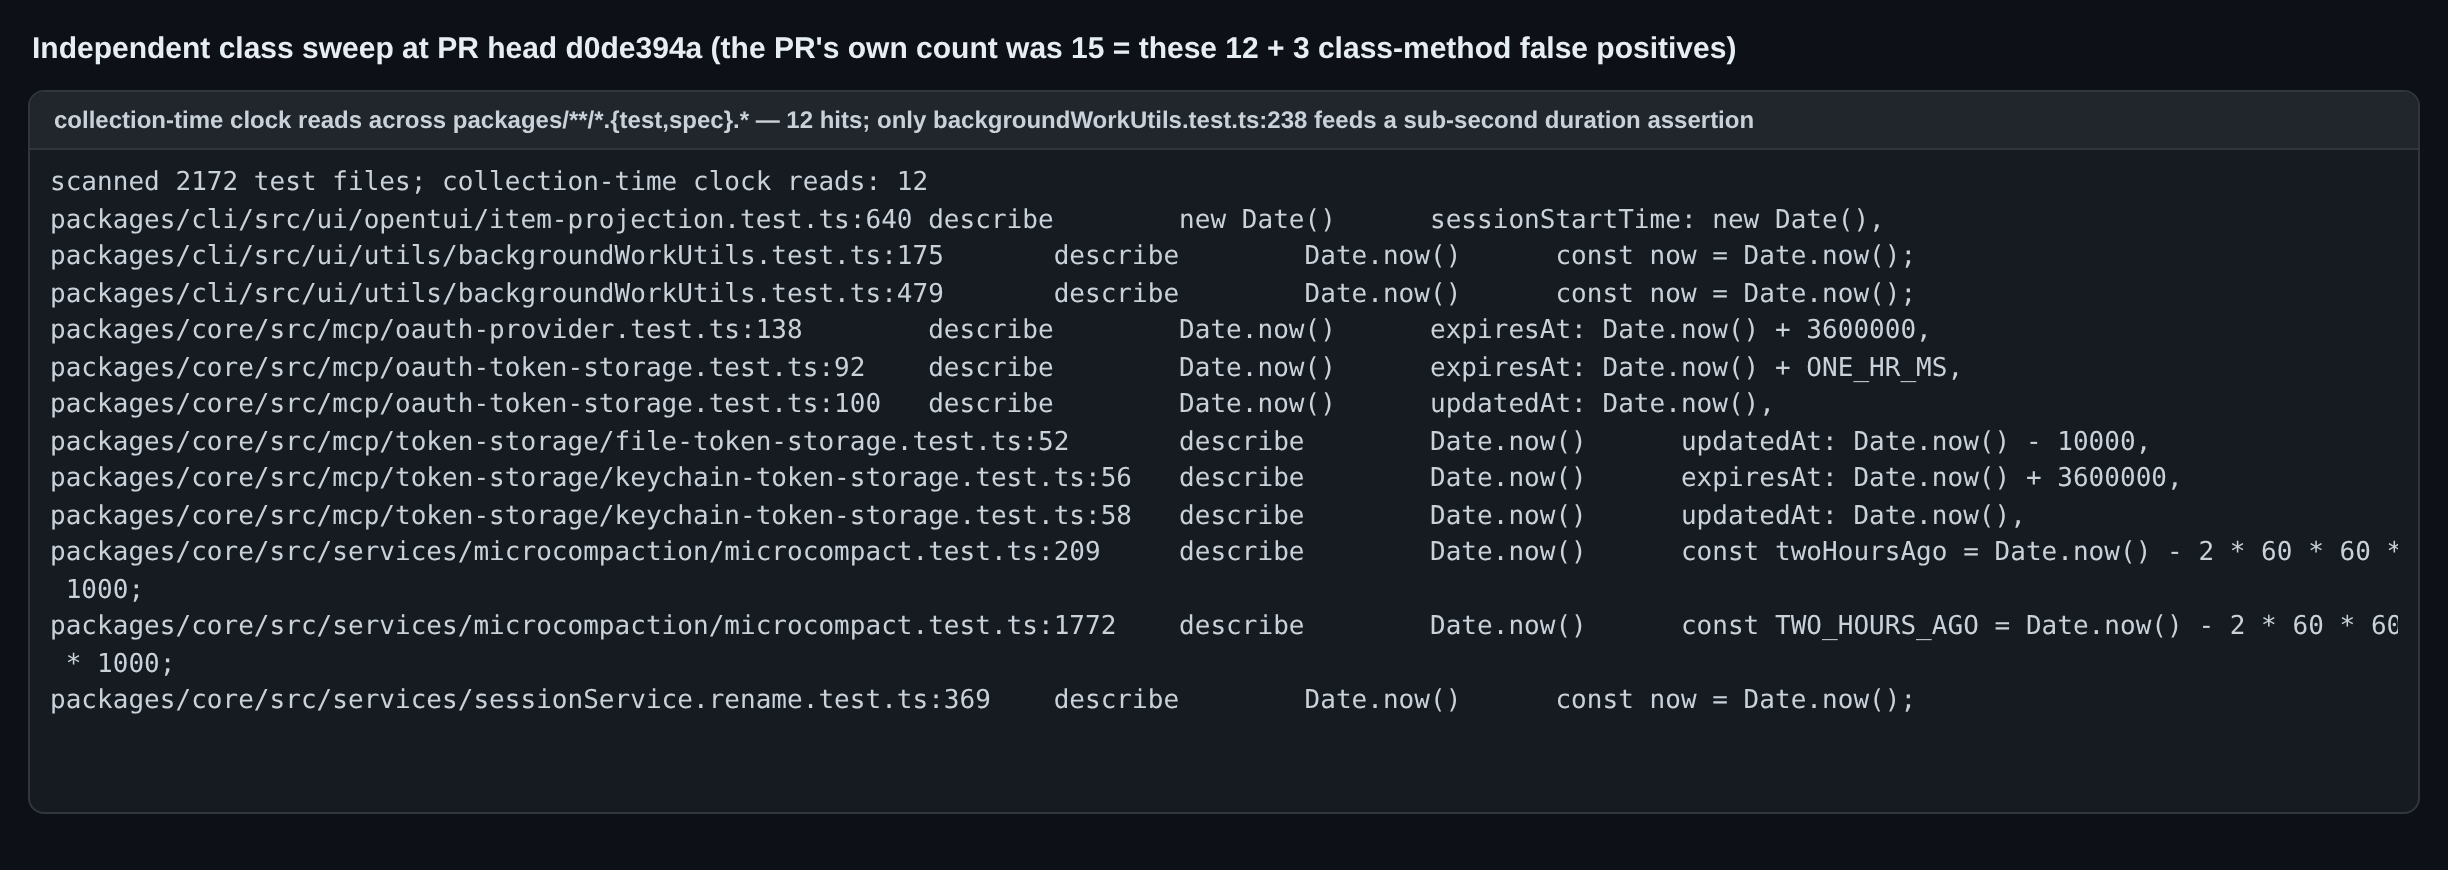
  • Not validated / out of scope: the release run's job logs could not be retrieved, because this flow has no GitHub credentials and no token in its environment; the diagnosis rests on the earlier commit that names this run plus the local reproduction above. The 2260-second collection phase itself is not addressed — it is a property of the sharded lane on a contended runner, and fixing the fixture removes the sensitivity to it rather than the duration. The sweep found 15 collection-phase clock reads across 2141 test files; the other 14 were each inspected and are class methods, wide-margin fixtures, ordering-only fixtures, or echo-only metadata that a gap cannot flip, so they were deliberately left alone instead of churning files that are not broken.
  • Breaking changes / migration notes: none.

Linked Issues

Fixes #10881

中文说明

本 PR 做了什么

让一个单元测试夹具在测试运行时获取时间戳,而不是在测试文件被收集时获取,从而使它所断言的已运行时长与被测代码的度量来自同一个阶段。断言本身未改动,仍然是精确断言。

它还对整个测试树排查了同一种模式并给出结果,以免下一次发布再一个一个 flake 地重新发现它。

为什么需要

v0.23.0 发布在聚合的 quality 关卡上失败。分片运行工作区单元测试的那条通道,在一台资源紧张的机器上于 vitest 收集阶段耗时 2260 秒,之后才开始执行任何测试。

对于“时钟读取在收集时捕获、却与执行时取得的时钟读取做比较”的夹具,这段时间差是致命的。后台任务列表用被测函数内部取得的时钟读取来渲染每个阻塞条目的已运行时长,而夹具中那个“21 小时前”的开始时间来自外层 describe 体。时长格式化函数向下取整到整秒,因此只有当收集到执行的间隔保持在 1 秒以内时,期望的 (running 21h) 才成立 —— 在 2260 秒下它渲染为 (running 21h 37m 40s),于是每次重试都失败。

这一类问题已有一个实例在 main 上针对同一次 run 被修复,即 review 会话 ledger。这是第二个实例,仍然存在,且在同一条通道中;不修的话,下一次收集缓慢的发布会因为同样的原因再次弄红同一个关卡。

评审测试计划

如何验证

一旦复现出收集到执行的间隔,该失败就是确定性的,因此不需要资源紧张的 runner。

  1. 在 base 提交上,把 describeBlockingBackgroundWork (#8741) 块中收集阶段的时间戳回拨 2260 秒来模拟该发布 run 的间隔 —— 将 const now = Date.now(); 改为 const now = Date.now() - 2_260_000;
  2. 运行 cd packages/cli && npx vitest run src/ui/utils/backgroundWorkUtils.test.ts。预期:一个失败,Expected: "(running 21h)" / Received: " [bg_run] Explore: research the codebase (running 21h 37m 40s)",1 failed | 25 passed。收到的值恰好是 21 小时加上注入的间隔,这说明的是机制本身,而不是巧合。
  3. 在本分支上施加同样的回拨并重新运行。预期:26 passed —— 夹具不再读取收集阶段的时间戳,因此对间隔免疫。
  4. 撤销回拨并重新运行。预期:26 passed。
  5. 确认唯一被提交的改动是夹具的时间戳,外加一条记录“为什么不能改回共享的 now”的注释。

评审者还应确认断言没有被放宽:(running 21h) 与之前完全一样是精确断言,并且该块中其余夹具仍然使用共享的收集阶段 now,因为它们只用于确立相对顺序,而统一平移会保持该顺序。

证据(前后对比)

N/A —— 无用户可见或 TUI 变更。两个方向的测试输出见上面的步骤以及随附的 E2E 报告。

测试环境

OS Status
🍏 macOS ⚠️
🪟 Windows ⚠️
🐧 Linux

环境(可选)

N/A —— 仅单元测试,直接在 Linux CI runner 的检出上运行。

风险与范围

  • 主要风险或取舍:仅测试,一行代码加一条注释。残余暴露是夹具时间戳与函数自身时钟读取之间的间隔 —— 即构造一个三条目对象字面量所需的时间,对应 1 秒的容忍度;而此前的暴露是整个分片收集阶段(实测 2260 秒)。
  • 未验证 / 范围之外:该发布 run 的作业日志无法获取,因为本流程没有 GitHub 凭据、环境中也没有 token;结论依据是早前指名该 run 的那个提交,加上上面的本地复现。2260 秒的收集阶段本身未处理 —— 它是分片通道在资源紧张 runner 上的属性,修复夹具消除的是对它的敏感性,而不是它的耗时。排查在 2141 个测试文件中发现 15 处收集阶段的时钟读取;其余 14 处均已逐一检查,分别是类方法、宽裕边界的夹具、仅用于排序的夹具,或间隔翻不过去的只回显元数据,因此刻意不去改动,而不是折腾本来没坏的文件。
  • 破坏性变更 / 迁移说明:无。

关联 Issue

Fixes #10881

…uns, not when it loads (#10881)

`describeBlockingBackgroundWork` measures the duration it renders against
the `Date.now()` it takes when it runs, but the fixture's 21h-old
`startTime` came from a `now` captured in the describe body — at
collection. The gap between the two is however long vitest spent
collecting the shard, and `formatDuration` floors to whole seconds, so a
gap of one second or more renders `21h 1s` and fails `(running 21h)`.

Release run 33713579913 (v0.23.0) collected for 2260s on a contended host
and reddened the quality gate. Reproduced by shifting that describe-scope
stamp back by the same 2260s:

  Expected: "(running 21h)"
  Received: "  [bg_run] Explore: research the codebase (running 21h 37m 40s)"

Stamping the fixture at call time leaves the file green under the same
shift, with the assertion unchanged.

Same class as the run-ledger fix in 0e3094e, which that commit tied to
this run. An AST sweep of all 2141 package test files for live clock reads
that execute during collection found 15; the rest are class methods,
wide-margin fixtures, or ordering-only fixtures that a gap cannot flip.
@qwen-code-dev-bot

Copy link
Copy Markdown
Collaborator Author

Release failure triage: v0.23.0, quality job (run 33713579913)

What failed

The v0.23.0 release reddened on the aggregate quality gate, which fails closed when any of its component lanes (static, build, typecheck, workspace tests, script tests) does not succeed. No GitHub credentials are available in this workflow, so the run's job logs could not be downloaded; the diagnosis below is built from the repository's own history plus a local reproduction.

Root cause

The release lane runs the workspace unit tests sharded, and on this run vitest spent 2260s collecting on a contended host before executing. That gap between the collection phase and the execution phase is fatal to any test fixture whose timestamp is captured when the file is collected but is compared against a clock read taken when the test runs.

One such fixture was already fixed on main by 0e3094ebf6 ("test(review): stamp the ledger entries when the test runs, not when it loads"), whose commit message names this exact run and its 1/0/0 symptom across the three retry attempts. That fix landed after the release had already checked out its SHA, so the failing run did not contain it.

This round found and fixed a second, still-live instance of the same class in the same lane. The background-work listing renders each blocking entry's elapsed duration by measuring from a clock read taken inside the function under test, while the fixture's 21-hour-old start time was derived from a now captured in the enclosing describe body — i.e. at collection. The duration formatter floors to whole seconds, so the assertion (running 21h) only holds when the collect-to-execute gap is under one second. At this run's 2260s gap it renders 21h 37m 40s.

Reproduction

The condition was reproduced deterministically by shifting the collection-scope stamp back by the same 2260s the release run measured, then running the focused test:

FAIL  src/ui/utils/backgroundWorkUtils.test.ts > describeBlockingBackgroundWork (#8741) > lists running backgrounded agents, skipping foreground and paused ones
AssertionError: expected '  [bg_run] Explore: research the code…' to contain '(running 21h)'

Expected: "(running 21h)"
Received: "  [bg_run] Explore: research the codebase (running 21h 37m 40s)"

 Test Files  1 failed (1)
      Tests  1 failed | 25 passed (26)

21h 37m 40s is exactly 21h plus 2260s, confirming the mechanism rather than inferring it.

Fix

The fixture now takes its stamp at call time, inside the test body, so it comes from the same phase as the measurement it is compared against. The assertion itself is unchanged and still exact — nothing was weakened, loosened, or deleted.

Class sweep

Because the release gate had now been reddened twice by one pattern, every package test file was swept for it rather than only the reported file. A TypeScript AST pass over all 2141 *.test.ts(x) files under packages/ identified live clock reads that execute during the collection phase — a read with no enclosing function, or whose only enclosing functions are describe/suite callbacks. It found 15. Each was inspected:

  • 1 gap-sensitive — the fixture fixed here, the only one feeding a tight-threshold assertion.
  • 3 false positives — reads inside class methods, which execute when called, not when collected.
  • 11 immune — wide-margin fixtures (a one-hour expiry the 37-minute gap cannot flip), ordering-only fixtures where every entry shifts equally so relative order is preserved, mock metadata that is only stored and echoed back, and a trigger threshold the gap pushes further past rather than across.

They were left untouched: a fix that is not needed is diff growth, and the release lane's retry budget is better spent on real signal.

Note on the 2260s collect phase

The abnormal collect duration is what turned a one-second tolerance into a release failure, and it is not addressed here — it is a property of the sharded lane on a contended runner, not of the fixture. Fixing the fixture removes the sensitivity; whether collection should take 38 minutes is a separate question for whoever owns the release lane's capacity.

Verification

  • npm run build — passed (exit 0, 509s)
  • npm run typecheck — passed (exit 0)
  • npm run lint — passed (exit 0)
  • npx prettier --check packages/cli/src/ui/utils/backgroundWorkUtils.test.ts — passed (exit 0); the three >80-column lines it reports are pre-existing, not from this change
  • cd packages/cli && npx vitest run src/ui/utils/backgroundWorkUtils.test.ts — 26 passed (26)
  • Mutation probe (pre-fix): with the collection-scope stamp shifted back 2,260,000 ms to match run 33713579913's collect duration — 1 failed | 25 passed; failure text reproduced above
  • Mutation probe (post-fix, shift still applied): 26 passed (26) — the fix is load-bearing and immune to the exact CI condition, not merely green because the probe was removed
  • Mutation probe (post-fix, shift restored): 26 passed (26) — final committed state
  • git status --porcelain --untracked-files=all — empty; the probe edits were fully reverted and only the intended file is in the commit
  • Not run: integration tests (the behavior is exercised only by unit tests, not through the bundled CLI or integration harness); npm run generate:settings-schema (no settings source changed)
  • Unavailable check: the GitHub Actions job logs for run 33713579913 could not be retrieved — this workflow grants no GitHub credentials, and no GH_TOKEN/GITHUB_TOKEN is present in the environment. The workflow's own CI run on this branch is the remaining verification gate.
中文说明

发布失败排查:v0.23.0,quality 作业(run 33713579913)

失败内容

v0.23.0 发布在聚合的 quality 关卡上变红。该关卡在其任一组成通道(静态检查、构建、类型检查、工作区测试、脚本测试)未成功时会 fail closed。本工作流中没有 GitHub 凭据,因此无法下载该 run 的作业日志;下面的结论来自仓库自身的历史记录加上本地复现。

根因

发布通道分片运行工作区单元测试,本次 run 中 vitest 在一台资源紧张的机器上收集(collect)阶段耗时 2260 秒才开始执行。收集阶段与执行阶段之间的这段时间差,对任何“时间戳在文件被收集时捕获、却与测试运行时读取的时钟做比较”的测试夹具都是致命的。

其中一个夹具已由 main 上的 0e3094ebf6(“test(review): stamp the ledger entries when the test runs, not when it loads”)修复,该提交的说明正是指名了这次 run,以及三次重试中 1/0/0 的现象。该修复是在发布已经检出其 SHA 之后才落地的,所以失败的那次 run 并不包含它。

本轮发现并修复了同一通道中同类的第二个、且仍然存在的实例。后台任务列表通过在被测函数内部读取的时钟来计量每个阻塞条目已经运行的时长,而夹具中那个“21 小时前”的开始时间却取自外层 describe 体中捕获的 now —— 也就是收集阶段。时长格式化函数会向下取整到整秒,因此只有当收集到执行的间隔小于 1 秒时,断言 (running 21h) 才成立。在本次 run 2260 秒的间隔下,它渲染为 21h 37m 40s

复现

通过把收集阶段的时间戳按本次发布 run 实测的同样 2260 秒向前回拨,再运行定向测试,该条件被确定性地复现出来:

FAIL  src/ui/utils/backgroundWorkUtils.test.ts > describeBlockingBackgroundWork (#8741) > lists running backgrounded agents, skipping foreground and paused ones
AssertionError: expected '  [bg_run] Explore: research the code…' to contain '(running 21h)'

Expected: "(running 21h)"
Received: "  [bg_run] Explore: research the codebase (running 21h 37m 40s)"

 Test Files  1 failed (1)
      Tests  1 failed | 25 passed (26)

21h 37m 40s 恰好等于 21 小时加 2260 秒,这确认了机制本身,而不是靠推断。

修复

夹具现在在调用时(测试体内部)获取时间戳,因此它与所要比较的那次度量来自同一个阶段。断言本身未作改动,仍然是精确断言 —— 没有任何检查被削弱、放宽或删除。

同类问题排查

由于发布关卡已经被同一种模式弄红两次,本轮对所有包测试文件做了排查,而不只是被报告的那一个。一次 TypeScript AST 扫描覆盖 packages/ 下全部 2141 个 *.test.ts(x) 文件,找出在收集阶段执行的实时时钟读取 —— 即没有外层函数、或外层函数只有 describe/suite 回调的读取。共找到 15 处,逐一检查:

  • 1 处对间隔敏感 —— 即此处修复的夹具,也是唯一一处喂给紧阈值断言的。
  • 3 处误报 —— 位于类方法内部的读取,它们在方法被调用时执行,而不是在收集时执行。
  • 11 处免疫 —— 包括宽裕边界的夹具(一小时后的过期时间,37 分钟的间隔翻不过去)、所有条目同步平移因而相对顺序不变的排序类夹具、只被存储并原样回显的 mock 元数据,以及间隔只会把它推得更远而非推过阈值的触发条件。

这些都没有改动:不必要的修复只是 diff 膨胀,发布通道的重试预算更应花在真实信号上。

关于 2260 秒收集阶段

异常的收集耗时正是把 1 秒的容忍度变成一次发布失败的原因,本轮未处理它 —— 它是分片通道在资源紧张机器上的属性,而不是夹具的属性。修复夹具消除了敏感性;至于收集是否应该花掉 38 分钟,是留给发布通道容量负责人的另一个问题。

验证

  • npm run build —— 通过(exit 0,509 秒)
  • npm run typecheck —— 通过(exit 0)
  • npm run lint —— 通过(exit 0)
  • npx prettier --check packages/cli/src/ui/utils/backgroundWorkUtils.test.ts —— 通过(exit 0);它报出的三处超过 80 列的行是既有问题,不是本次改动引入的
  • cd packages/cli && npx vitest run src/ui/utils/backgroundWorkUtils.test.ts —— 26 passed (26)
  • 变异探针(修复前): 将收集阶段的时间戳回拨 2,260,000 毫秒以匹配 run 33713579913 的收集耗时 —— 1 failed | 25 passed;失败文本见上
  • 变异探针(修复后,回拨仍然保留): 26 passed (26) —— 说明该修复是真正起作用的、并且对确切的 CI 条件免疫,而不是因为探针被移除才变绿
  • 变异探针(修复后,回拨已还原): 26 passed (26) —— 最终提交状态
  • git status --porcelain --untracked-files=all —— 空;探针改动已完全还原,提交中只包含预期文件
  • 未运行:集成测试(该行为只由单元测试覆盖,不经过打包后的 CLI 或集成测试框架);npm run generate:settings-schema(未改动任何 settings 源)
  • 无法执行的检查: run 33713579913 的 GitHub Actions 作业日志无法获取 —— 本工作流不授予 GitHub 凭据,环境中也不存在 GH_TOKEN/GITHUB_TOKEN。剩余的验证关卡是本分支上工作流自身的 CI 运行。

🧠 Handled by Qwen Code · model/模型 qwen3.8-max-2026-09-02

@qwen-code-ci-bot

qwen-code-ci-bot commented Sep 3, 2026

Copy link
Copy Markdown
Collaborator

Qwen Triage finished — CI landed green on 2c98a63 and the deferred approval was posted. finalize run

Qwen Triage 已完成 —— 2c98a63 的 CI 全绿,延迟审批已提交。查看 finalize 运行

@qwen-code-ci-bot

Copy link
Copy Markdown
Collaborator

Thanks for the PR!

Template looks good ✓

Problem: observed, not theoretical. The v0.23.0 release reddened on the aggregate quality gate (run 33713579913), and the triage in this thread documents a deterministic reproduction: shifting the collection-scope stamp back by the run's measured 2260s collect phase makes the test fail with (running 21h 37m 40s) — exactly 21h plus the gap. The same class was already fixed on main for this run by #10878; this is the second, still-live instance in the same lane.

Direction: aligned. This is a release-gate deflake — the gate exists precisely so a fixture like this cannot silently redden a release, and the fix removes sensitivity to the collect→execute gap rather than weakening the check. CHANGELOG: no direct reference (test-only change, nothing ships to users), though the background-work surface it exercises is actively developed upstream.

Size: no core-module paths touched — one test file, +5/−1, zero production lines. Tier gates not applicable.

Approach: the scope is right. One fixture gets stamped at call time; the assertion (running 21h) is untouched and still exact; the added comment records why this fixture cannot go back to the shared describe-scope now. The class sweep (15 collection-phase clock reads, other 14 inspected as immune) is reported in the body but adds no diff — the right call under minimal-change.

Risk: no elevated risk signals — the only changed file is a test file; no high-risk paths matched.

Moving on to code review. 🔍

中文说明

感谢贡献!

模板完整 ✓

问题:已观测到,不是理论问题。v0.23.0 发布在聚合的 quality 关卡(run 33713579913)上失败,本线程的排查记录了确定性复现:把收集阶段的时间戳按该 run 实测的 2260 秒收集耗时回拨后,测试失败并渲染 (running 21h 37m 40s) —— 恰好是 21 小时加上该间隔。同类问题已在 main 上由 #10878 针对同一 run 修复过一处;本 PR 修的是同一通道中第二个仍然存在的实例。

方向:对齐。这是一次发布关卡的 deflake —— 关卡的意义正是防止这类夹具悄悄把发布染红,而本修复消除的是对"收集→执行"时间差的敏感性,不是放宽检查。CHANGELOG:无直接引用(纯测试改动,不面向用户),但其覆盖的后台任务列表界面在上游正活跃开发。

规模:未触及核心模块路径 —— 单个测试文件,+5/−1,生产代码零行。分级门槛不适用。

方案:范围合理。只有一个夹具改为在调用时取时间戳;断言 (running 21h) 原样保留、仍是精确断言;新增注释说明了该夹具为何不能回到 describe 作用域共享的 now。全类排查(15 处收集阶段时钟读取,其余 14 处逐一检查后判定免疫)只写进正文、不产生 diff —— 符合最小改动原则。

风险:无升级风险信号 —— 唯一改动文件是测试文件,未命中高风险路径。

进入代码审查 🔍

Qwen Code · qwen3.8-max

Reviewed at 2c98a6312e1219cc374f188e8c3e7142b671b1da · re-run with @qwen-code /triage

@qwen-code-ci-bot

qwen-code-ci-bot commented Sep 3, 2026

Copy link
Copy Markdown
Collaborator

Code review

Before reading the diff, my independent proposal for "fixture stamped at collection time, compared against a clock read taken at execution time" was exactly what this PR does: move the stamp to call time. The alternatives are worse — fake timers (vi.setSystemTime) would restructure the whole block and change what all 26 tests exercise, and loosening the assertion is what the repo's deflake discipline explicitly forbids. One line is the right size for this fix.

I then verified the mechanism against the source rather than taking the description at face value:

  • describeBlockingBackgroundWork takes its own Date.now() and renders formatDuration(now - entry.startTime, ...); formatDuration floors hours/minutes/seconds for durations ≥ 60s — so 21h + ε with ε under one second renders exactly (running 21h).
  • The changed fixture is built inside the it body, so its Date.now() reads at execution time, in the same phase as the function's read. The rendered duration is 21h + (function read − fixture stamp) — bounded below by 21h and above by 21h plus a few microseconds of object construction. The assertion holds deterministically, no tolerance needed.
  • The other fixtures in the block are correctly left on the shared describe-scope now: fg_run/bg_paused are filtered out before rendering, and every remaining test asserts ordering, counts, or sanitization — all preserved by a uniform shift.
  • Nothing is weakened: (running 21h) is asserted exactly as before. The added comment records why this fixture can never go back to the shared now — that's the non-obvious why the comment guidelines ask for.

No blockers, no convention violations. One non-blocking residual, acknowledged in the PR's own risk section: a wall-clock step backwards between the fixture's read and the function's read could render just under 21h — inherent to any real-clock test, vanishingly unlikely on CI runners.

Testing

This lane never executes PR-derived code; the evidence below is the PR's own CI read via the API. At the reviewed commit the unit/lint lanes are still running (~30 min suite — no polling), and there are no red checks so far. The macOS/Windows/CLI-integration skips are routine: the same skip pattern appears on #10878, merged in this same lane earlier.

Final CI results for 2c98a63 (auto-updated by the triage finalize job after CI completed):

Check Conclusion
Classify PR ✅ success
Dependency CVE audit ✅ success
Desktop Shell (ubuntu-22.04) ✅ success
Desktop Shell (windows-2022) ✅ success
Integration Tests (no-AK, No Sandbox) ✅ success
Lint & Static (ubuntu-latest, Node 22.x) ✅ success
OpenTUI no-flicker gate ✅ success
Secret scan (TruffleHog) ✅ success
Test (ubuntu-latest, Node 22.x) ✅ success
TUI parity snapshots (ink vs opentui) ✅ success
web-shell E2E Smoke (ubuntu-latest, Node 22.x) ✅ success

One row per check name (latest run); skipped checks omitted; failures sort first. / 每个检查名一行(取最新一次运行),省略 skipped,失败项排在最前。

Honest limits of this pass: the before/after reproduction and the mutation-probe transcript (shift the stamp back 2260s → fails before, passes after) are the author's results from the triage comment above, not independently re-run here — this lane cannot execute PR code. The mechanism itself does not depend on them: the arithmetic of the two Date.now() reads is fully determined by the source read above.

Sandboxed verification would settle what CI here cannot: @qwen-code /verify — a green suite passes equally with or without the fix (healthy CI collects fast, so the collect→execute gap never materializes), and the thing that pins the change is the 2260s-gap mutation probe. Static review already settles the arithmetic, so this is belt-and-braces, not a blocker.

中文说明

代码审查

在读 diff 之前,我对"夹具在收集时取时间戳、却与执行时的时钟读取比较"这一问题的独立方案,与本 PR 完全一致:把取时间戳移到调用时。备选方案都更差——假时钟(vi.setSystemTime)要重构整个测试块并改变全部 26 个测试的验证内容;放宽断言则是本仓库 deflake 纪律明确禁止的。一行修复正是合适的规模。

随后我对照源码核实了机制,而不是照单接受描述:

  • describeBlockingBackgroundWork 自己取 Date.now() 并渲染 formatDuration(now - entry.startTime, ...)formatDuration 对 ≥60 秒的时长向下取整到时/分/秒——所以 ε 小于 1 秒时 21h + ε 恰好渲染为 (running 21h)
  • 改动的夹具在 it 体内构造,其 Date.now() 在执行阶段读取,与函数内的读取同相。渲染时长为 21h +(函数读取 − 夹具时间戳)——下界 21h,上界 21h 加几微秒的对象构造耗时。断言确定性成立,无需容差。
  • 块内其余夹具继续用 describe 作用域共享的 now 是正确的:fg_run/bg_paused 在渲染前就被过滤,其余测试只断言排序、计数或净化——均匀平移不影响它们。
  • 没有任何削弱:(running 21h) 仍按原样精确断言。新增注释记录了该夹具为何永远不能回到共享 now ——正是注释规范要求的"不显然的 why"。

无阻塞项,无规范违规。一个非阻塞的残余风险(PR 自己的风险一节也已承认):夹具读取与函数读取之间墙钟若被回拨,渲染可能略小于 21h —— 这是所有真实时钟测试的固有属性,在 CI 上几乎不可能发生。

测试

本通道从不执行 PR 派生代码;以下为通过 API 读取的 PR 自身 CI 证据。在受审提交上,单测/静态检查通道仍在运行(套件套约 30 分钟——不做轮询),目前没有红色检查。macOS/Windows/CLI 集成被跳过属正常:同一通道稍早合并的 #10878 呈现完全相同的跳过模式。

本次审查的诚实边界:before/after 复现与变异探针记录(时间戳回拨 2260 秒 → 修复前失败、修复后通过)是上方排查评论中作者的结果,未在此独立重跑——本通道不能执行 PR 代码。但机制本身不依赖这些记录:两次 Date.now() 读取的算术关系已由上面的源码阅读完全确定。

沙箱验证可以解决此处 CI 无法解决的问题:@qwen-code /verify —— 绿色套件在有此修复与没有此修复时同样通过(健康的 CI 收集很快,收集→执行的时间差不会出现),而真正钉住该改动的是 2260 秒间隔的变异探针。静态审查已经确定了算术关系,所以这只是双保险,不是阻塞项。

Qwen Code · qwen3.8-max

Reviewed at 2c98a6312e1219cc374f188e8c3e7142b671b1da · re-run with @qwen-code /triage

@qwen-code-ci-bot

Copy link
Copy Markdown
Collaborator

Confidence: 5/5 — observed release failure, deterministic reproduction with exact arithmetic, precedent fix already merged for the same class, and a one-line diff that pins the fixture to the right clock phase without touching the assertion.

My independent proposal for this class of flake was identical to what landed here — stamp the fixture in the same phase the code under test measures from — and I couldn't find a simpler path the PR missed. The alternatives (fake timers, relaxed assertion) are both larger and worse. Every line of the diff is necessary: one fixture, one explanatory comment, and the sweep results deliberately kept out of the diff. Six months from now, the comment telling the next editor why this fixture can't return to the shared now is exactly what will keep this from regressing.

Pattern check: the author carries nine open PRs, all from the project's own automation lane — this one stands on its own evidence, and the evidence is the strong kind: a failed release run, a repro where the received value is 21h plus exactly the injected gap, and a prior fix (#10878) proving the class real. And this is not the gate being soft — a test-only change that weakens nothing, from a lane that just watched this exact failure mode redden a release twice, is what the gate should wave through quickly.

Verdict: approve — but the unit/lint lanes are still in flight on the reviewed commit, so approval is deferred until CI lands green on 2c98a6312e1219cc374f188e8c3e7142b671b1da. If anything lands red, the approval is withheld.

中文说明

置信度:5/5 —— 已观测到的发布失败、精确算术吻合的确定性复现、同类问题已有先行修复合入,且本次一行 diff 将夹具锚定到正确的时钟阶段而未触碰断言。

我对这类 flake 的独立方案与最终落地的完全一致 —— 让夹具在与被测代码相同的阶段取时间戳 —— 我也没找到比这更简单的路径。备选方案(假时钟、放宽断言)都更大、更差。Diff 中每一行都是必要的:一个夹具、一条解释性注释,排查结果被刻意排除在 diff 之外。六个月后,正是这条告诉后来者"该夹具为何不能回到共享 now"的注释,会防止它回归。

模式检查:该作者名下有九个开放 PR,均来自项目自身的自动化通道 —— 本 PR 凭自身证据成立,而证据是强证据:一次失败的发布 run、received 值恰好等于 21 小时加注入间隔的复现,以及证明该类问题真实存在的先行修复(#10878)。这也不是关卡放水:一个不削弱任何检查的纯测试改动,来自刚刚目睹同一失败模式两次染红发布的通道,正是关卡应当快速放行的对象。

结论:批准 —— 但单测/静态检查通道在受审提交上仍在运行,故批准推迟到 CI 在该提交上全绿之后(2c98a6312e1219cc374f188e8c3e7142b671b1da)。如有任何检查变红,将不予批准。

Qwen Code · qwen3.8-max

Reviewed at 2c98a6312e1219cc374f188e8c3e7142b671b1da · re-run with @qwen-code /triage

@wenshao

wenshao commented Sep 3, 2026

Copy link
Copy Markdown
Collaborator

Local verification of PR #10889 — real release-run logs + A/B harness

I rebuilt this locally in two worktrees (base 19182d08 = the PR's merge-base on main, PR head d0de394a), pulled the actual job logs of release run 33713579913 (which the autofix flow could not do), and drove both arms through three independent experiments plus a class sweep. Screenshots are hosted on my fork; all commands are reproducible from the notes below.

Verdict

The one-line change is correct and worth merging — it removes a genuine sub-second timing hazard from a fixture, the assertion is untouched, lint/prettier are clean, and the class sweep matches the PR's own inventory. But the story around it does not match the run logs, and one consequence is actionable before merge:

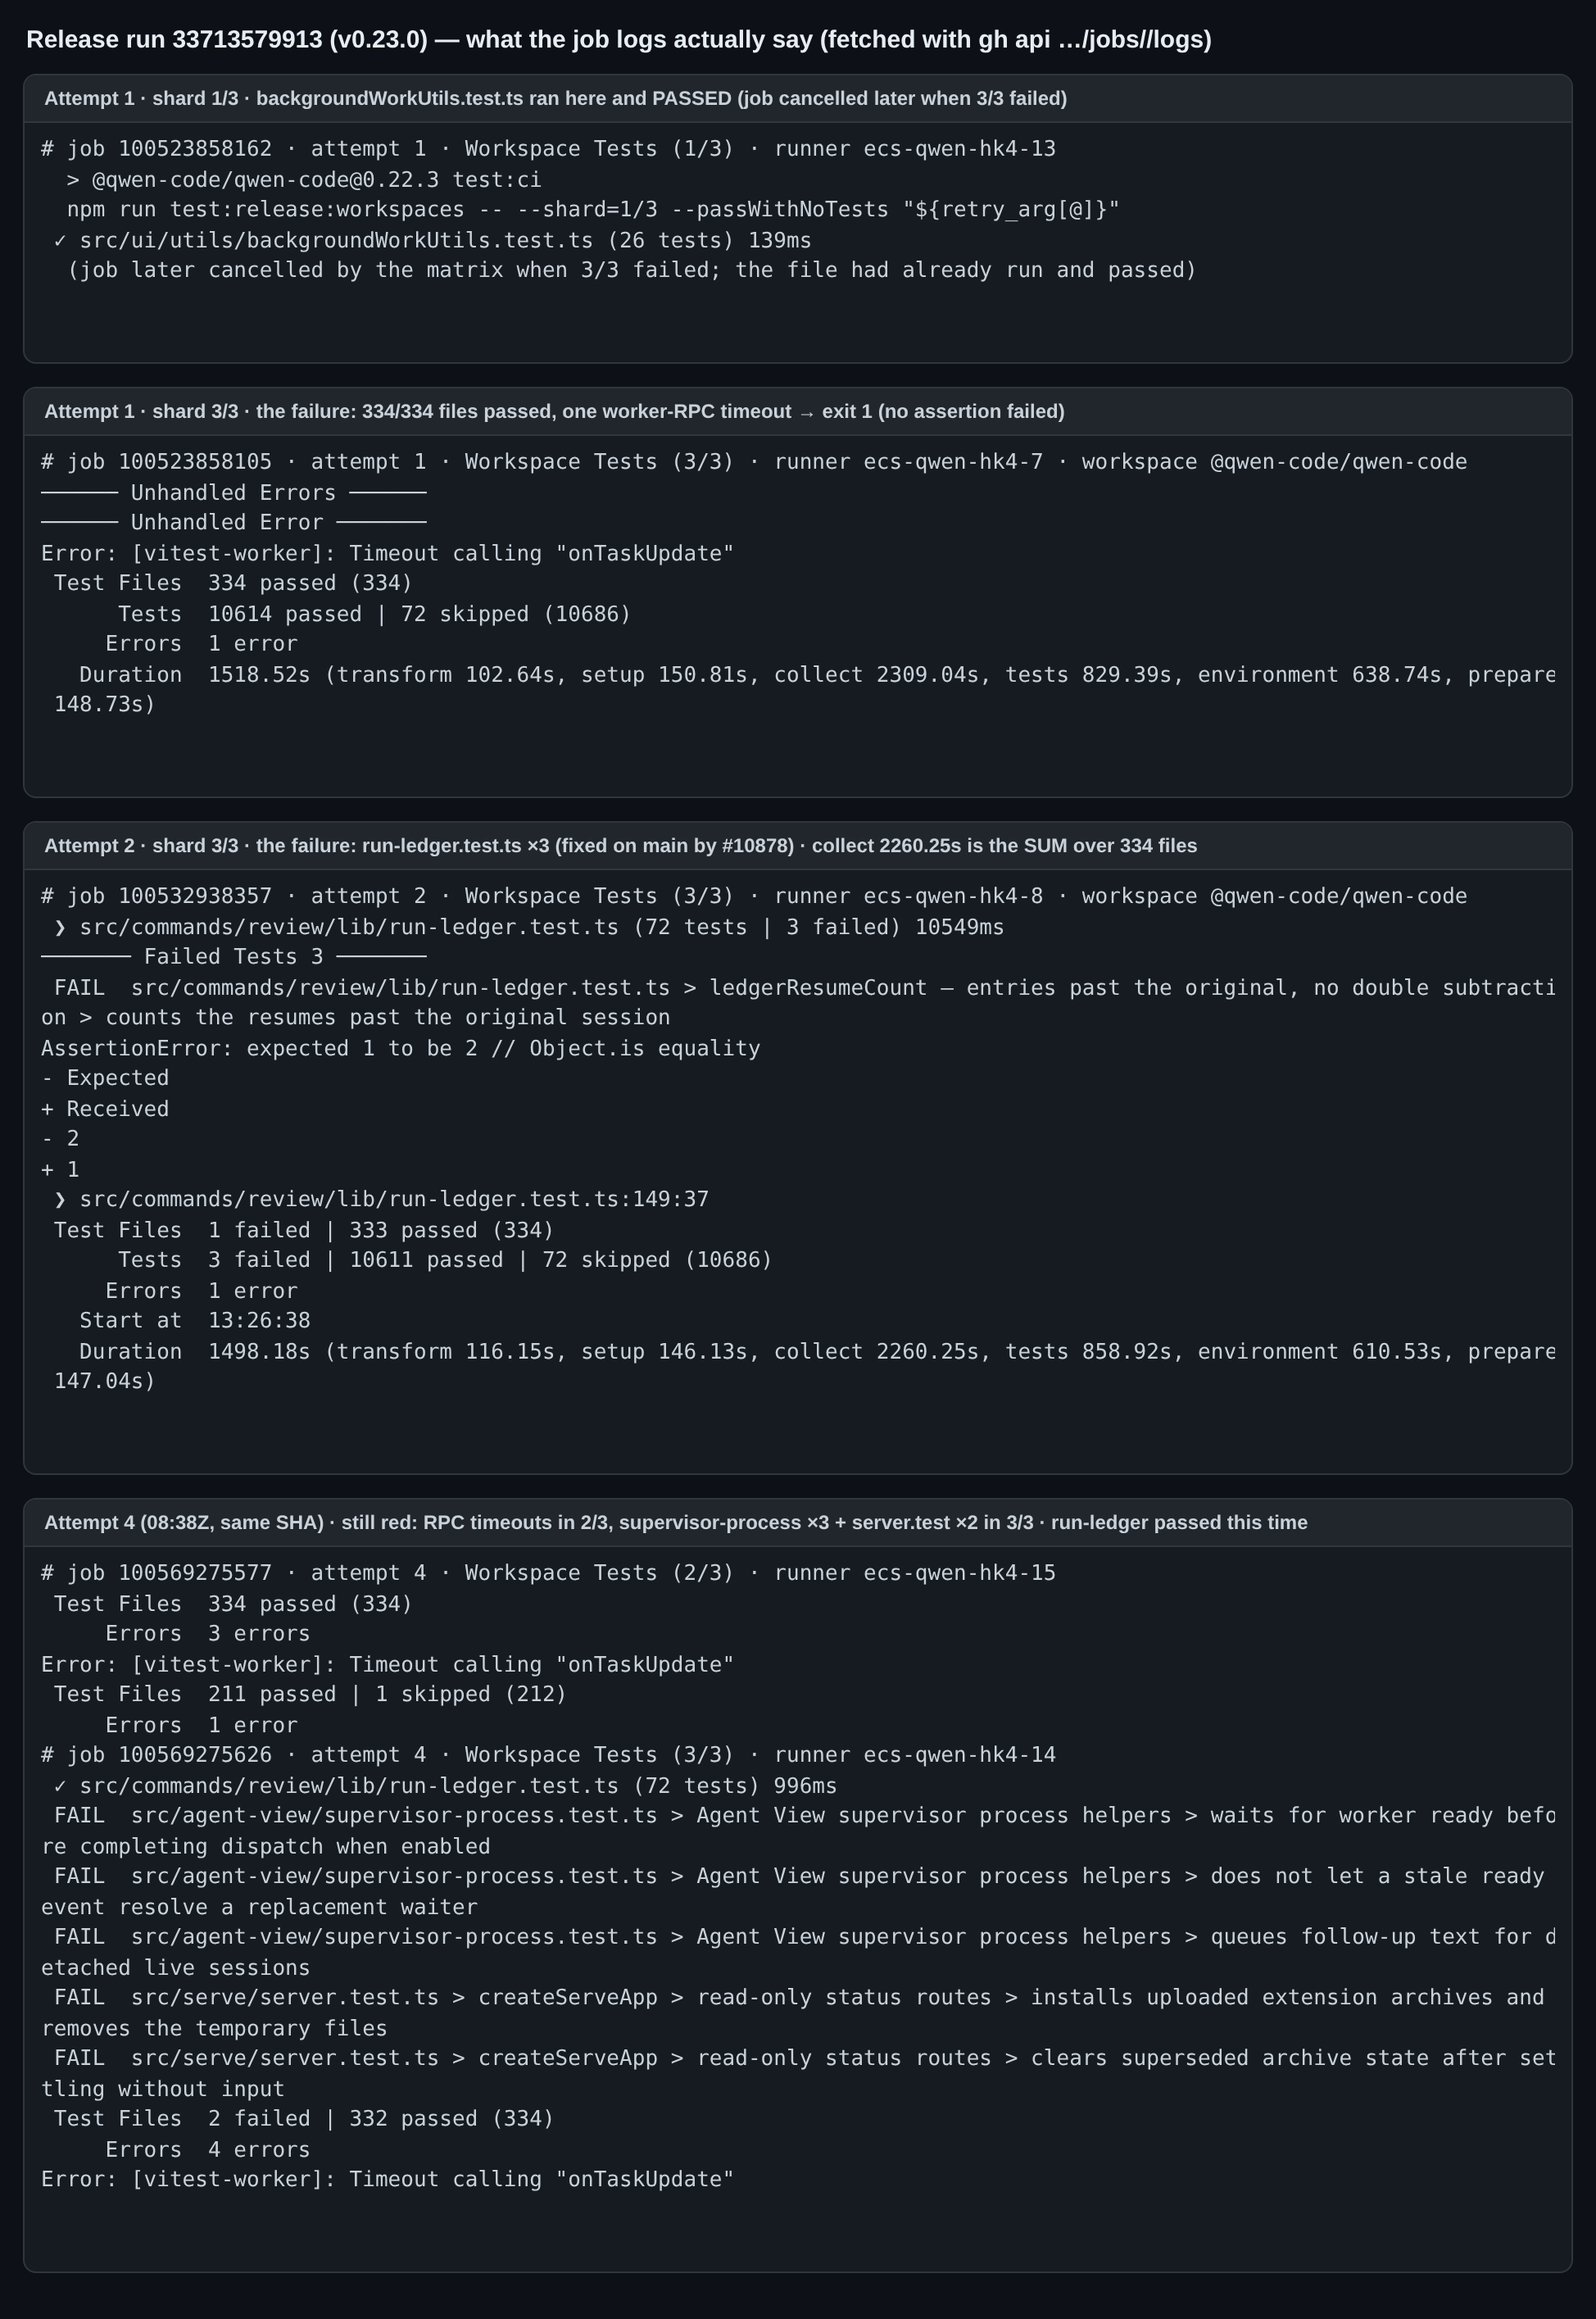
  1. This fixture never failed in run 33713579913. backgroundWorkUtils.test.ts runs in shard 1/3, and in both attempts where 1/3 executed it passed (26 tests, 139ms in attempt 1, 62ms in attempt 2). The quality gate was reddened by shard 3/3: attempt 1 = a [vitest-worker]: Timeout calling "onTaskUpdate" with 334/334 files green, attempt 2 = run-ledger.test.ts ×3 (fixed on main by test(review): stamp the ledger entries when the test runs, not when it loads #10878), attempt 4 (08:38Z, same frozen SHA) = RPC timeouts in 2/3 plus supervisor-process.test.ts ×3 and server.test.ts ×2 in 3/3. So "second instance, still live, in the same lane" is not what happened; this is a latent sibling found by the sweep, in a different shard.
  2. "2260 s collect-to-execute gap" is a misreading of vitest's summary. collect 2260.25s is the sum over 334 files across parallel workers — it exceeds the run's whole wall-clock Duration 1498.18s, which a single gap cannot do. The real exposure is the time between the describe body being evaluated and this it running (hooks, earlier tests in the file, a descheduled worker); the ledger file that did fail spent 10.5 s total in attempt 2 versus 0.74 s in attempt 1. The one-second threshold is real (shown below), the 38-minute figure is not.
  3. Fixes #10881 should be Refs #10881. Merging with Fixes auto-closes the release-failure issue, while the release is still red for unrelated reasons (attempt 4 above). Re-running attempts of that run cannot pick up test(review): stamp the ledger entries when the test runs, not when it loads #10878 or this PR either — the run is pinned to 03541895; only a fresh release from main can.

What I ran

# Experiment Base 19182d08 PR d0de394a
A PR's reviewer test plan: describe-scope now shifted back 2,260,000 ms 1 failed / 25 passed — (running 21h 37m 40s) 26 passed
A′ same, shift reverted 26 passed
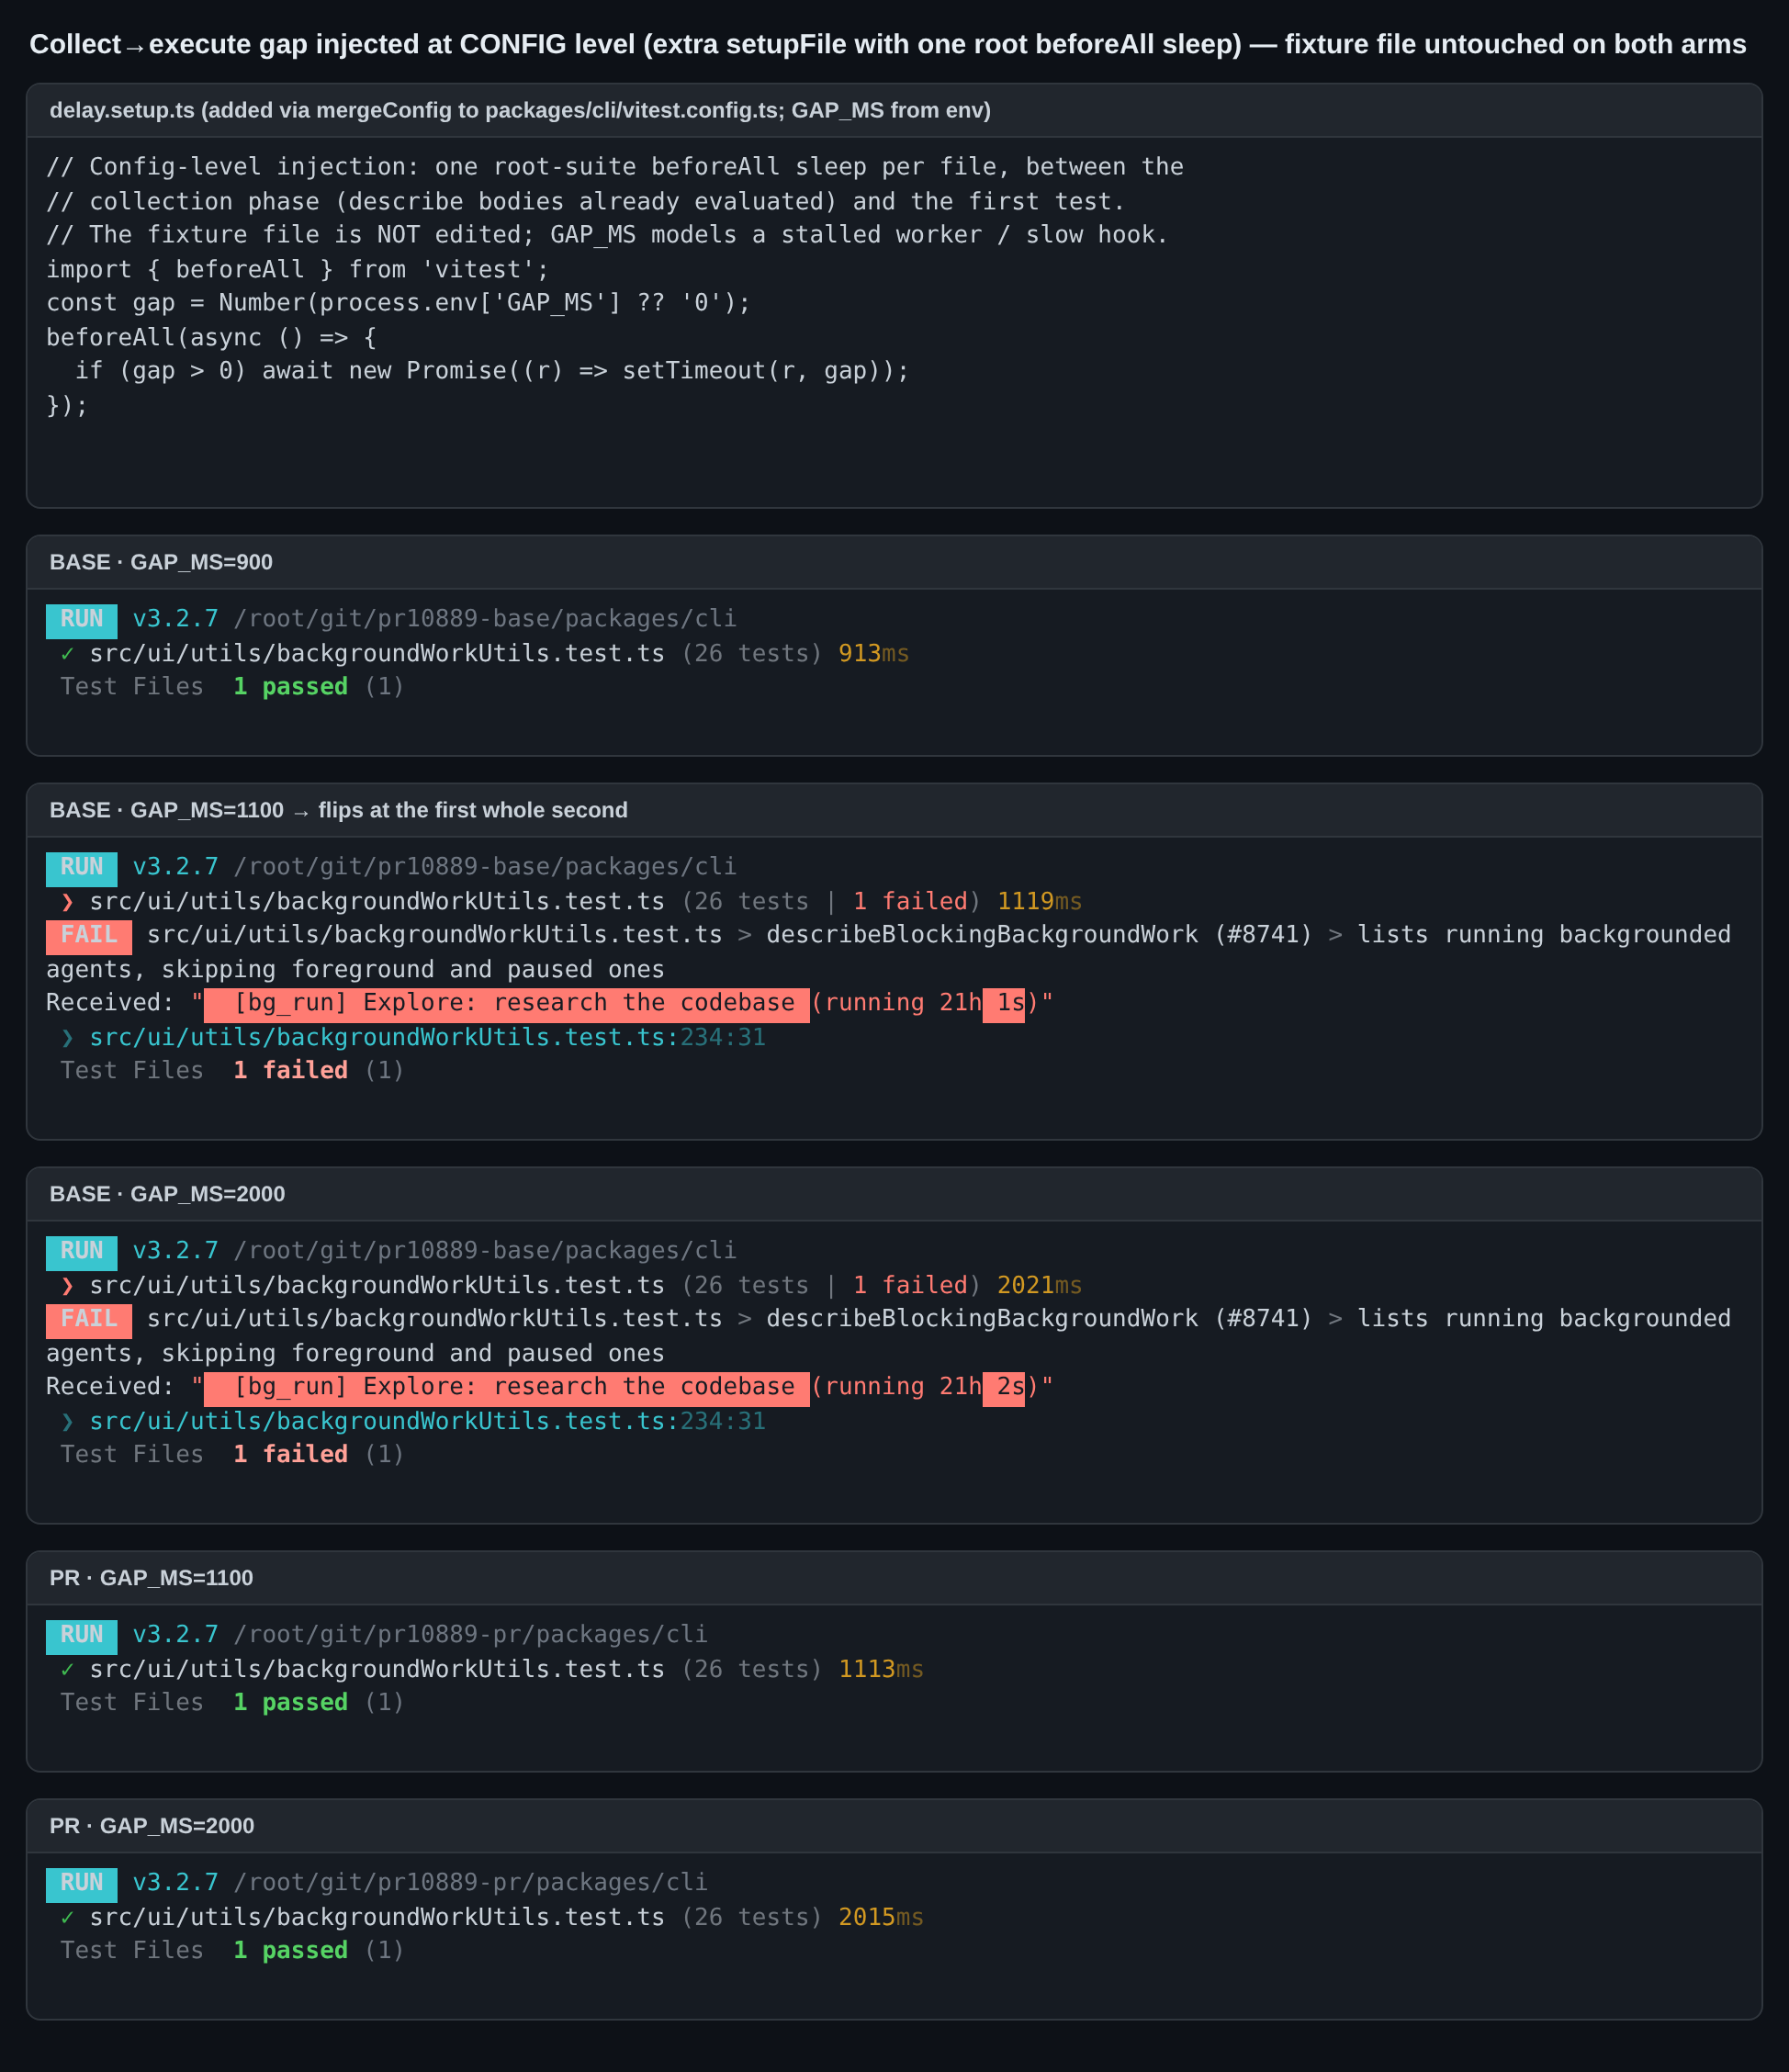
B Config-level gap injection (extra setupFiles entry with one root beforeAll sleep; fixture file untouched): GAP_MS = 0 / 900 / 1100 / 2000 pass / pass / fail 21h 1s / fail 21h 2s pass / pass / pass / pass
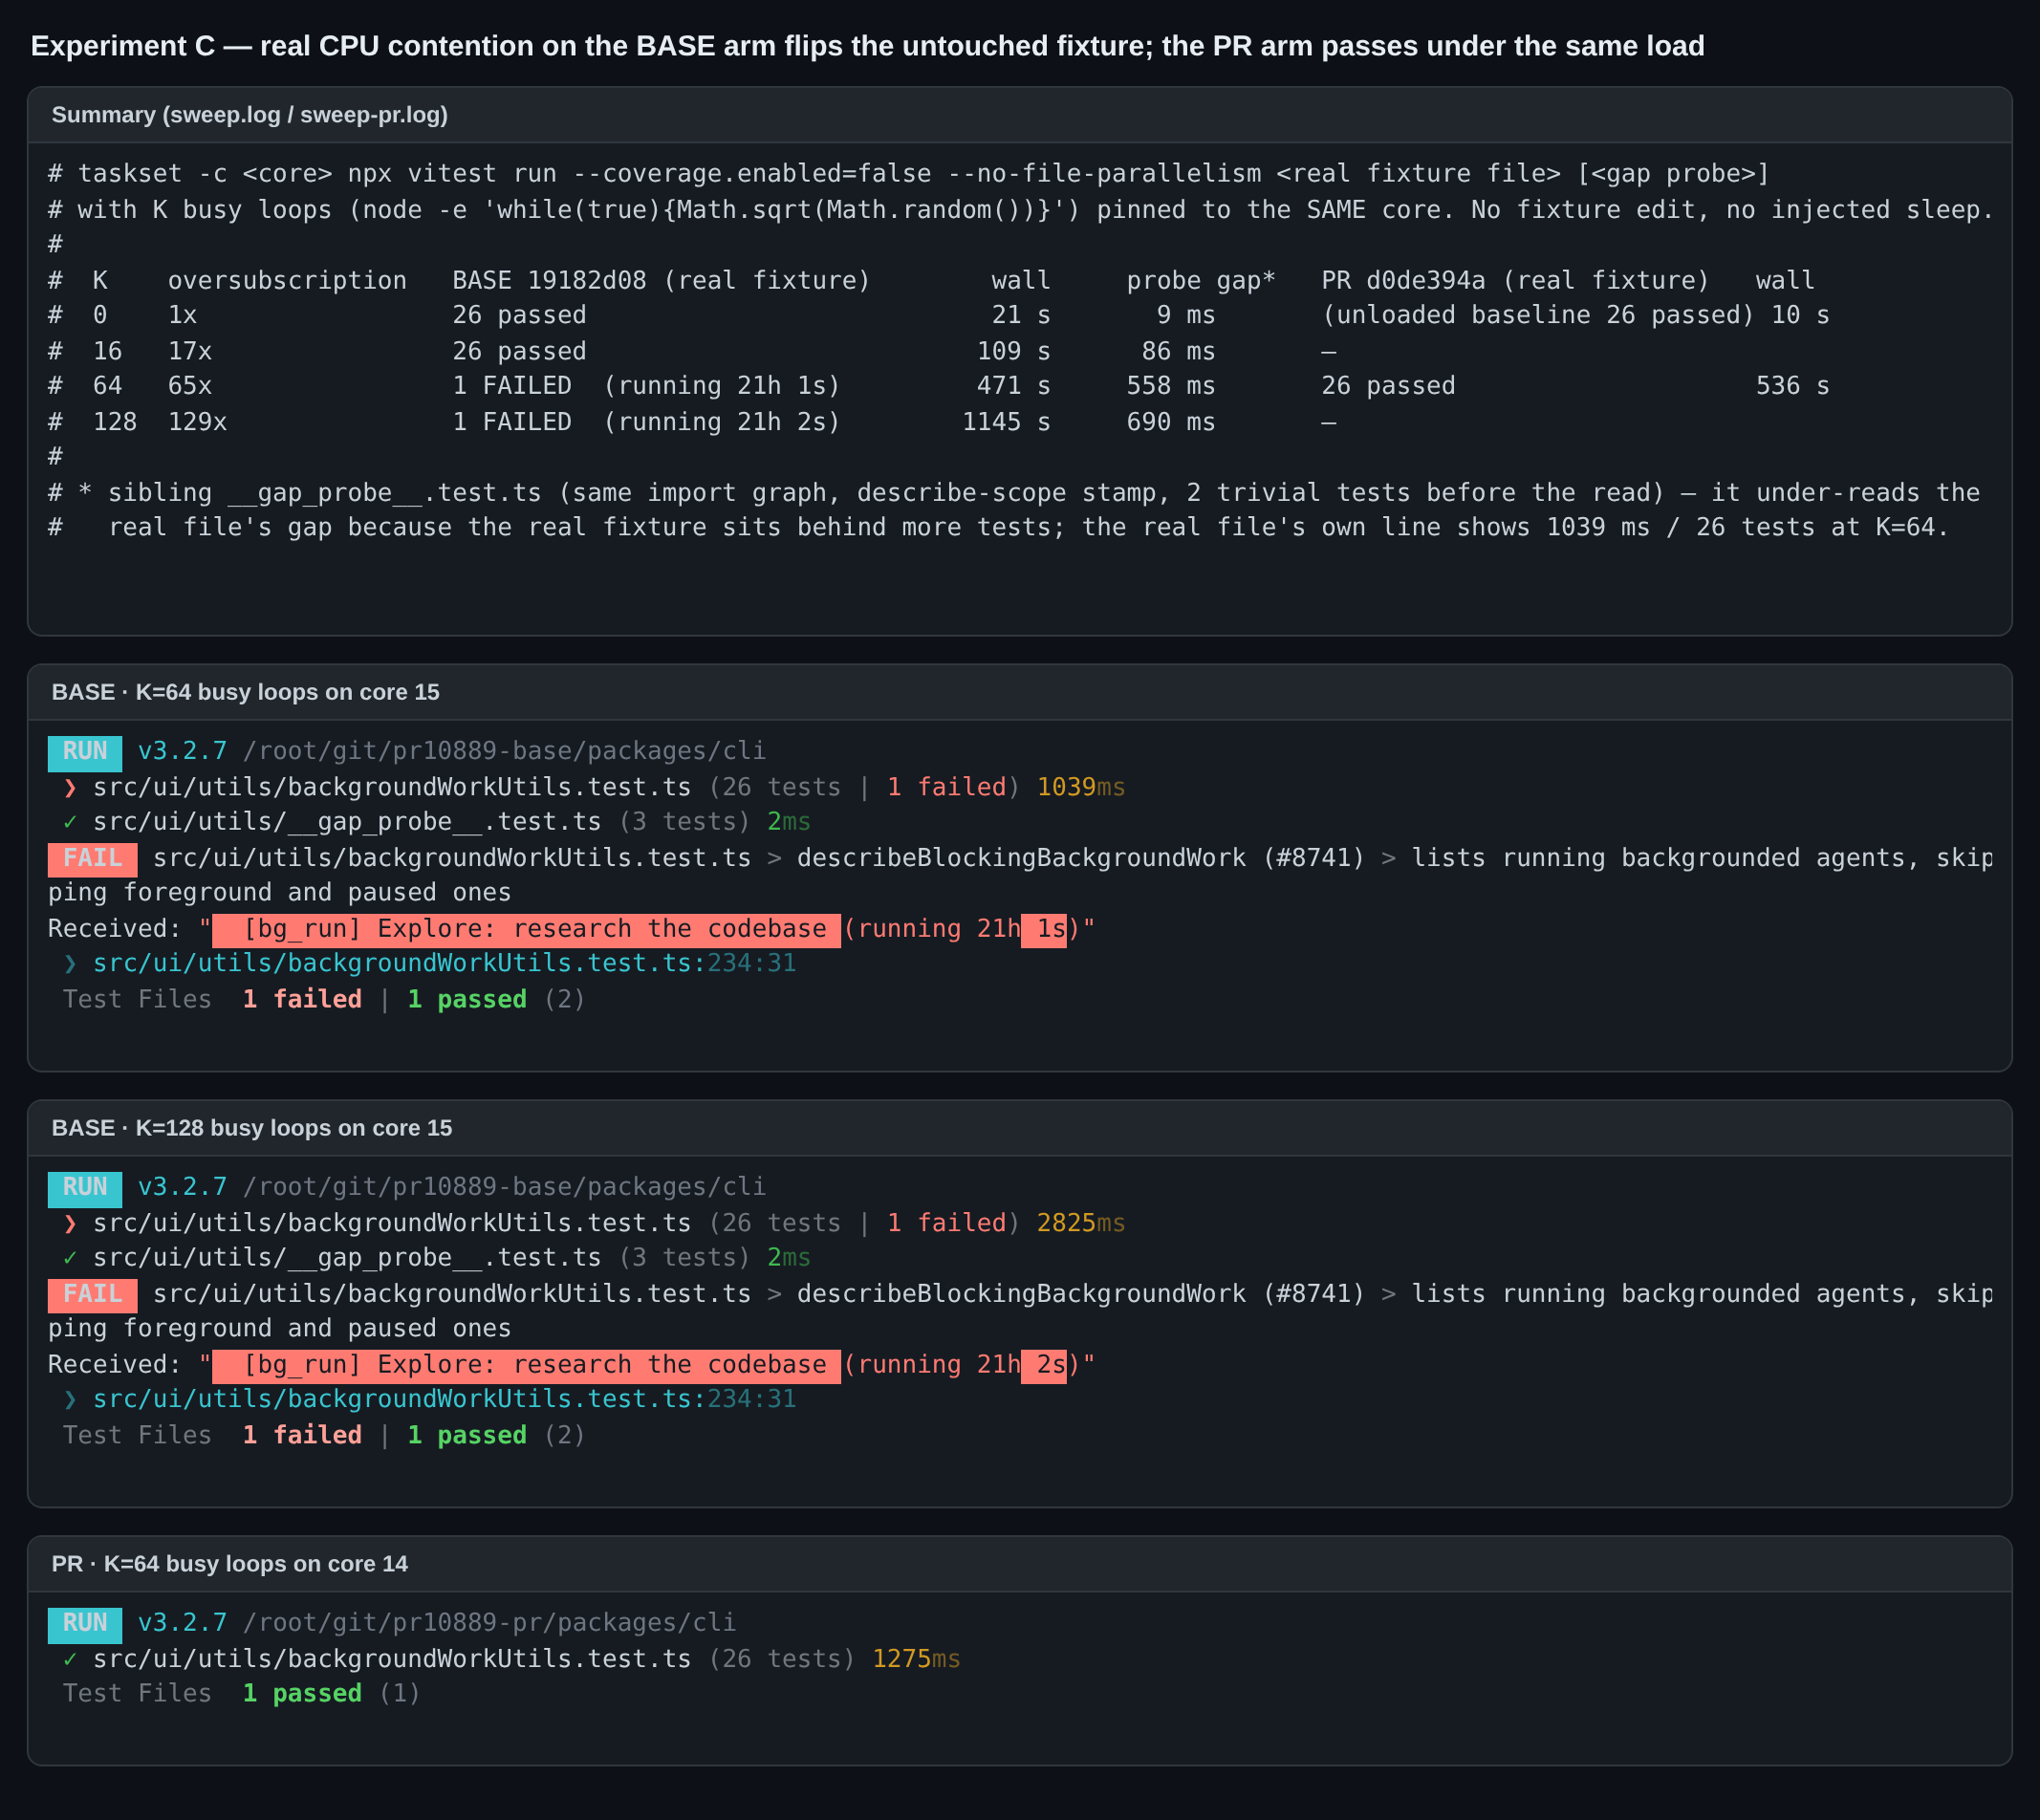
C Real CPU contention: taskset -c 15 + K busy loops on the same core, real fixture file + a sibling gap probe (--coverage.enabled=false, as CI) K=0 / 16 / 64 / 128 → pass / pass / fail 21h 1s / fail 21h 2s (wall 21 s / 109 s / 471 s / 1145 s) K=64 on a sibling core: 26 passed
D Independent TypeScript-AST class sweep at PR head (Date.now() / new Date() / performance.now() with no enclosing function other than describe/suite callbacks) 12 hits across 2172 test files = the PR's 15 minus its 3 class-method false positives; each of the other 11 inspected: 1-hour expiries, -10 s / -2 h wide margins, ordering-only or echo-only stamps same
E prettier --check, eslint --max-warnings 0 on the changed file; PR CI at posting time clean; Lint & Static, Test (ubuntu), Integration (no-AK) green, web-shell E2E smoke still running
F Diff audit 1 file, +5/−1; assertion at line 238 unchanged; the block's other now users (fg_run, bg_paused) are filtered out before rendering; the second describe (buildBackgroundWorkBlockedMessage) has no duration assertion

B is the experiment I'd point reviewers at: it reproduces the flip at exactly the first whole second without editing the fixture, and the PR arm passes at every gap. formatDuration floors seconds once the value is ≥ 60 s, so anything ≥ 1000 ms between the describe body and the call under test turns 21h into 21h Ns.

C is the one that settles "is this fixture really exposed?": at 65× oversubscription of one core the untouched base fixture flips on its own (21h 1s), and at 129× it reads 21h 2s, while the PR arm passes at K=64 under the same load. The ECS hosts that produced the onTaskUpdate RPC timeouts in attempts 1 and 4 are exactly that kind of starved worker, so the hazard is real even though this particular file did not happen to be the one that flipped in run 33713579913.

Screenshots

Release run 33713579913 — what the job logs say (attempt 1 shard 1/3 with this file passing; attempt 1 & 2 shard 3/3 failures; attempt 4 still red):

release-run logs

Experiment A — reviewer test plan replayed on both arms:

shift probe

Experiment B — collect→execute gap injected at config level, fixture untouched:

delay injection

Experiment C — real CPU contention (taskset + busy loops), no fixture edit:

contention

Experiment D — class sweep at PR head:

class sweep

Non-blocking suggestions (for the author / whoever merges)

  • N1 — change Fixes #10881 to Refs #10881 (see verdict 3).
  • N2 — the new comment says the stamp "reads 21h plus however long collecting took"; the accurate statement is "plus whatever elapses between this describe body and the call under test, which is ≥ 1 s on a starved worker". The PR body's and the bot report's "2260 s gap" / "same lane" sentences deserve the same correction, otherwise the next reader will go looking for a 38-minute collection stall that never existed per file.
  • N3 — optional hardening: the block still carries a describe-scope now (line 175) for entries that render no duration. That is fine today, but any future fixture in this block that asserts a duration will fall into the same trap; a tiny startedAgo(ms) helper evaluated inside the it would make the safe form the default.

Reproduce

# worktrees: base = 19182d08 (merge-base), pr = d0de394a; deps symlinked from a built checkout
cd packages/cli
CI=true npx vitest run src/ui/utils/backgroundWorkUtils.test.ts                       # both arms: 26 passed
# A: sed -i '175s/const now = Date.now();/const now = Date.now() - 2_260_000;/' <file>  → base 1 failed, pr 26 passed
# B: extra setup file with `beforeAll(() => sleep(Number(process.env.GAP_MS)))`, merged via mergeConfig(base, { test: { setupFiles: [...] } })
GAP_MS=1100 CI=true npx vitest run --config vitest.delay.config.ts src/ui/utils/backgroundWorkUtils.test.ts
# logs: gh api repos/QwenLM/qwen-code/actions/jobs/<100523858162|100523858105|100532938357|100569275626>/logs
中文说明

PR #10889 本地验证 —— 真实发布 run 日志 + A/B 环境

我在本地建了两个 worktree(base 19182d08 = 该 PR 在 main 上的 merge-base;PR head d0de394a),拉取了发布 run 33713579913 的真实作业日志(autofix 流程拿不到),并在两条臂上做了三组独立实验加一次同类普查。截图托管在我的 fork 上;所有命令都可按下方说明复现。

结论

这一行改动本身是对的,值得合入 —— 它消除了夹具里一个真实存在的亚秒级时序隐患,断言未动,lint/prettier 干净,同类普查与 PR 自己的清单一致。但围绕它的叙述与 run 日志不符,其中一条需要在合并前处理:

  1. 这个夹具在 run 33713579913 里从未失败过。 backgroundWorkUtils.test.ts 跑在 1/3 分片,1/3 执行过的两次 attempt 里它都通过了(attempt 1 26 tests, 139ms,attempt 2 62ms)。把 quality 关卡弄红的是 3/3 分片:attempt 1 = [vitest-worker]: Timeout calling "onTaskUpdate"(334/334 文件全绿),attempt 2 = run-ledger.test.ts ×3(已由 test(review): stamp the ledger entries when the test runs, not when it loads #10878main 修复),attempt 4(08:38Z,同一个冻结 SHA)= 2/3 的 RPC 超时 + 3/3 的 supervisor-process.test.ts ×3 与 server.test.ts ×2。所以"同一 lane 里仍然存活的第二实例"并不是实际发生的事;它是普查发现的一个潜在兄弟,而且在另一个分片。
  2. "2260 秒的收集到执行间隔"是对 vitest 汇总行的误读。 collect 2260.25s334 个文件在并行 worker 上的总和 —— 它比整个 run 的挂钟 Duration 1498.18s 还长,单个间隔不可能做到。真实的暴露是 describe 体求值到该 it 执行之间的时间(hook、文件内更早的测试、被调度出去的 worker);真正挂掉的 ledger 文件在 attempt 2 总共用了 10.5 秒,attempt 1 只用 0.74 秒。1 秒阈值是真的(见下),38 分钟不是。
  3. Fixes #10881 应改为 Refs #10881Fixes 合并会自动关闭发布失败 issue,而发布因不相关原因仍然是红的(见上面的 attempt 4)。重跑该 run 的 attempt 也拿不到 test(review): stamp the ledger entries when the test runs, not when it loads #10878 或本 PR —— run 钉在 03541895;只有从 main 重新发起一次发布才行。

我跑了什么

# 实验 Base 19182d08 PR d0de394a
A PR 的评审测试计划:describe 作用域的 now 回拨 2,260,000 ms 1 failed / 25 passed —— (running 21h 37m 40s) 26 passed
A′ 同上,撤销回拨 26 passed
B 配置级间隔注入(额外的 setupFiles 条目,一个根级 beforeAll sleep;夹具文件不改):GAP_MS = 0 / 900 / 1100 / 2000 pass / pass / fail 21h 1s / fail 21h 2s pass / pass / pass / pass
C 真实 CPU 争用:taskset -c 15 + 同核 K 个忙循环,真实夹具文件 + 一个同构的间隔探针(--coverage.enabled=false,与 CI 一致) K=0 / 16 / 64 / 128 → pass / pass / fail 21h 1s / fail 21h 2s (wall 21 s / 109 s / 471 s / 1145 s) K=64(另一个核):26 passed
D 在 PR head 上独立做 TypeScript-AST 同类普查(Date.now() / new Date() / performance.now(),外层除 describe/suite 回调外无函数) 2172 个测试文件中 12 处 = PR 的 15 减去其 3 处类方法误报;其余 11 处逐一看过:1 小时过期、-10 s / -2 h 的宽裕边界、仅排序或仅回显的时间戳
E 对改动文件跑 prettier --checkeslint --max-warnings 0;发评论时的 PR CI 干净;Lint & Static、Test (ubuntu)、Integration (no-AK) 绿,web-shell E2E smoke 仍在跑
F diff 审计 1 个文件,+5/−1;第 238 行断言未变;该块里其他用 now 的条目(fg_runbg_paused)在渲染前被过滤掉;第二个 describebuildBackgroundWorkBlockedMessage)没有时长断言

我最推荐评审者看 B:它在不改夹具的情况下精确复现了"第一个整秒翻转",而 PR 臂在所有间隔下都通过。formatDuration 在值 ≥ 60 秒后对秒向下取整,所以 describe 体与被测调用之间只要 ≥ 1000 ms,21h 就变成 21h Ns

C 回答的是“这个夹具是不是真的暴露”:单核 65 倍超订下,未改动的 base 夹具自行翻转(21h 1s),129 倍时读作 21h 2s,而 PR 臂在同等负载 K=64 下通过。在 attempt 1 和 4 里产生 onTaskUpdate RPC 超时的 ECS 主机正是这种被饿死的 worker,所以隐患是真实的——尽管在 run 33713579913 里碰巧翻转的不是这个文件。

截图

发布 run 33713579913 —— 作业日志实际内容(attempt 1 的 1/3 分片里本文件通过;attempt 1、2 的 3/3 失败;attempt 4 仍红):

release-run logs

实验 A —— 在两条臂上复刻评审测试计划:

shift probe

实验 B —— 配置级注入收集→执行间隔,夹具不改:

delay injection

实验 C —— 真实 CPU 争用(taskset + 忙循环),不改夹具:

contention

实验 D —— PR head 上的同类普查:

class sweep

非阻塞建议(给作者 / 合并者)

  • N1 —— 把 Fixes #10881 改成 Refs #10881(见结论 3)。
  • N2 —— 新注释写的是时间戳"读作 21h 加上收集花掉的全部时间";准确的说法是"加上本 describe 体与被测调用之间流逝的时间,在被饿死的 worker 上会 ≥ 1 秒"。PR 描述和 bot 报告里"2260 秒间隔"/"同一 lane"的句子也应同样修正,否则下一位读者会去找一个单文件层面从未存在过的 38 分钟收集停顿。
  • N3 —— 可选加固:该块仍保留一个 describe 作用域的 now(第 175 行)给不渲染时长的条目用。今天没问题,但该块里将来任何断言时长的夹具都会掉进同一个坑;一个在 it 内求值的小 helper startedAgo(ms) 能让安全形式成为默认。

复现

# worktree:base = 19182d08(merge-base),pr = d0de394a;依赖从已构建的检出 symlink
cd packages/cli
CI=true npx vitest run src/ui/utils/backgroundWorkUtils.test.ts                       # 两臂均 26 passed
# A:sed -i '175s/const now = Date.now();/const now = Date.now() - 2_260_000;/' <file>  → base 1 failed,pr 26 passed
# B:额外 setup 文件 `beforeAll(() => sleep(Number(process.env.GAP_MS)))`,用 mergeConfig(base, { test: { setupFiles: [...] } }) 合入
GAP_MS=1100 CI=true npx vitest run --config vitest.delay.config.ts src/ui/utils/backgroundWorkUtils.test.ts
# 日志:gh api repos/QwenLM/qwen-code/actions/jobs/<100523858162|100523858105|100532938357|100569275626>/logs

🤖 Generated with Claude Code — Claude Fable 5.1

@qwen-code-ci-bot qwen-code-ci-bot left a comment

Copy link
Copy Markdown
Collaborator

Choose a reason for hiding this comment

The reason will be displayed to describe this comment to others. Learn more.

LGTM, looks ready to ship — CI landed green after the review. ✅

@wenshao
wenshao added this pull request to the merge queue Sep 3, 2026
Merged via the queue into main with commit 5d915d1 Sep 3, 2026
59 of 60 checks passed
@qwen-code-dev-bot

Copy link
Copy Markdown
Collaborator Author

🕐 Review received — an automatic review of the current head is still running, so this round is held until it lands (a push now would cancel it and discard its work, #8888). Your feedback stays queued for the next eligible round.

中文说明

🕐 已收到评审 —— 当前 head 上仍有一轮自动 review 在运行,本轮暂缓(现在推送会取消该 review 并丢弃其工作,#8888)。反馈保持排队,等待下一次可运行的轮次处理。

@qwen-code-ci-bot

Copy link
Copy Markdown
Collaborator

Released in v0.23.0.

Sign up for free to join this conversation on GitHub. Already have an account? Sign in to comment

Labels

None yet

Projects

None yet

Development

Successfully merging this pull request may close these issues.

Release Failed for v0.23.0 on 2026-09-03

3 participants