Single Qubit Transition Visualization#3561
Conversation
This new feature helps visualize what exactly happens to a qubit
after applying a sequence of gates. Can be called with
visualize_transition(['X','Y','S','T']). Additional arguments are
jupyter=bool which decides whether HTML video will be returned in
case this function was called from jupyter notebook (as jupyter
can't handle interactive tkinter GUI plots). If jupyter=False, it
is assumed that the function was called from non-jupyter source
and interactive tkinter GUI will be shown. Another argument is
saveas=str which, if defined, will tell the function to save the
animation as a video file on the system, for example "movie.mp4".

It should be noted that encoding the animation into a video
(jupyter=True or saveas!=None) takes significant CPU time
and any tests
|
|
| except ImportError: | ||
| HAS_IPYTHON = False | ||
|
|
||
| from qiskit.visualization.bloch import Bloch |
There was a problem hiding this comment.
This import needs to be moved into the the try block before HAS_MATPLOTLIB, or alternatively needs to be inside an if HAS_MATPLOTLIB block. Normally what I suggest is just use the HAS_MATPLOTLIB variable from another module, like:
from qiskit.visualization.matplotlib import HAS_MATPLOTLIB

if HAS_MATPLOTLIB:
    from matplotlib import pyplot as plt
    from matplotlib import animation
    from mpl_toolkits.mplot3d import Axes3D
    from qiskit.visualization.bloch import Bloch
The test failure you're hitting is caused by matplotlib's default backend for osx does not work on every osx installation of python, which includes the CI nodes. So when pyplot gets imported it raises an exception. This is the main reason why we have all the visualization code and dependencies as optional features of terra and why all the other matplotlib imports are in try blocks or if blocks to make sure we don't unconditionally import matplotlib at the module level.
There was a problem hiding this comment.
Thank you for your help.
I tried to use what you suggested,
from qiskit.visualization.matplotlib import HAS_MATPLOTLIB

if HAS_MATPLOTLIB:
    from matplotlib import pyplot as plt
    from matplotlib import animation
    from mpl_toolkits.mplot3d import Axes3D
    from qiskit.visualization.bloch import Bloch
The thing is, if I import matplotlib from the package visualization, it means I won't be able to import the actual package matplotlib which contains subpackage animation. I could make it so visualization/matplotlib.py includes animation but I'm not sure if it's okay.
Also with this approach the imports from qiskit.visualization.matplotlib import HAS_MATPLOTLIB and from qiskit.visualization.bloch import Bloch makes pylint complain that they're ungrouped.
And so my code is
try:
    from matplotlib import pyplot as plt
    from matplotlib import animation
    from mpl_toolkits.mplot3d import Axes3D
    from qiskit.visualization.bloch import Bloch
    from qiskit.visualization.exceptions import VisualizationError
    HAS_MATPLOTLIB = True
And pylint is happy.
Is it okay or should I rather do as you suggest and import visualization/matplotlib.py and change it so that it includes animation subpackage too even if it means imports will be ungrouped and pylint will be unhappy?
|
Thanks for your contribution. It looks like one needs This takes a few minutes to generate the animation for me. Is it the same for you? Can you use the same lower-case notation for gates as used in qiskit? Based on the gates that you support, it should be straightforward to also support |
|
Hi @welien , any update on this? |
…control over performance tuning with fpg and spg optional arguments.
|
Okay so: The tool was changed to take QuantumCircuit as the first argument instead of a list of strings. As long as it is a single-qubit circuit, the result will be an animation. Now it supports h, x, y, z, rx, ry, rz, s, sdg, t, tdg, u1 gates. I didn't add ffmpeg as dependency in the file as you recommended, it's not a python library, it's a system library. Often video codecs are already installed on systems and Matplotlib automatically picks whichever suits it the best. If not, it will give user an error from Matplotlib saying that it doesn't have ffmpeg. It can be easily installed following instructions here: FFMPEG Concerning performance issues, there are no issues when the code is run from terminal - tkinter GUI is ok. The only problem is jupyter and that's because the animation must be converted into images and the images together into a video - that's why the video codec is required. I couldn't find any other way to do this. What I did however, was that I added two more arguments to the function, fpg (frames per gate) and spg (seconds per gate) which can be tuned for faster rendering in jupyter. Default is 100 frames per gate and in jupyter it is really slow. But try fpg=20 and spg=2, rendering is much faster and it's still OK as an animation. With high fpg the animation is smooth while low fpg makes it less useful as a visualization tool. I also changed it so that in jupyter it returns a javascript video utility instead of a HTML video. Makes it more interactive. |
|
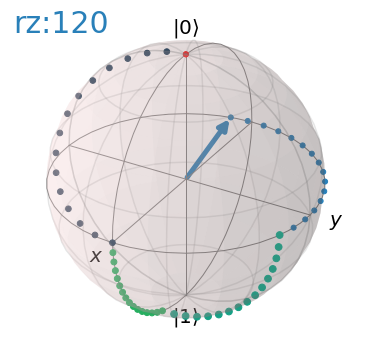
Cool, this is working well. Just two minor comments below, let me know if you agree and would like to work on them as enhancements. Regardless, I'll approve this. 1- Instead of having an explicit 2- For the trace option I think it would be nice to do dotted lines on the surface of the sphere and keep the entire history. That way the entire trajectory is clear, and one could also use the final image to show the trajectory statically. Right now it shows arrows, and erases earlier history as it goes along: |
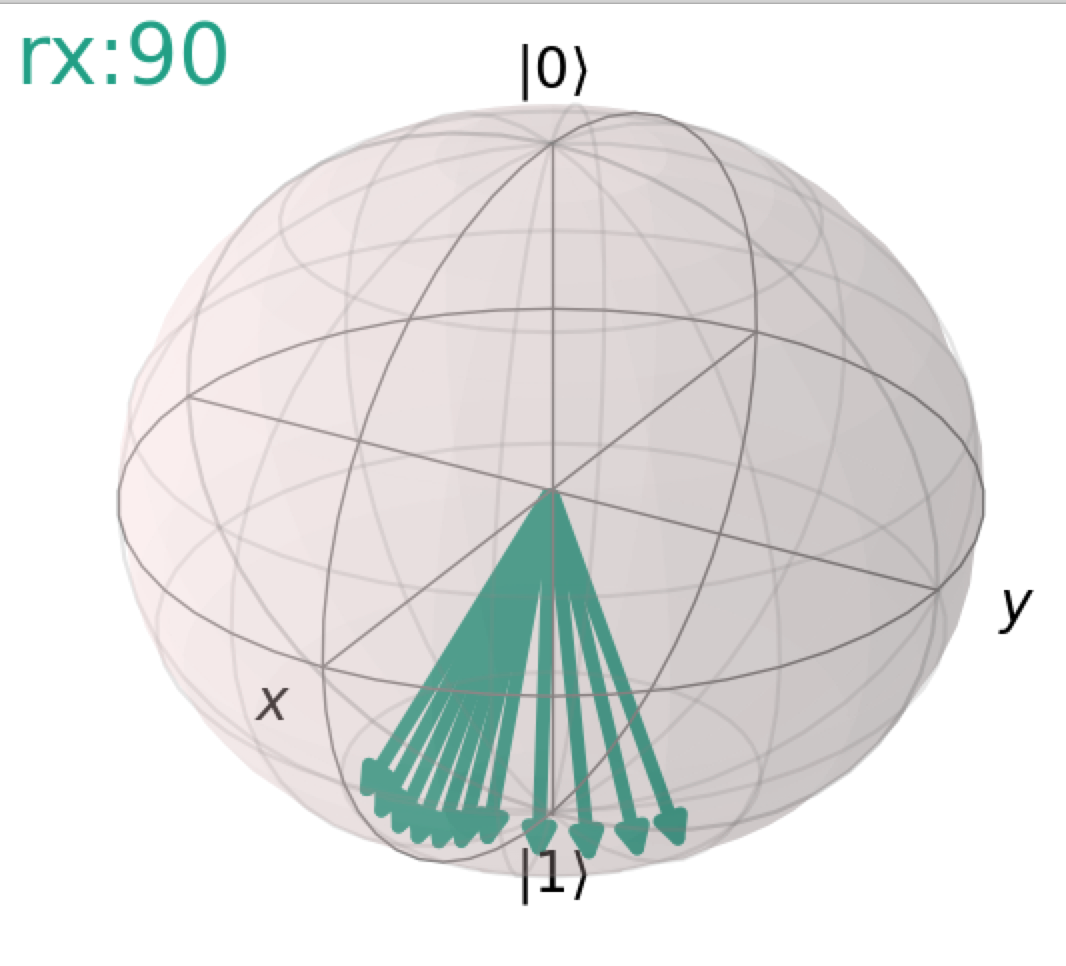
…tically without user. Traces are no longer arrows, they are points on bloch sphere and they remain on the sphere.
|
|
@welien Awesome thanks for the good work. |
* Single Qubit Transition Visualization Animation

This new feature helps visualize what exactly happens to a qubit
after applying a sequence of gates. Can be called with
visualize_transition(['X','Y','S','T']). Additional arguments are
jupyter=bool which decides whether HTML video will be returned in
case this function was called from jupyter notebook (as jupyter
can't handle interactive tkinter GUI plots). If jupyter=False, it
is assumed that the function was called from non-jupyter source
and interactive tkinter GUI will be shown. Another argument is
saveas=str which, if defined, will tell the function to save the
animation as a video file on the system, for example "movie.mp4".

It should be noted that encoding the animation into a video
(jupyter=True or saveas!=None) takes significant CPU time
and any tests

* Used wrong function name in release file example, it's good now.

* Slowed down animation by half

* Linting errors corrected

* Support for py35 string formatting

* Another string formatting error for py35 fixed

* MacOS import error of matplotlib fixed

* visualize_transition now takes QuantumCircuit as its argument. Finer control over performance tuning with fpg and spg optional arguments.

* Update qiskit/visualization/transition_visualization.py

* The decision whether to use HTML GUI or tkinter GUI is decided automatically without user. Traces are no longer arrows, they are points on bloch sphere and they remain on the sphere.

Co-authored-by: Ali Javadi-Abhari <ajavadia@users.noreply.github.com>
Summary
This new function allows users to visualize what is happening to a single qubit when a sequence of gates are applied to it.
Details and comments
It uses matplotlib to create an animation which is presented in GUI when called from terminal. If user wants to use it in jupyter notebook, they should pass jupyter=True as argument and the animation will be converted into a video which then can be shown in the notebook. User can also save the video in desired location on their disk. The only downside is that converting the animation into video takes a bit longer.
Also, only X, Y, Z, S, SDG, H and T gates supported.
I am not including any tests since, as far as I know, there is no straightforward way to test visualization.
Documentation has been updated, I added a release note and I read the CONTRIBUTING document.