Wrap inset #788
There are no files selected for viewing
| Original file line number | Diff line number | Diff line change |
|---|---|---|
| @@ -0,0 +1,26 @@ | ||
| """ | ||
| Inset | ||
| ----- | ||
|
|
||
| The :meth:`pygmt.Figure.inset` method creates adds an inset figure inside a larger | ||
| figure. The function is called using a ``with`` statement, and it's position, | ||
| border, offset, and margin parameters are set. Within the ``with`` statement, | ||
| pygmt plotting functions can be called that add to the inset figure. | ||
| """ | ||
| import pygmt | ||
|
|
||
| fig = pygmt.Figure() | ||
| # Create the primary figure, setting the region to Madagascar, the land color to | ||
| # "brown", the water to "lightblue", the shorelines width to "thin", and adding a frame | ||
| fig.coast(region="MG+r2", land="brown", water="lightblue", shorelines="thin", frame="a") | ||
| # Create an inset, setting the position to top left, the width to 3.5 centimeters, and | ||
| # the x-offset to 0.2 centimeters. The margin is set to 0, and the border is "green". | ||
|
willschlitzer marked this conversation as resolved.
Outdated
|
||
| with fig.inset(position="jTL+w3.5c+o0.2c", margin=0, box="+pgreen"): | ||
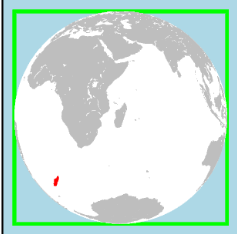
| # Create a figure in the inset using coast. This example uses the azimuthal | ||
| # orthogonal projection centered at 47E, 20S. The 4 centimeter width of this figure | ||
| # extends beyond the inset width, and isn't shown. The land is set to "gray" and | ||
| # Madagascar is highlighted in "red". | ||
|
willschlitzer marked this conversation as resolved.
|
||
| fig.coast( | ||
| region="g", projection="G47/-20/3.5c", land="gray", water="white", dcw="MG+gred" | ||
| ) | ||
|
Comment on lines
+23
to
+24
Member
There was a problem hiding this comment. Something's wrong with the inset coloring of Madagascar here, can you double-check?
Contributor
Author
There was a problem hiding this comment. I think this may have to do with using "M?c" for the projection; I'll test the old formatting and see if that fixes it.
Contributor
Author
Member
There was a problem hiding this comment.
I don't get it. What's the problem? Why changing
Contributor
Author
There was a problem hiding this comment. The issue is that the dcw argument doesn't paint in the correct area on the inset. I'm not sure how specifying the width fixed the problem, but it appears to have done so.
Member
There was a problem hiding this comment. Oh yes, you're right. Please forgive my bad knowledge about the location of Madagascar. It looks like an upstream GMT bug to me. Do you want to try to reproduce the issue using GMT CLI? If you can reproduce it using GMT CLI, then we should report it to upstream
Member
There was a problem hiding this comment. If you want to try, you can follow this comment (#573 (comment), it requires GMT dev version) to create the equivalent GMT script. Otherwise, I'll do it later.
Contributor
Author
There was a problem hiding this comment. I'll give it a go; about time I relearned how to use actual GMT!
Member
There was a problem hiding this comment. I've reported the bug to upstream GenericMappingTools/gmt#4757 |
||
| fig.show() | ||
| Original file line number | Diff line number | Diff line change |
|---|---|---|
| @@ -0,0 +1,109 @@ | ||
| """ | ||
| Adding an inset to the figure | ||
| ============================= | ||
|
|
||
| To plot an inset figure inside another larger figure, we can use the | ||
| :meth:`pygmt.Figure.inset` method. After a large figure has been created, | ||
| call ``inset`` using a ``with`` statement, and new plot elements will be | ||
| added to the inset figure instead of the larger figure. | ||
| """ | ||
|
willschlitzer marked this conversation as resolved.
|
||
|
|
||
| import pygmt | ||
|
|
||
| ######################################################################################## | ||
| # | ||
| # Prior to creating an inset figure, a larger figure must first be plotted. In the | ||
| # example below, :meth:`pygmt.Figure.coast` is used to create a map of the US state of | ||
| # Massachusetts. | ||
|
|
||
| fig = pygmt.Figure() | ||
| fig.coast( | ||
| region=[-74, -69.5, 41, 43], # Set bounding box of the large figure | ||
| borders="2/thin", # Plot state boundaries with thin lines | ||
| shorelines="thin", # Plot coastline with thin lines | ||
| projection="M15c", # Set Mercator projection and size of 15 centimeter | ||
| land="lightyellow", # Color land areas light yellow | ||
| water="lightblue", # Color water areas light blue | ||
| frame="a", # Set frame with annotation and major tick spacing | ||
| ) | ||
| fig.show() | ||
|
|
||
| ######################################################################################## | ||
| # | ||
| # The :meth:`pygmt.Figure.inset` method uses a context manager, and is called using a | ||
| # ``with`` statement. The ``position`` argument, including the inset width, is required | ||
| # to plot the inset. Using the **j** argument, the location of the inset is | ||
| # set to one of 9 grid squares (bottom-middle-top and left-center-right) be set. In the | ||
|
willschlitzer marked this conversation as resolved.
Outdated
|
||
| # example below, ``BL`` sets the inset to the bottom left. The ``box`` argument can | ||
|
willschlitzer marked this conversation as resolved.
|
||
| # set the fill and border of the inset. In the example below, ``+pblack`` sets the | ||
| # border color to black and ``+gred`` sets the fill to red. | ||
|
|
||
| fig = pygmt.Figure() | ||
| fig.coast( | ||
| region=[-74, -69.5, 41, 43], | ||
| borders="2/thin", | ||
| shorelines="thin", | ||
| projection="M15c", | ||
| land="lightyellow", | ||
| water="lightblue", | ||
| frame="a", | ||
| ) | ||
| with fig.inset(position="jBL+w3c", box="+pblack+glightred"): | ||
| # pass is used to exit the with statement as no plotting functions are called | ||
| pass | ||
| fig.show() | ||
|
|
||
| ######################################################################################## | ||
| # | ||
| # When using **j** to set the grid location of the inset, the default location is in | ||
| # contact with the nearby axis or axes. The offset of the inset can be set with **+o**, | ||
| # followed by the offset distance along the x- and y-axis. If only one distance is | ||
| # passed, it is applied to both axes. The unit of the distance is placed at the end. In | ||
| # the example below, the inset is shifted 0.5 centimeters on the x-axis and | ||
| # 0.2 centimeters on the y-axis. | ||
|
willschlitzer marked this conversation as resolved.
|
||
|
|
||
| fig = pygmt.Figure() | ||
| fig.coast( | ||
| region=[-74, -69.5, 41, 43], | ||
| borders="2/thin", | ||
| shorelines="thin", | ||
| projection="M15c", | ||
| land="lightyellow", | ||
| water="lightblue", | ||
| frame="a", | ||
| ) | ||
| with fig.inset(position="jBL+w3c+o0.5/0.2c", box="+pblack+glightred"): | ||
|
willschlitzer marked this conversation as resolved.
Outdated
|
||
| pass | ||
| fig.show() | ||
|
|
||
| ######################################################################################## | ||
| # | ||
| # Standard plotting functions can be called from within the ``inset`` context manager. | ||
| # The example below uses :meth:`pygmt.Figure.coast` to plot a zoomed out map that | ||
| # selectively paints the state of Massachusetts to shows its location relative to | ||
| # other states. | ||
|
|
||
| fig = pygmt.Figure() | ||
| fig.coast( | ||
| region=[-74, -69.5, 41, 43], | ||
| borders="2/thin", | ||
| shorelines="thin", | ||
| projection="M15c", | ||
| land="lightyellow", | ||
| water="lightblue", | ||
| frame="a", | ||
| ) | ||
| # This does not include an inset fill as it is covered by the inset figure | ||
| with fig.inset(position="jBL+w3c+o0.5/0.2c", box="+pblack"): | ||
|
willschlitzer marked this conversation as resolved.
Outdated
|
||
| # Use a plotting function to create a figure inside the inset | ||
| fig.coast( | ||
| region=[-80, -65, 35, 50], | ||
| projection="M3c", | ||
|
willschlitzer marked this conversation as resolved.
|
||
| land="gray", | ||
| borders=[1, 2], | ||
| shorelines="1/thin", | ||
| water="white", | ||
| # Use dcw to selectively highlight an area | ||
| dcw="US.MA+gred", | ||
| ) | ||
| fig.show() | ||
| Original file line number | Diff line number | Diff line change |
|---|---|---|
| @@ -1,5 +1,7 @@ | ||
| """ | ||
| Source code for PyGMT modules. | ||
| """ | ||
| from pygmt.src.inset import inset | ||
|
|
||
| # pylint: disable=import-outside-toplevel | ||
| from pygmt.src.meca import meca | ||
|
weiji14 marked this conversation as resolved.
Outdated
|
||
| Original file line number | Diff line number | Diff line change |
|---|---|---|
| @@ -0,0 +1,131 @@ | ||
| """ | ||
| inset - Create inset figures. | ||
| """ | ||
| import contextlib | ||
|
|
||
| from pygmt.clib import Session | ||
| from pygmt.helpers import build_arg_string, fmt_docstring, kwargs_to_strings, use_alias | ||
|
|
||
|
|
||
| @fmt_docstring | ||
| @contextlib.contextmanager | ||
| @use_alias(D="position", F="box", M="margin", N="no_clip", V="verbose") | ||
| @kwargs_to_strings(D="sequence", M="sequence") | ||
| def inset(self, **kwargs): | ||
| r""" | ||
| Create an inset within a figure to plot an additional figure. | ||
|
willschlitzer marked this conversation as resolved.
Outdated
|
||
|
|
||
| This function sets the position, frame, and margins for a smaller figure | ||
| inside of the larger figure. Plotting functions that are called within the | ||
| context manager are added to the inset figure. | ||
|
|
||
| Full option list at :gmt-docs:`inset.html` | ||
|
|
||
| {aliases} | ||
|
|
||
| Parameters | ||
| ---------- | ||
| position : str or list | ||
| *xmin/xmax/ymin/ymax*\ [**+r**][**+u**\ *unit*]] \ | ||
| | [**g**\|\ **j**\|\ **J**\|\ **n**\|\ **x**]\ *refpoint*\ | ||
| **+w**\ *width*\ [/*height*][**+j**\ *justify*] | ||
| [**+o**\ *dx*\ [/*dy*]] | ||
|
|
||
| *This is the only required argument.* | ||
|
|
||
|
willschlitzer marked this conversation as resolved.
Outdated
|
||
| Define the map inset rectangle on the map. Specify the rectangle | ||
| in one of three ways: | ||
|
|
||
| Append **g**\ *lon*/*lat* for map (user) coordinates, | ||
| **j**\ *code* or **J**\ *code* for setting the *refpoint* via a | ||
| 2-char justification code \ that refers to the (invisible) | ||
| projected map bounding box, **n**\ *xn*/*yn* for normalized (0-1) | ||
| bounding box coordinates, or **x**\ *x*/*y* for plot | ||
| coordinates (inches, cm, points, append unit). | ||
| All but **x** requires both ``region`` and ``projection`` to be | ||
| specified. You can offset the reference point via | ||
| **+o**\ *dx*/*dy* in the direction implied by *code* or | ||
| **+j**\ *justify*. | ||
|
|
||
| Alternatively, Give *west/east/south/north* of geographic | ||
| rectangle bounded by parallels and meridians; append **+r** if the | ||
| coordinates instead are the lower left and upper right corners of | ||
| the desired rectangle. (Or, give *xmin/xmax/ymin/ymax* of bounding | ||
| rectangle in projected coordinates and optionally | ||
| append **+u**\ *unit* [Default coordinate unit is meter (e)]. | ||
|
|
||
| Append **+w**\ *width*\ [/*height*] of bounding rectangle or box | ||
| in plot coordinates (inches, cm, etc.). By default, the anchor | ||
| point on the scale is assumed to be the bottom left corner (BL), | ||
| but this can be changed by appending **+j** followed by a 2-char | ||
| justification code *justify*. | ||
| **Note**: If **j** is used then *justify* defaults to the same | ||
| as *refpoint*, if **J** is used then *justify* defaults to the | ||
| mirror opposite of *refpoint*. Specify inset box attributes via | ||
| the ``box`` option [outline only]. | ||
| box : str or bool | ||
| [**+c**\ *clearances*][**+g**\ *fill*][**+i**\ [[*gap*/]\ | ||
| *pen*]][**+p**\ [*pen*]][**+r**\ [*radius*]][**+s**\ | ||
| [[*dx*/*dy*/][*shade*]]] | ||
|
|
||
| If passed ``True``, this draws a rectangular box around the map | ||
| inset using the default pen; specify a different pen | ||
| with **+p**\ *pen*. Add **+g**\ *fill* to fill the logo box | ||
| [Default is no fill]. | ||
| Append **+c**\ *clearance* where *clearance* is either | ||
| *gap*, *xgap*\ /\ *ygap*, or *lgap*\ /\ *rgap*\ /\ *bgap*\ /\ | ||
| *tgap* where these items are uniform, separate in x- and | ||
| y-direction, or individual side spacings between logo and border. | ||
| Append **+i** to draw a secondary, inner border as well. We use a | ||
| uniform *gap* between borders of 2\ **p** and the default pen | ||
| unless other values are specified. Append **+r** to draw rounded | ||
| rectangular borders instead, with a 6\ **p** corner radius. You | ||
| can override this radius by appending another value. Append | ||
| **+s** to draw an offset background shaded region. Here, *dx*/*dy* | ||
| indicates the shift relative to the foreground frame | ||
| [4\ **p**/-4\ **p**] and *shade* sets the fill style to use for | ||
| shading [Default is gray50]. | ||
| margin : int or str or list | ||
| This is clearance that is added around the inside of the inset. | ||
| Plotting will take place within the inner region only. The margins | ||
| can be a single value, a pair of values separated (for setting | ||
| separate horizontal and vertical margins), or the full set of four | ||
| margins (for setting separate left, right, bottom, and top | ||
| margins). When passing multiple values, it can be either a list or | ||
| a string with the values separated by forward | ||
| slashes [Default is no margins]. | ||
|
willschlitzer marked this conversation as resolved.
|
||
| no_clip : bool | ||
| Do NOT clip features extruding outside map inset boundaries [Default | ||
| will clip]. | ||
| {V} | ||
|
|
||
| Examples | ||
| -------- | ||
| >>> import pygmt | ||
| >>> | ||
| >>> # Create the larger figure | ||
| >>> fig = pygmt.Figure() | ||
| >>> fig.coast(region="MG+r2", water="lightblue", shorelines="thin") | ||
| >>> # Use a "with" statement to initialize the inset context manager | ||
| >>> # Setting the position to top left and a width of 3.5 centimeters | ||
| >>> with fig.inset(position="jTL+w3.5c+o0.2c", margin=0, box="+pgreen"): | ||
| ... # Map elements under the "with" statement are plotted in the inset | ||
| ... fig.coast( | ||
|
willschlitzer marked this conversation as resolved.
|
||
| ... region="g", | ||
| ... projection="G47/-20/?c", | ||
|
willschlitzer marked this conversation as resolved.
Outdated
|
||
| ... land="gray", | ||
| ... water="white", | ||
| ... dcw="MG+gred", | ||
| ... ) | ||
| ... | ||
|
willschlitzer marked this conversation as resolved.
|
||
| >>> # Map elements outside the `with` block are plotted in the main figure | ||
|
willschlitzer marked this conversation as resolved.
Outdated
|
||
| >>> fig.logo(position="jBR+o0.2c+w3c") | ||
|
willschlitzer marked this conversation as resolved.
|
||
| """ | ||
| kwargs = self._preprocess(**kwargs) # pylint: disable=protected-access | ||
| with Session() as lib: | ||
| try: | ||
| lib.call_module("inset", f"begin {build_arg_string(kwargs)}") | ||
| yield | ||
| finally: | ||
| v_arg = build_arg_string(kwargs.fromkeys("V")) | ||
| lib.call_module("inset", f"end {v_arg}".strip()) | ||
|
weiji14 marked this conversation as resolved.
Outdated
|
||
| Original file line number | Diff line number | Diff line change |
|---|---|---|
| @@ -0,0 +1,42 @@ | ||
| """ | ||
| Tests for the inset function. | ||
| """ | ||
| from pygmt import Figure | ||
| from pygmt.helpers.testing import check_figures_equal | ||
|
|
||
|
|
||
| @check_figures_equal() | ||
| def test_inset_aliases(): | ||
| """ | ||
| Test the aliases for the inset function. | ||
| """ | ||
| fig_ref, fig_test = Figure(), Figure() | ||
| fig_ref.basemap(region="MG+r2", frame="afg") | ||
| with fig_ref.inset(D="jTL+w3.5c+o0.2c", M=0, F="+pgreen"): | ||
| fig_ref.basemap(region="g", projection="G47/-20/4c", frame="afg") | ||
|
willschlitzer marked this conversation as resolved.
Outdated
|
||
|
|
||
| fig_test.basemap(region="MG+r2", frame="afg") | ||
| with fig_test.inset(position="jTL+w3.5c+o0.2c", margin=0, box="+pgreen"): | ||
| fig_test.basemap(region="g", projection="G47/-20/4c", frame="afg") | ||
| return fig_ref, fig_test | ||
|
|
||
|
|
||
| @check_figures_equal() | ||
| def test_inset_context_manager(): | ||
| """ | ||
| Test that the inset context manager works and, once closed, plotting | ||
| elements are added to the larger figure. | ||
| """ | ||
| fig_ref, fig_test = Figure(), Figure() | ||
|
|
||
| fig_ref.basemap(region=[-74, -69.5, 41, 43], projection="M9c", frame=True) | ||
| fig_ref.basemap(rose="jTR+w3c") # Pass rose argument with basemap before the inset | ||
| with fig_ref.inset(position="jBL+w3c+o0.2c", margin=0, box="+pblack"): | ||
| fig_ref.basemap(region=[-80, -65, 35, 50], projection="M3c", frame="afg") | ||
|
|
||
| fig_test.basemap(region=[-74, -69.5, 41, 43], projection="M9c", frame=True) | ||
| with fig_test.inset(position="jBL+w3c+o0.2c", margin=0, box="+pblack"): | ||
| fig_test.basemap(region=[-80, -65, 35, 50], projection="M3c", frame="afg") | ||
| fig_test.basemap(rose="jTR+w3c") # Pass rose argument with basemap after the inset | ||
|
|
||
| return fig_ref, fig_test | ||
Uh oh!
There was an error while loading. Please reload this page.