Plotting Timeseries in Python#345
Conversation


|
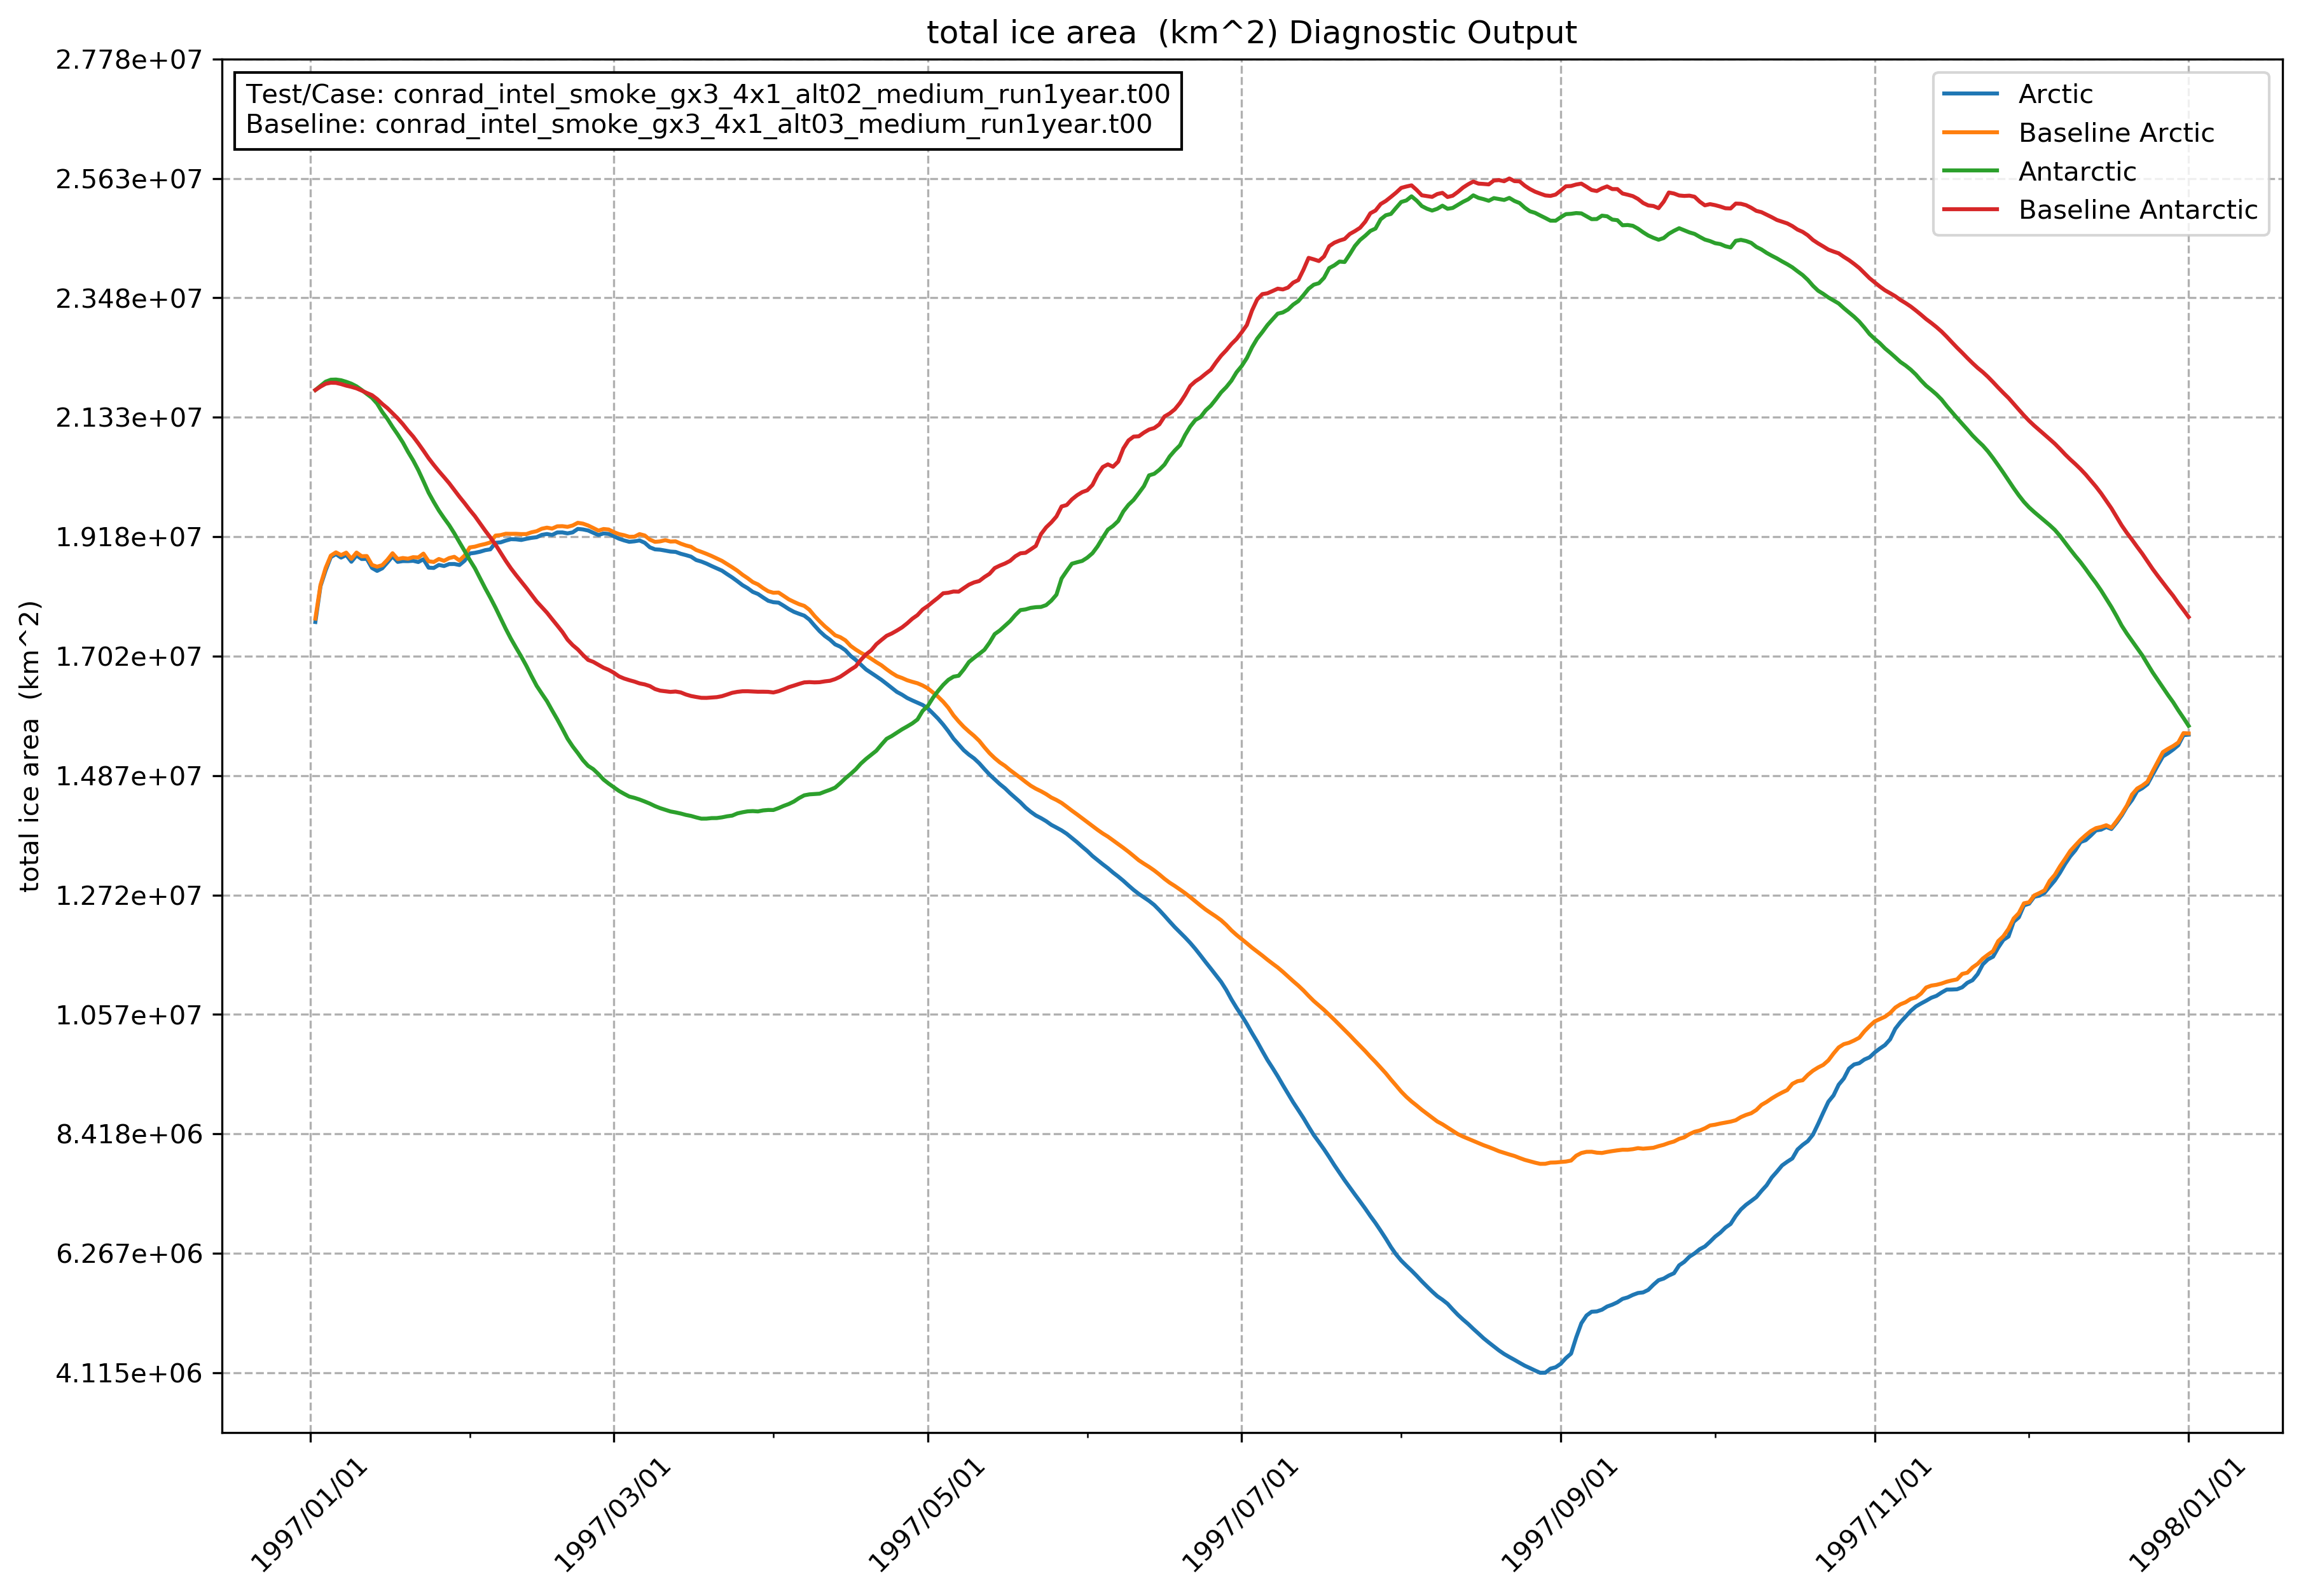
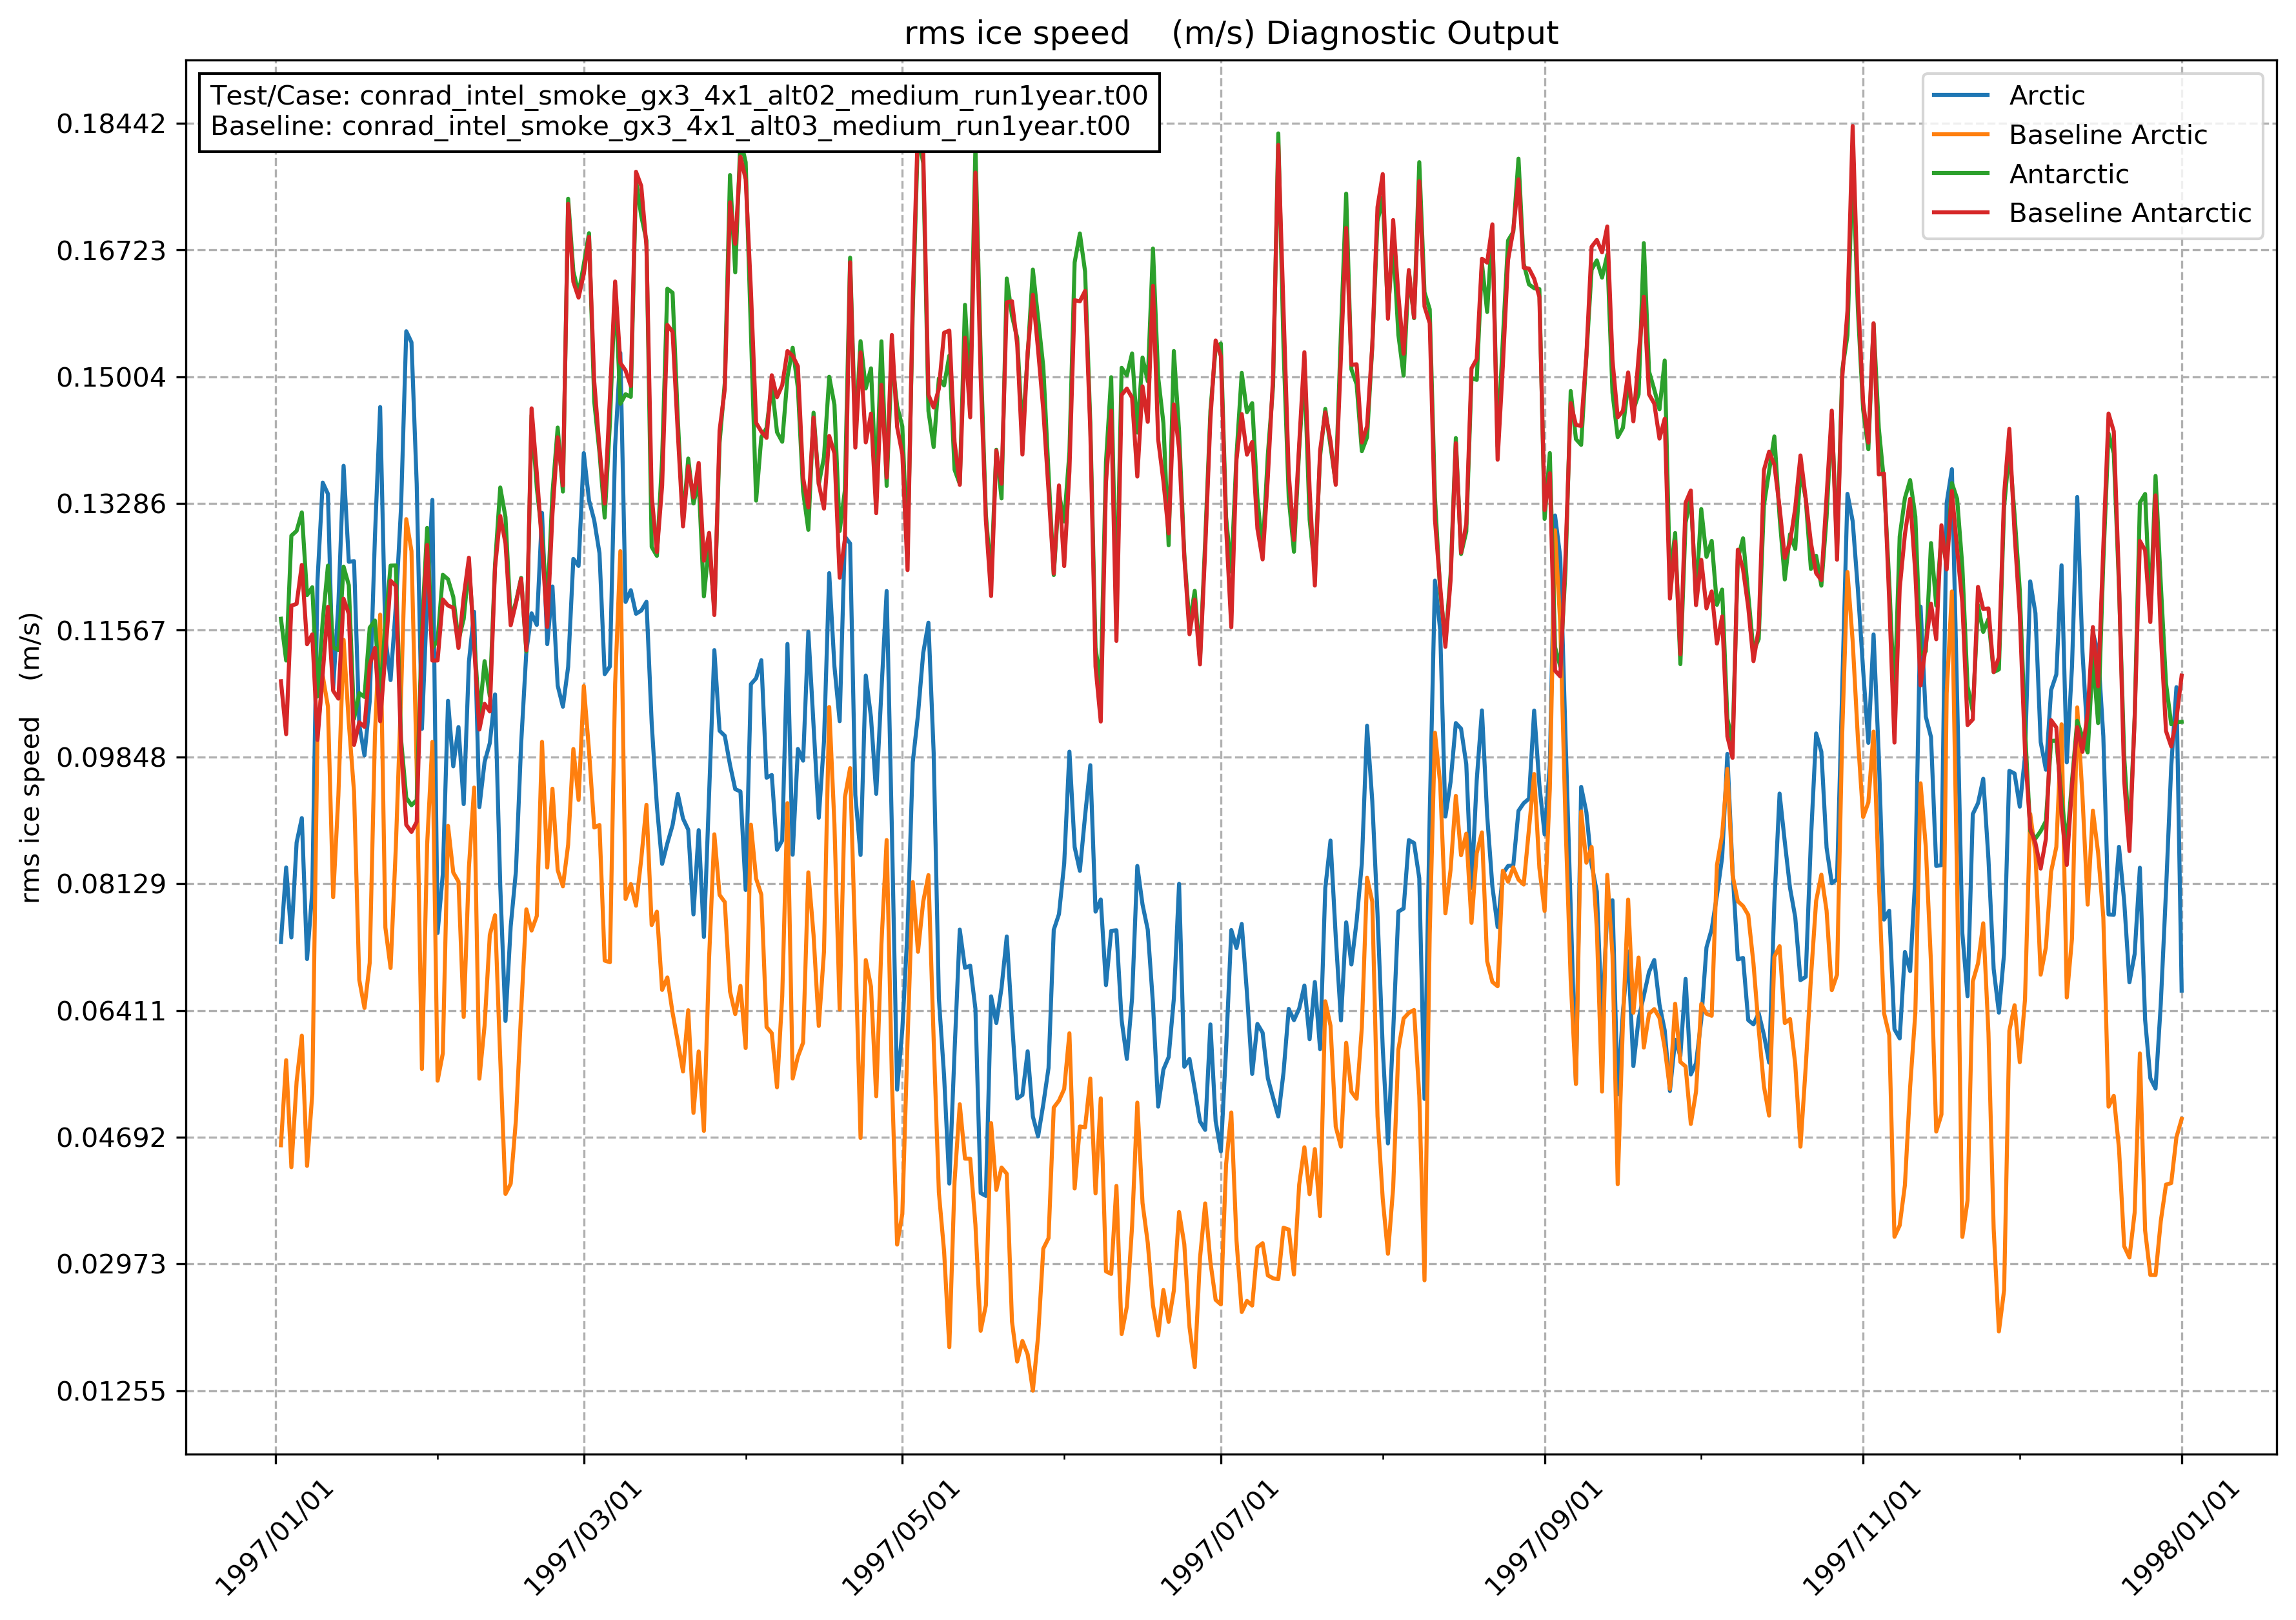
This PR is not ready to be merged. I still need to update the documentation. However, here are a few figures that were generated by the script using 2 random 1-year CICE runs.
The grid lines are an optional argument (enabled by adding |

|
This looks very nice! |
…dify cice.setup to automatically copy the timeseries.py script to the test suite directory.
…hlighting occurs.
|
Ok, documentation has been updated. I still have the Before merging this, are there any other options that I should include in the script? For example,
|

 apcraig
left a comment
apcraig
left a comment
apcraig
left a comment
There was a problem hiding this comment.
I'm confused about timeseries.py. Is this a new file? It looks like it's incomplete ending in the middle of an if statement?
|
It is a new file. I thought, for now, it would be better to keep the original The end of the file: is not incomplete. While most programming and scripting languages use braces |

|
@mattdturner sounds good, thanks for the clarification. Let me know when you think this is ready to merge, I will do a final review and then merge the PR. As it stands, the changes are fine by me. |

|
This should be ready to be merged. I can always add new features (if requested) at a later time. |

|
Thank you @mattdturner. I'm fine with this addition, but since I'm not an expert python user (far from it!), I'd like at least one person who has more experience to give this a try on a different system from the one it was designed on, as a sanity check. @phil-blain @rgrumbine @proteanplanet @apcraig ? |
|
I'm checking out the branch now and trying on cheyenne. |
|
I am having some problems on cheyenne. I am going to take the discussion offline to email with @mattdturner to provide some feedback and try to work thru some of the problems. |


There was a problem hiding this comment.
I tried the script in different conda environments and it works correctly with matplotlib 1.5.1, 2.2.3, 2.2.4.
With matplotlib 1.3.1 (system install) I obtain an error fro matplotlib :
INFO:__main__:Log file = /home/phb001/data/site2/cice/runs/brooks_intel_smoke_gx1_44x1_medium_qc.qc_base_20190626/cice.runlog.190630-033320
Traceback (most recent call last):
  File "./timeseries.py", line 275, in <module>
    main()
  File "./timeseries.py", line 272, in main
    plot_timeseries(args.log_dir, field, dtg, arctic, antarctic, expon, grid=args.grid)
  File "./timeseries.py", line 138, in plot_timeseries
    anchored_text = AnchoredText(text_field,loc=2)
  File "/usr/lib/pymodules/python2.7/matplotlib/offsetbox.py", line 1102, in __init__
    propkeys = prop.keys()
AttributeError: 'NoneType' object has no attribute 'keys'
I'm not sure if this is actually caused by the matplotlib version since the different environments also have different versions of numpy...
Maybe to be on the safe side we should list the tested packages versions in the documentation.
| # Build the fieldlist based on which fields are passed | ||
| fieldlist = [] | ||
| if args.area: | ||
| fieldlist.append('total ice area (km^2)') |
There was a problem hiding this comment.
It would be nice if the graph title and the ylabel would format the ^2, ^3 as exponents.
…els) using LaTeX format. Additionally, ensure that the output file has a proper name no matter what directory the script is run from.
|
I tested the latest and it's working for me on cheyenne. I had to be careful because the system was loading several different python versions to my env, but pip went with only one of them, so I had to make sure I was using a self-consistent setup. I don't seem to have much luck getting python to work. Just a couple other comments which I also made offline,
I don't know whether the above list should be fixed now or deferred or a bit of both. I think it would be great to make another set of changes if we think there are some additional improvements that could be made. |
I'll implement this today.
I would prefer only having 1 script as well. My personal inclination is to just have the Python script, but that is partly because Python is my scripting language of choice. I'm open to keeping both until the Python script is more widely tested to ensure that it works properly for many users in many cases.
Right now, the script just grabs the most recently modified output file. I could add an option to the Python script to either allow the user to pass a specific output file, or an option to plot the data from all output files. Thoughts?
I'm not sure if the community will be using them much. I think they are very convenient to just quickly get an idea of what is happening during the simulation. But for now, I will set the scripts to automatically be copied into case directories.
I agree. These plotting scripts are not testing-specific. I can move the documentation to the user guide section. |
…configuration/scripts
…se directory instead of only test suite directories
|
I pushed some new commits.
Done
Both scripts are still in the repo for now.
The Python script has been updated to allow users to pass a specific log file. If a directory is passed, the most recently modified log file is used.
Done
The documentation for the timeseries scripts has been moved to the Running CICE section (https://mattdturner-cice.readthedocs.io/en/update_timeseries/user_guide/ug_running.html#timeseries-plotting) |
|
I have tested this on cheyenne and it seems to be working. I think this can be merged after maybe one more update to the documentation. Thanks for moving the documentation, I think that works well. I have a few comments.
|
|
I updated the documentation (https://mattdturner-cice.readthedocs.io/en/update_timeseries/user_guide/ug_running.html#timeseries-plotting) |

 eclare108213
left a comment
eclare108213
left a comment
eclare108213
left a comment
There was a problem hiding this comment.
Looks good to me, with the caveat that I haven't tried to use either script recently.
|
Thank you for the updates @mattdturner , documentation looks great. |


|
All:
I've been keeping an eye on the comments. All has been looking reasonable.
I'm not yet enough of a python person to have much to contribute there. And
our python installations (even within NCEP/NOAA) are so wildly different
from each other, and questionably installed, that I can't really say much.
Today, for instance, the urllib on one system was denying that it has any
member 'request'. When that's kind of the purpose of urllib.
Bob
…On Thu, Aug 22, 2019 at 5:49 PM Elizabeth Hunke ***@***.***> wrote:
***@***.**** approved this pull request.
Looks good to me, with the caveat that I haven't tried to use either
script recently.
—
You are receiving this because you were mentioned.
Reply to this email directly, view it on GitHub
<#345?email_source=notifications&email_token=AFQ65HLJP2BMNFJ3BTFWQADQF4CXPA5CNFSM4IKKJGH2YY3PNVWWK3TUL52HS4DFWFIHK3DMKJSXC5LFON2FEZLWNFSXPKTDN5WW2ZLOORPWSZGOCCOLLRQ#pullrequestreview-278705606>,
or mute the thread
<https://github.com/notifications/unsubscribe-auth/AFQ65HLV4MQFVXJVUHBSBGDQF4CXPANCNFSM4IKKJGHQ>
.
--
Tel: 301-683-3747
Coupling and Dynamics Group
|

|
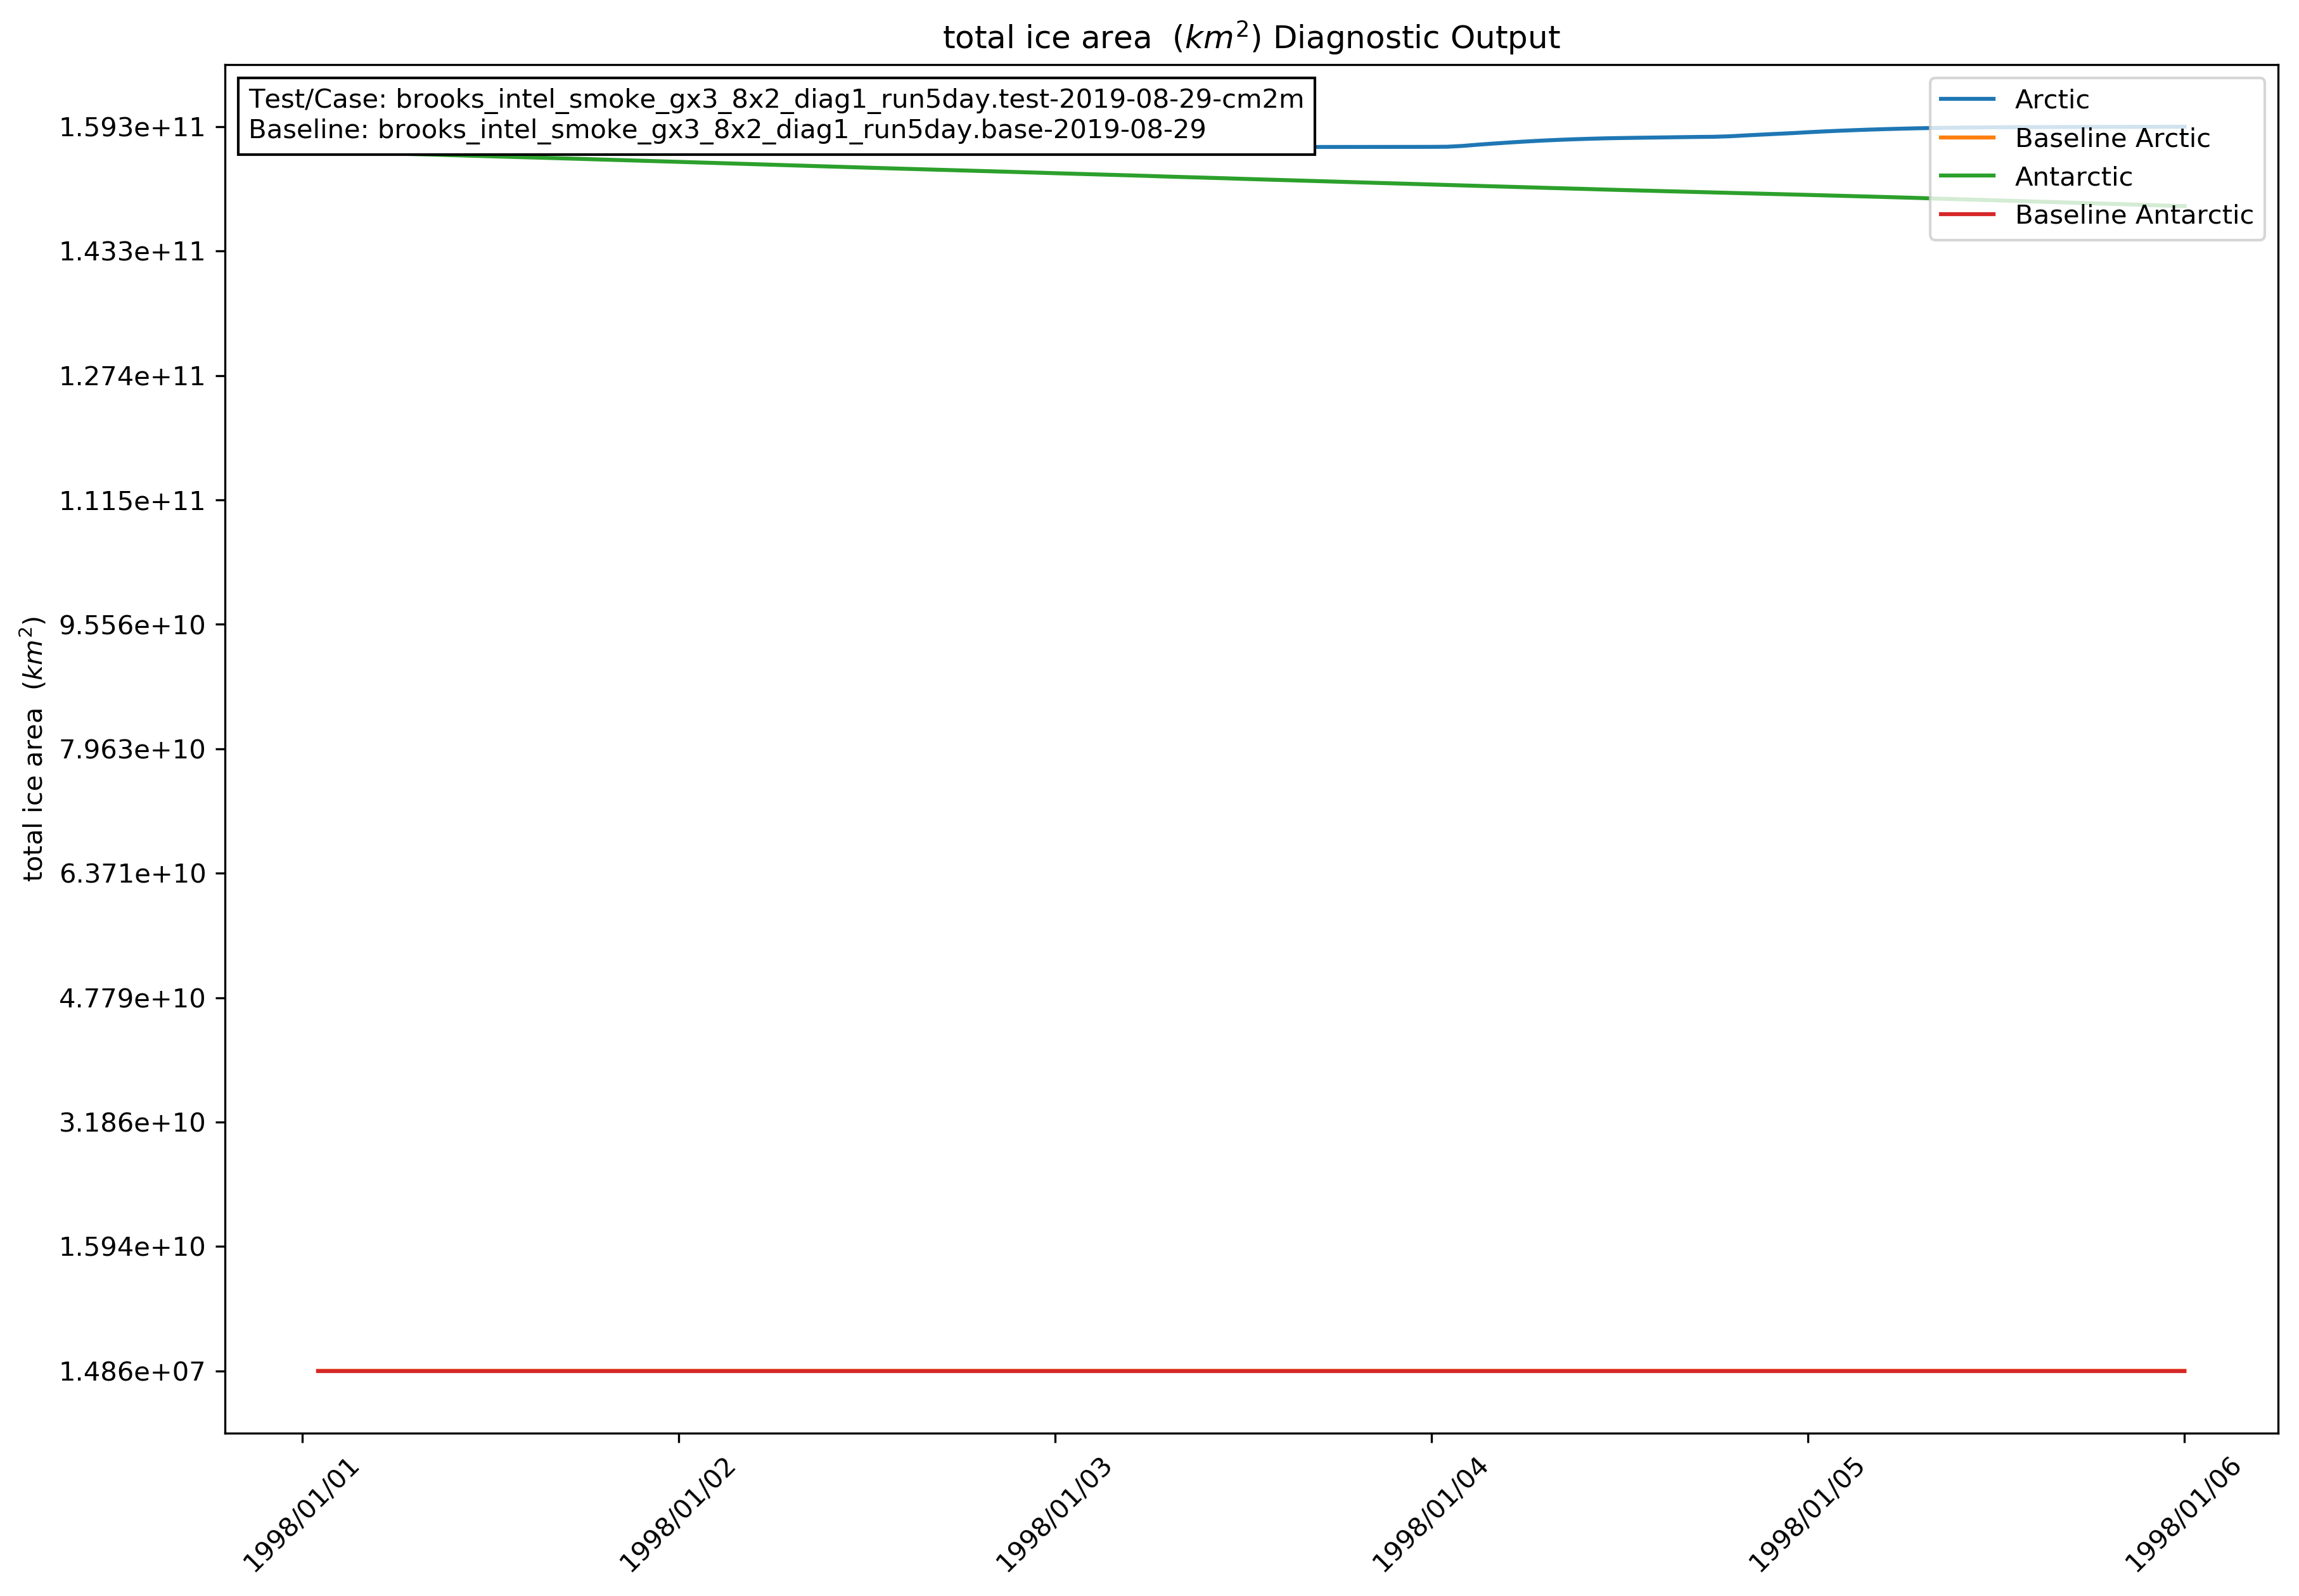
I just tried the script on a real regression test (base_suite) and I have a feature request : use different linestyles for the 'test' and 'baseline' lines, so that we can more easily see if some lines are superposed : Here I think the Arctic test and baseline are actually BFB and are superposed, but it would be cool to have either the baseline or test line in dashed linestyle so we can still see both. |
5 participants


PR checklist
This PR replaces the previous timeseries plotting script (timeseries.csh) with a new Python-based script.
@mattdturner
N/A since no CICE code is changed
The Python script is dependent on the Python packages
numpy,logging,os,sys,matplotlib,re,datetime, andargparse.- Many of these packages should be included by default with Python installs
- Once this is finalized and approved, I will make the same changes to the Icepack timeseries script.