Add Sonata example #361
Add Sonata example #361
Conversation
Codecov ReportAll modified and coverable lines are covered by tests ✅
Additional details and impacted files@@ Coverage Diff @@
## master #361 +/- ##
=======================================
Coverage 66.22% 66.22%
=======================================
Files 33 33
Lines 6504 6504
Branches 2279 2279
=======================================
Hits 4307 4307
Misses 273 273
Partials 1924 1924 ☔ View full report in Codecov by Sentry. |
There was a problem hiding this comment.
Looks fantastic! Great work.
Could you also mention the following information at the very beginning of the notebook:
- Mention the brain region and species "non-barrel primary somatosensory cortex of juvenile rat" circuit
- include a link to the accompanying publication: https://www.biorxiv.org/content/10.1101/2023.05.17.541168v2.abstract
- Mention that the large circuit is available for your analysis at Zenodo: https://zenodo.org/records/8026353
|
Brilliant, looks very good. Could you just add the cell ids on the last 3 plots on the plot titles? |
|
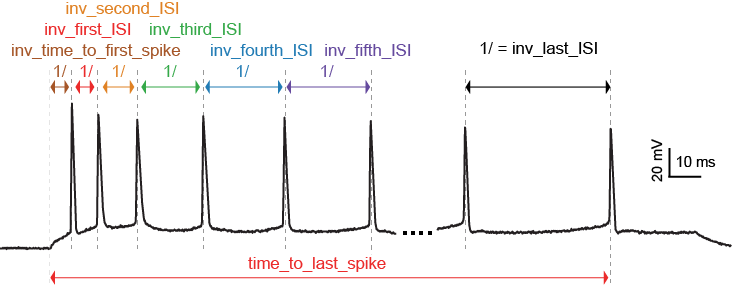
Okay the last request :) Let's show also a spike_event feature. Could you plot the inter-spike-intervals in another plot at the bottom of the notebook? You can use the "all_ISI_values" feature to get all the time differences btw. the spikes. https://efel.readthedocs.io/en/latest/eFeatures.html#libv5-all-isi-values It should look like this: https://efel.readthedocs.io/en/latest/_images/inv_ISI.png There is no need to name them first_ISI, second_ISI but it would be great to add their numeric values on the horizontal lines. E.g. 12ms, 10ms. Thanks |
No description provided.