VoIP: fundamentals of SIP and related topics - part #6: audio problems and the quality of a VoIP call
In the previous episode I talked about the main tools for working with VoIP.
In this episode, I'll continue on this trend, talking about the audio problems and quality of communication.
Good customer service includes quality control with proactive monitoring and feedback analysis for continuous improvement.
Proactive monitoring can be somewhat expensive (but we will see that it does not necessarily have to), but it is definitely a long-term investment.
In your opinion is it better to save on proactive monitoring and quality systems and that your customer reports anomalies and poor quality of calls, or is it better that you monitor the quality of services and that you proactively contact the customer (before do him) in case of anomalies?
I am talking about combining the more classic QoS with QoE.
In this article I will talk about:
- which are the parameters to be taken into account to evaluate an audio problems
- which are the parameters to be taken into account to evaluate the goodness of a call
- how to monitor these values
## Audio problems
The main audio problems are related to:
- internet connection problems: if your internet connection is poor, or is not dedicated to VoIP audio, you can run into the following problems
- Packet loss: the packet loss in a VoIP call is recognizable by a robotic or synthetic voice and gaps
- Jitter: jitter is the divergence of an expected voice packet from its presumed arrival time. For instance, two packets may arrive at the same time, or out of order due to network congestion. These problems can cause audio quality to drop. A jitter buffer then is an intermediary queue that’s used to order packets according to their expected timing values in an attempt to minimize jitter. Using a jitter buffer can potentially improve call quality. The Jitter in a VoIP call is recognizable by a distorted voice
- Latency: The high latency in a real-time communication risks making the service unusable. The Latency in a VoIP call is recognizable by a collisions when people start to talk at the same time
The tools mentioned in the previous article can help you find out if the call was affected by these network problems.
- other strange audio problems
- echo: echo problems follow 3 main rules
- is always generated in the opposite side of who is hearing the echo
- is frequently caused by the PSTN, use and echo canceller
- turn-off the speaker phone and use the handset to test
- echo: echo problems follow 3 main rules
There's an old but interesting CISCO guide titled "Recognizing and Categorizing Symptoms of Voice Quality Problems", that I found thanks to Flavio E. Goncalves, which can be useful for categorizing the audio problem you are having.
You can find it here: https://www.cisco.com/c/en/us/support/docs/voice/voice-quality/30141-symptoms.html
A fundamental metric to analyze the goodness of a VoIP call is the MOS (Mean Opinion Score).
MOS is terminology for audio, video and audiovisual quality expressions as per ITU-T P.800.1. It refers to listening, talking or conversational quality, whether they originate from subjective or objective models.
Very Good: 4.3-5.0
Bad: 3.1-3.6
Not Recommenced : 2.6-3.1
Very Bad: 1.0-2.6
Calculating the MOS of each call could be challenging; fortunately the RTCP protocol comes to our aid: RTCP is a protocol that collects statistics on the quality of service of the RTP protocol and carries information about the participants in a session.
Each VoIP call then uses the SIP to "organize and manage" the call, the RTP to manage the exchange of audio and the RTCP to monitor its quality.
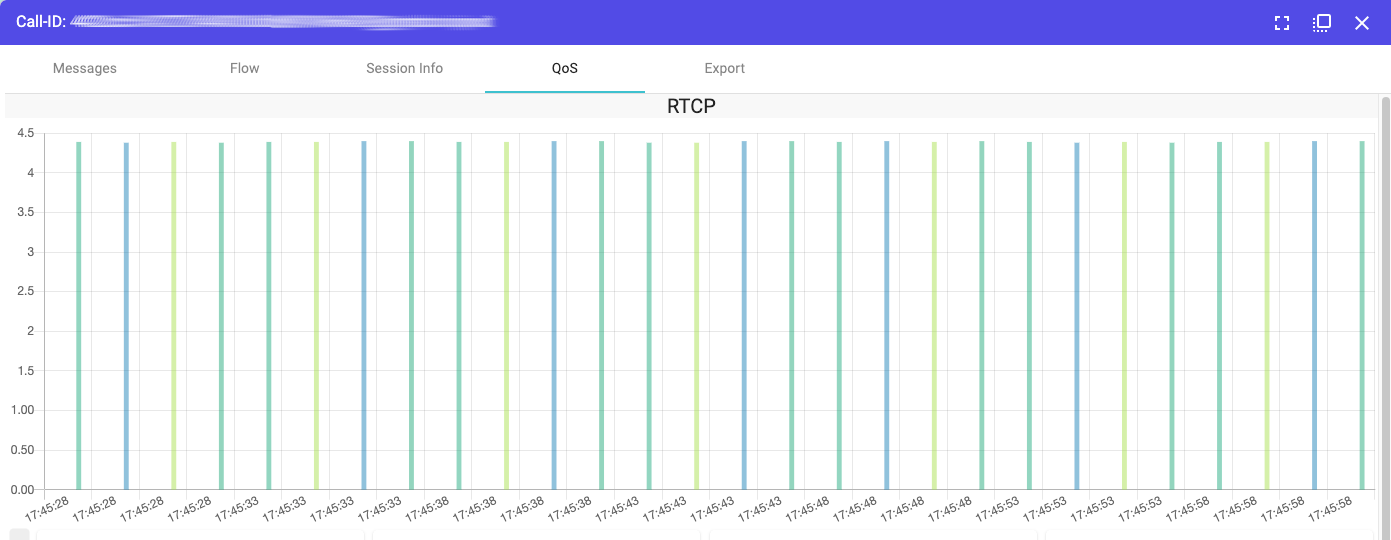
Homer (just to name one at random :) ) makes our life even easier as it traces the RTCP data into a very comfortable graphic format like this
The quality, in a broad sense, of a call is not only given by the goodness of the audio stream.
There are other parameters that those who do business with VoIP traffic must take into consideration.
The ACD and ASR parameter are the most commonly used metrics to indicate VoIP route quality, but there are also other interesting ones:
- ACD (Average call duration): It is the average length of an answered call made over the network:
ACD = duration of all answered calls / number of answered calls
For example, if there were 62 answered calls with a total duration of 145 minutes, then:
ACD = 145 [duration of all answered calls] / 62 [total number of answered calls] = 2.34 minutes
An ACD of 4–5 minutes is considered okay, whereas anything above 6 minutes is excellent. - ASR (Answer-Seizure Ratio): ASR is the percentage of the number of successfully connected calls to the number of attempted calls (it is also called the call completion rate):
ASR % = (total number of answered calls / total number of calls) × 100
For example, if there were 156 calls dialed of which 62 were successfully connected, then:
ASR (%) = (62 [successful calls] / 156 [dialed calls]) x 100 = 39.74%
ASR should be at least 40–50%, and anything above 60% would indicate an excellent quality service. - NER (Network Effectiveness Ratio): NER measures the ability of a network to deliver a call to the called terminal. Busy signals and other call failure due to user behaviour are counted as "successful call delivery" for NER calculation purposes. Unlike ASR, NER excludes the effects of customer and terminal behaviour.
NER(%) = ((answered calls + user busy + ring no answer + terminal reject)/(total number of calls)) x 100 - PDD (Post-Dial Delay) Post-dial delay is the measurement of how long it takes for a calling party to hear a ringback tone after initiating a call. Technically it is the delta between the SIP INVITE and a 180 Ringing or 183 Session Progress response. High PDD values are the main reasons for the low ASR. People don’t want to wait too long before hearing the ringtone, and they close the phone when it’s not connected. This will cause to miss calls. When the caller closes, call ends and there will be no re-route.
Also in this article I will again mention the Sipcapture team and and their valuable work done in the latest versions of Homer; they integrated Grafana, creating default dashboards that track a lot of very interesting data, for example the datas from RTCP
You can also find the Homer's Grafana dashboard here: https://grafana.com/grafana/dashboards/11764
In my experience, I have combined the use of Homer with a double control based on zabbix&grafana.
I use Homer's Grafana dashboards to monitor the general trend of the call flow passing through our SIP servers, while I use a specific data collection via Zabbix&Grafana to track and graph the specific data of the call quality and quantity with the carriers; I need this to keep constantly monitored our suppliers.
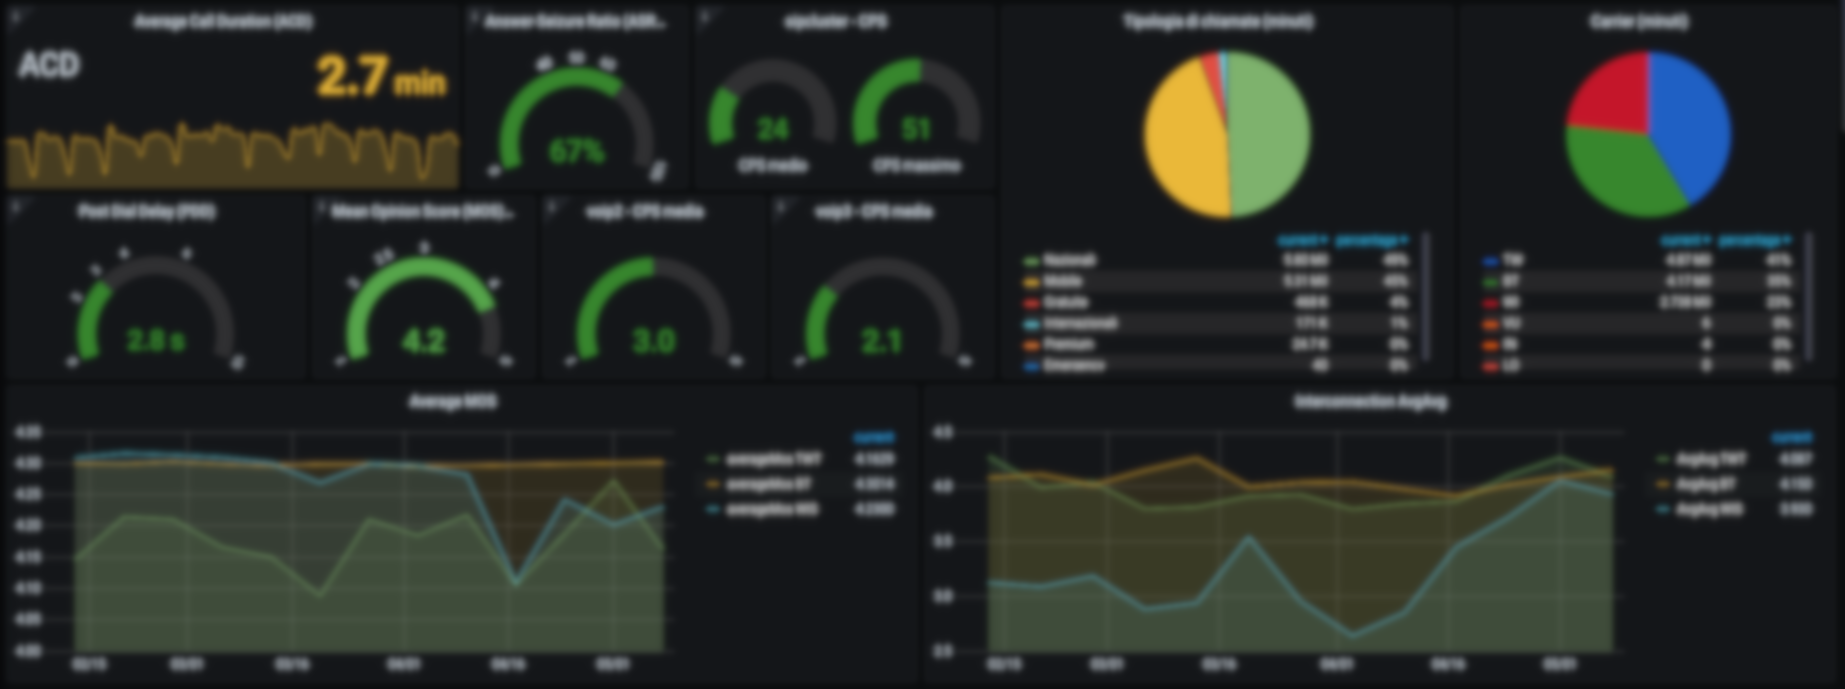
This is an example of one of our Grafana boards to track the quality of the service provided to us by suppliers in real time
The use of tools like grafana are also powerfull to predict the trend of the use of your resources.
So my advice at the end of this article as Hans Rosling says in his book Factfulness is: rely on the data, they are the only antidote to the cliché
That’s all for this episode too. Let me know what you think about it.
Thanks a lot for reading, sharing and comment this article.
Thanks to undraw.co for the beautiful illustration I used in the header
Cheers!
To be continued …


